SlideShare ist ein Scribd-Unternehmen logo
1 von 13
Downloaden Sie, um offline zu lesen
RISK AND STANDARDS BASED APPROACH TO RIP RAP DESIGN
ALTERNATIVES FOR GRAHAMSTOWN DAM STAGE 2
AUGMENTATION
M. B. Barker1
and D. Holroyde2
ABSTRACT. A detailed study was completed for the Stage 2 works of the Grahamstown Dam
augmentation to investigate various alternatives for the slope protection of the Saddle Dam and
Subsidiary Dam embankments, including a standards based and a risk management approach. The
standards based approach required an evaluation of the slope protection level and least cost option
based on the hazard rating of the dam. Due to the sand construction of the embankments, it was
possible to apply a wave erosion model SBEACH to develop an economic risk model for optimising
the slope protection alternatives. The erosion model included the effects of the wind direction,
reservoir level and wind speed variation during flood events, embankment profile and material
parameters. The risk management approach clearly showed that significant cost savings could be
achieved by using the risk management approach. Furthermore, the cost curves indicated the
sections of the embankments for which present capital works would not be economically justified and
for which ongoing maintenance works would be economically advantageous.
1
Principal Engineers Dams & Geotechnical, Gutteridge Haskins & Davey Pty Ltd, Brisbane, QLD
2
Water Resource Engineer, Planning, Hunter Water Corporation, Newcastle, NSW
1 Introduction
Grahamstown Dam is a major water supply
source for the Newcastle area and it is
proposed to raise the present full supply by
2.4m from RL 10.4m to RL 12.8m. The dam,
as shown on Figure 1 comprises the following
embankments:
• The Pacific Highway to the north west of the
reservoir
• The Main Dam to the West
Figure 1 - Locality Plan
• The Subsidiary/Saddle Dam to the South
• The new embankment adjacent to the
proposed spillway to the north west
With the exception of the new embankment, all
of the existing embankments have been
constructed of sand. The main and saddle dam
embankments have a central core while the
subsidiary embankment has a bentonite sand
cut-off.
The raising is being completed in stages for
which Stage 1 comprised raising the core level
of the existing embankments to a level required
for the Stage 2 full supply level and rip rap
slope protection of the main embankment. The
stage 2 works comprises construction of a new
spillway and associated embankment, a culvert
below the Pacific Highway to pass the new
spillway flows, a protection bund for the
Newline Road and pollution control works.
To comply with the Supplementary
Environmental Impact Statement for the Stage
2 works, approximately 3000m of the Saddle
Dam and Subsidiary Dam upstream slopes
required investigation and design of slope
protection works. The objectives were to
provide protection works in accordance with
the ANCOLD 2000 Guidelines for Selection of
Acceptable Flood Capacity for Dams to the
satisfaction of the New South Wales Dam
Safety Committee.
2 Hazard Classification
The Main Dam has a hazard classification of
High A due to the population at risk
downstream of the main embankment and the
high value of the stored water. This
classification is applicable to the
implementation of Surveillance and Operation
and Maintenance procedures.
Subject to New South Wales Dam Safety
Committee approval, where there are distinct
embankments comprising the dam, each
structure may be considered separately for dam
design.
Based on the reduced consequences of Saddle
Dam and Subsidiary Dam failure, the hazard
rating to be used for design of the slope
protection works for the Saddle Dam and
Subsidiary Dam was assessed to be between
Significant and High A. The acceptable flood
capacity for a Significant Hazard Category
Dam is in the range from 1:1000 to 1:10,000
AEP flood but not less than at least half the
PMF while the acceptable flood capacity for the
High A Hazard category dam is the PMF. As
shown in Table 1, the calculated 1:10,000 AEP
event is about half the PMF and was used for
the standards based approach to the design of
the Grahamstown Subsidiary and Saddle Dam
slope protection works.
Flood Event
ARI (years)
Outlfow
(m3
/s)
Max RL
(m)
10 99 13.15
100 143 13.32
1000 240 13.53
10,000 350 13.73
PMF 628 14.12
Table 1 - Grahamstown Dam Floodrouting
Data
3 Embankment Descriptions
The Saddle Dam and Subsidiary Dam from
chainage 0m to 650m are sand embankments
with an upstream slope of about 8H on 1V and
a downstream slope of 4H on 1V. The Saddle
Dam has a vertical impervious clay core of
approximately 6.1m wide while the Subsidiary
Dam has a 1.5m wide bentonite sand cut-off.
Rip rap slope protection on these embankment
sections was generally placed at a slope of
about 2H on 1V up to RL 12.8m with a
thickness of 910mm and a d50 of 460mm.
The Subsidiary Dam between chainage 650m to
about 2000m comprises sand embankments on
natural ground (sand). The upstream slope
varies from about 14H on 1V for the natural
ground surface to 6H on 1V for the placed
embankment. The section profile and slope
protection varies along this section of the
embankment for which there are no design
details. Rip rap slope protection has been
placed in areas of the embankment which have
suffered beach erosion in the past as well as a
300m length of the embankment (Embankment
section 5 of Figure 3) where rip rap slope
protection of about 2m width has been placed
along the embankment. The embankment
sections are grassed on the upstream side above
the level of any rip rap to the crest of the
embankment.
During the Stage 1 construction, the core
sections of all embankemnts were raised using a
300mm wide bentonite/clay section placed
along the centre line of the core and extending
up to the crest level at about RL 14.8m.
4. Slope Protection Options
The following options were considered for the
riprap protection as shown in Figure 2.
• RipRap layer placed along slope of the
embankment with underlying filter or
geotextile filter fabric to prevent washing
out of sand from the existing embankment.
• Rip Rap Berm with underlying geotextile
filter fabric to prevent washing out of sand
from the existing embankment.
• Rip Rap Berm alternative design using a rip
rap zone supported on earthfill with
underlying geotextile filter fabric to prevent
washing out of sand from the existing
embankment.
• Reno Mattress placed on the embankment
slope and keyed into the existing rip rap
with a gabion at the top level for anchoring
the mattress and underlying geotextile filter
fabric to prevent washing out of sand form
the existing embankment.
• Gabions placed on the existing rip rap with
underlying geotextile on the embankment
sand material to prevent washing out of the
sand.
The Saddle Dam and Subsidiary Dam vary in
section along the embankment and typical cross
sections and embankment lengths were selected
for the study, as shown on Figure 3.
Figure 3 - Location of Cross Sections used for Slope Protection Analysis
Figure 2 - Slope Protection Options
5 Standards Based Evaluation
The standards based or deterministic approach
to the design and selection of the preferred
slope protection option was carried out as
follows:
• Wind Data Analysis
The 10minute, 3 hourly interval wind speed
data for the Williamtown RAAF Base, which is
located approximately 5km south east of the
dam was analysed for the period from 1942 and
1999. The 1year, 10year and 100 year ARI
peak wind speeds were estimated for various
directions perpendicular to the embankments
using Normal, Log-normal and Log Pearson III
statistical methods. An alternative method of
estimating wind speeds was carried out using
the Australian Wind Code AS 1170.2-1989.
The maximum hourly wind speed obtained
from the statistical analysis and the Australian
Wind Code as well as the USBR design wind
speed of 30m/s were used for the wave
estimation and rip-rap design.
• Estimation of Wave Height and Run up
The wave height and wave run up data for each
embankment was calculated using the
procedure given in the ACER Technical
Memorandum No 2 - 1992 using the following
steps:
ð Calculation of the effective fetch for each
embankment section;
The effective fetch for the embankments was
calcuated to be in the order of 4.8km
ð Adjust the overland wind speed to obtain
overwater speeds;
The correction factors determined by USBR
(1981) were used to select a wind velocity ratio
of 1.26 for the effective fetch.
ð Calculate the wind set up;
The wind setup is the rise in the water level at
the leeward end of the fetch resulting from the
shear force of the wind over the water.
ð Calculate the significant wave height, wave
length and wave period;
The significant wave height Hs, represents the
average wave height of the highest one-third of
the waves present in each interval.
If the water depth is greater than one half the
wave length, the waves can be considered to be
deep water waves. In the case of Grahamstown
Dam, which is a relatively shallow reservoir, the
water depth was marginally less than half the
wave length but the difference in the deep and
shallow water wave heights for the
Grahamstown Dam was not significant.
ð Calculate the wave run-up on the
embankment slope.
Wave runup, R, which is the vertical difference
between the maximum level attained by the rush
of water up the slope and the stillwater elevation
was estimated using the ACER formula:
R
H
H
L
S
S
=
+





0 4
0 5
. * cot( )
.
θ
Where:
R = Wave runup (m)
Hs = Significant Wave height (m)
L = Wave length (m)
θ = Angle of the dam face from the horizontal
(°)
The wind set up and wave run up were
calculated for upstream slopes of 2H:1V,
6H:1V, 8H:1V and 10H:1V using the 1, 10 and
100 year ARI wind speeds for the dominant
wind directions as well as the USBR
recommended over water wind speed of 30 m/s.
The results of the analyses for the Saddle Dam
with the USBR and 100yr North Westerly wind
and an 8H on 1V slope are shown in Table 2.
Similar results were obtained for the Subsidiary
Dam which indicated that for the 8H on 1V
slope, the minimum slope protection level for
the rip rap or reno-mattress options should be
RL 14.5m.
Description Unit 100yr USBR
Wind vel. over land m/s 26.2 23.81
Wind vel. over water m/s 33.0 30.00
Minimum duration hour 0.62 0.65
Significant wave ht. m 1.74 1.55
Wave run-up m 0.66 0.59
Wind set up m 0.14 0.12
Total Wet Freeboard m 0.80 0.71
Minimum Rip Rap
Level for 10,000 yr
Flood RL13.73m
m 14.53 14.44
Table 2 - Wave Data for Saddle Dam using
NW Wind and Upstream Slope 8H:1V
The analysis with the 2H on 1V slope indicated
that the wave set up and run up would be
significantly higher than the flatter slopes and
further analysis was performed to develop a
reservoir level frequency curve for combined
wind and flood events for the 2H on 1V and 8H
on 1V embankment slopes using the following
wind speeds derived from the statistical
analysis of the wind data.
Wind ARI (years)
1 10 100 1000 10,000
Speed
(m/s)
9.0 17.5 26.0 30.5 40.0
The 1000 and 10,000 year wind speeds were
derived from extrapolation of the available data
and were only used for this frequency analysis.
Figure 3 shows the frequency versus reservoir
level curve for the 2H on 1 V slope.
The reservoir level frequency data indicated
that the minimum levels for the slope protection
should be 14.3m for the reno-mattress and rip
rap options and 15.2m for the berm and gabion
option. However, as the analyses could not
account for the combined berm and beach effect
up-slope of the berm, it was assessed that a
minimum slope protection level of RL 14.9m
would be required for the berm and gabion
options.
• Slope Protection Design
The approach recommended by US Corps of
Engineers Shore Protection Manual (1984) was
used for the design of the rip rap.
Assuming a Rayleigh distribution for the waves,
the design wave height was taken to be 1.27
times the significant wave height Hs. The
significant wave height was calculated using a
wind velocity over water of 30 m/s for the
Subsidiary Dam and 33.0 m/s for the Saddle
Dam as these were the highest wind speeds
found from the wind analyses.
The weight of the graded rock in the riprap was
calculated using the formula:
W
H
K
r
D
r
W
50
3
3
1
=
−






γ
γ
γ
θ
*
* * cot( )
Where:
W50 = weight of the 50% percent size in the
riprap (kN)
γr = unit weight of the riprap rock (kN/m3
)
γw = unit weight of the water (kN/m3
)
H = design wave height (m)
θ = Angle of the dam face from the
horizontal (°)
KD = stability coefficient (2.5 for angular
quarried rock and non breaking waves)
The maximum weight of graded riprap (W100)
was taken to be 4W50 and the minimum
0.125W50. These are equivalent to the
maximum size of 1.5 times the D50, and
minimum size 0.5 times D50. The equivalent
sieve size of the riprap is approximately
1.15(W/γr)0.33
.
The rip rap requirements were determined for
the existing upstream slope of the subsidiary
dam and saddle dam which varies from 6H:1V
to 10H:1V. As one of the alternatives for the
slope protection is a berm placed as a
continuation of the existing rip rap slope, the rip
rap requirements were also determined for the
Figure 3 - Slope Protection Exceedence Curve for Embankment Slope 2H on 1V
1.E-08
1.E-07
1.E-06
1.E-05
1.E-04
1.E-03
1.E-02
1.E-01
1.E+00
12.5 13.0 13.5 14.0 14.5 15.0 15.5 16.0 16.5
Maximum Water Level (m)
ExceedenceProbability
0
500,000
1,000,000
1,500,000
2,000,000
2,500,000
3,000,000
3,500,000
4,000,000
Cost(AUD)
Flood Level Rip Rap Option Reno Mattress Option
Berm Option Saddle Berm Option Alternative Gabion Option
Independent wind and wave
Assumed design curve with
transition from independent to
dependent
Dependent wind and
wave
Figure 3 - Frequency Reservoir Level Curve for
a 2:1 Slope
Saddle Dam using a slope of 2H on 1V. The rip
rap sizes for the 2H:1V and 8H:1V slopes are
presented in Table 3.
The design of the bedding layer below the rip-
rap was carried out with reference to US Corps
of Engineers (1995) and Fell et al (1992).
In the case of the reno-mattress design, a runup
correction factor was applied to the values
calculated for the rip rap using the following
roughness reduction factors:
Rreno-mattress = 0.77
Rriprap = 0.61
The ratio of these roughness factors of 1.26
was applied to the wave run up and set up to
calculate the thickness of a Maccaferri Reno-
Mattress. A geotextile fabric below the reno-
mattress was selected to prevent erosion of the
underlying material through the reno-mattress.
The analyses indicated that a reno-mattress
thickness of 170mm was required.
Description Unit 2:1 8:1
Unit Weight of Riprap kN/m3
25.0 25.0
Wind vel. over water m/s 33.0 33.0
Significant wave ht m 1.74 1.74
Design wave ht m 2.21 2.21
Max wt of riprap kN 64.2 16.0
50% Wt of riprap kN 16.0 4.0
Min. weight of riprap kN 2.01 0.5
Max. size of riprap m 1.57 0.99
50% size of riprap m 0.99 0.63
Min. size of riprap m 0.50 0.32
Table 3 - Saddle dam Riprap Design
• Cost Estimation and Option Selection
The quantities and costs for each slope
protection option were estimated using the
calculated rip rap layer thicknesses and berm
dimensions for each slope protection option as
shown on Figure 3 and Table 4 for the levels of
protection at RL 14.3 and 14.9m.
The rip rap option and the reno-mattress option
were significantly more costly than the berm
and gabion options. While the gabion option
was the lowest cost alternative for all levels of
slope protection, the wave run-up
characteristics and erosion potential differ from
the flatter slopes applicable to the other options.
There was also some concern over the long term
durability of the gabions.
The reno-mattress, berm and gabion options
were used for the risk analysis to determine the
required protection level and preferred option
for each section of the embankments.
6 Risk Analysis
Due to the sand construction of the
embankments, it was possible to apply a wave
erosion model SBEACH to determine the
likelihood of embankment failure or damage
resulting from beaching of the sand in
unprotected or partly protected areas and to
produce a risk model to evaluate the least cost
option for the slope protection.
Risk Analysis Methodology
1. The wind and rain data were evaluated to
determine the likely wind pattern for the 1,
10 and 100 year events and the coincidence
of the peak winds and rainfall events;
2. The SBEACH model was checked for
sensitivity to the input parameters and
calibrated using historical erosion of the
embankments;
3. The erosion potential of the waves on each
embankment section was determined for a
selected number of combined wind and flood
events to evaluate the likelihood of
embankment breach and damage and
estimate the cost of erosion repair works;
4. A risk model was developed to derive the
failure and damage likelihoods for each flood
and wind event likely to occur using the
reno-mattress, berm and gabion options
constructed to various levels;
5. Annual risk costs for failure and erosion
damage of the saddle dam and subsidiary
Option Cost ($M)
RL 14.3m RL 14.9m
Rip Rap 5.16 >5.42
Berm 1.70 2.41
Berm 1.17 1.51
Reno Mattress 2.89 >3.04
Gabion 0.74 1.18
Table 4 - Slope Protection Option Costs
dam sections were determined and the
present value of the annual risk cost
calculated and compared with the capital
cost of slope protection works required to
prevent erosion or damage of the
embankments;
6. The present value for the maintenance, if
carried out on a five yearly basis, was
calculated and the equivalent annual
maintenance cost determined for each option
to assess the effect of the reduced costs on
the decision regarding the least cost option;
7. The results were used to determine rip rap
level required to minimise the risk cost of
failure and repair/maintenance for each
embankment section considering annual and
five yearly maintenance programmes.
⇒ Wind Data Analysis
The half hourly wind data available from the
Bureau of Meteorology, was plotted together
with the three hourly data to review the wind
patterns which indicated the following:
• the wind direction for the more extreme
events is generally within a 30° arc;
• Wind direction for the more frequent events
(1 year ARI) can be in any direction.
• The maximum wind speeds generally
occurred with the wind direction from the
west (270°) to the north west (315°);
• The peak wind is not sustained for more that
3 hours for the higher wind speed events
(30m/s)
• for the wind speeds in the order of 20m/s,
the wind can oscillate about this peak for an
extended period, as observed in 1956 where
the speed varied between 18m/s to 23m/s for
about 48 hours.
It was clear from the data that two distinct wind
patterns could be generated, as shown on
Figures 4 and 5 which were assessed to be likely
10 and 100 year ARI events respectively.
From discussions with the Bureau of
Meteorology, it was established that during
major rainfall events, the wind direction is
generally from the south east while the
maximum wind speeds can occur during or after
the peak rainfall event.
It was conservatively assumed that the wind
direction would be normal to the embankments.
The wind peak was assumed to occur six hours
12.80
13.00
13.20
13.40
13.60
13.80
14.00
0 20 40 60 80 100 120 140 160
Time (hrs)
ReservoirLevel(m)
12h
24h
36h
48h
72h
Figure 6 - Flood Hydrographs for 1:200,000 AEP
Flood with various Storm Durations
0.0
5.0
10.0
15.0
20.0
25.0
30.0
35.0
0 24 48 72 96 120 144 168 192
Time (hrs)
WindSpeed(m/s)
1953
1956
1980
1986
1997
1998
Composite
Figure 4 - Composite Maximum Wind Event
1 in 10 yr ARI
0.0
5.0
10.0
15.0
20.0
25.0
30.0
35.0
0 24 48 72 96 120 144
Time (hrs)
WindSpeed(m/s)
1954
1952
1955
1951
1980
1997
Composite
Figure 5 - Composite Maximum Wind Event
1 in 100 yr ARI
after the flood peak. A sensitivity analysis on
the coincidence of wind and flood peaks
indicated that the selected offset of the peaks
was likely to be the worst case scenario,
however, longer duration peaks could result in
about an additional 10% erosion.
The longer duration storm events have extended
periods of relatively high reservoir levels as
shown on Figure 6 for the 200,000 year flood
event hydrographs.
Flood Event Storm Duration (hrs)
Peak RL Max. Erosion
PMF 12 or 24 72 or 24
1:200,000 36 72
1:2,000 36 72
1:10 48 72
Table 5 - Critical Storm Durations for Flood
Level and Erosion Model
The storm durations shown in Table 5 were
relevant to the reservoir level and erosion
potential of the embankment slope for which
the maximum erosion storm duration
hydrographs were used for the risk analysis.
⇒ Erosion Model
The wave erosion was evaluated using the US
Army Corps of Engineers Waterways
Experiment Station program Storm Induced
Beach Change (SBEACH 32 Version 2.0).
SBEACH is an empirically based numerical
model for simulating two dimensional cross
shore beach change. The model was initially
formulated using data from prototype scale
laboratory experiments and further developed
and verified on field measurements and
sensitivity testing.
In calculating the beach profile change, the
model assumes that the cross-shore sediment
transport is produced by breaking waves and
changes in water level. Wave transformation
and sediment transport rates are calculated
using random wave properties. The random
wave generation assumes that the wave height
follows a Raleigh distribution with adjustments
made for use of the significant wave height and
wave decay over either a monotonic or non-
monotonic profile. In the case of the non-
monotonic profile, a predictive equation is
included in the model to determine the number
of waves that reform along the negatively
sloping sections of the slope i.e. upslope of the
berm options used for Grahamstown Dam.
The random wave model uses the conservation
of wave energy to solve wave energy flux
equations and compute the wave height decay
across the surf zone where the waves are
breaking on the embankment slope. Wave and
wind induced water level setup are included in
the calculation by solving a cross-shore
momentum equation. Computations of random
wave parameters are performed across the
profile at each time step based on input wave
and water level information and the wave
parameters are used to calculate the sediment
transport rates.
The input for the model included the flood
hydrograph, wind speed and direction,,
significant wave height and period, embankment
section and embankment material properties
including:
− Effective grain size diameter;
− Avalanching angle which defines the steepest
profile that can develop before avalanching
of the beaching material occurs and was
assumed to be 45° for the well compacted
material which had evidence of near vertical
erosion faces.
− A transport rate coefficient (K) which
influences the rate at which transport occurs
when the energy dissipation per unit volume
is greater than the equilibrium energy
dissipation per unit volume.
− Slope Dependent Transport term (ε) which
influences the slope of the eroded profile.
Higher values of this parameter result in
profiles with gentler slopes and flatter bars
Figure 7 - Description of Shore Profile
while lower values result in steeper near
shore profiles and steeper bars.
− Depth of Foreshore Parameter DFS which
defines the landward end of the surf zone in
the model and affects the magnitude of
transport in the swash zone. A higher value,
corresponding to a greater depth at the
boundary between the surf and swash zones,
typically increases the transport rates in the
swash zone producing more erosion at the
foreshore.
⇒ Erosion Model Sensitivity and
Calibration
Sensitivity analyses and model calibration were
carried out on a section of the Subsidiary Dam
using the annual wind with the reservoir at the
FSL and a sand size of 0.35mm.
The following parameters were used:
• Grid spacing 5m, 3m, 2m, 1m.
The model was found to be particularly
sensitive to the grid spacing for which a 1m
spacing was required to correctly model the
gabion and berm options. Larger grid
spacing underestimated the erosion
potential.
• Particle Size
Sensitivity analysis was performed with
particle sizes from 0.25mm to 0.35mm. The
particle size of 0.25mm is consistent with
wind blown material in the area while the
0.35mm was the average of the main
embankment particle size.
• Transport Rate Coefficient
The transport rate coefficient (K) was varied
and finally selected to provide a reasonable
depth of erosion.
• Slope Dependent Transport term (ε)
The slope dependent transport term had a
significant impact on the erosion potential
and was reduced from the default value of
0.002m2
/s to 0.001m2
/s to improve the
erosion prediction.
• Depth of Foreshore Parameter DFS
The erosion was found to be relatively
insensitive to this parameter which was kept
at the default value of 0.3m
Erosion Analysis
The wave erosion model was run for each of the
representative embankment sections using the
PMF; 200,000 year; 2,000 year; and 10 year
ARI flood events and the FSL using the 100, 10
and 1 year ARI wind events. In the case of the
FSL condition, the erosion was analysed using a
10,000year ARI wind event for each
embankment to determine the likelihood of
failure under this extreme event.
A typical input hydrograph and wind speed data
for the 200yr flood and the 10yr wind is shown
on Figure 8.
6
7
8
9
10
11
12
13
14
15
16
20 30 40 50 60 70 80 90 100 110
Chainage (m)
Level(m)
Original Profile
10,000 yr Wind (Sand 0.3mm)
100 yr Wind (Sand 0.25mm)
100 yr Wind (Sand 0.3mm)
100 yr Wind (Sand 0.35mm)
10 yr Wind (Sand 0.25mm)
10 yr Wind (Sand 0.3mm)
10 yr Wind (Sand 0.35mm)
1 yr Wind (Sand 0.25mm)
1 yr Wind (Sand 0.3mm)
1 yr Wind (Sand 0.35mm)
Figure 9 - Saddle Dam Erosion Plots for
FSL & Existing Slope Protection
6
7
8
9
10
11
12
13
14
15
16
20 30 40 50 60 70 80 90 100 110
Chainage (m)
Level(m)
Original Profile
100 yr Wind (Sand 0.25mm)
100 yr Wind (Sand 0.3mm)
100 yr Wind (Sand 0.35mm)
10 yr Wind (Sand 0.25mm)
10 yr Wind (Sand 0.3mm)
10 yr Wind (Sand 0.35mm)
1 yr Wind (Sand 0.25mm)
1 yr Wind (Sand 0.3mm)
1 yr Wind (Sand 0.35mm)
Figure 10 - Subsidiary Dam Section 1
Erosion Plot for FSL & Existing Slope
Protection
12.8
13.0
13.2
13.4
13.6
13.8
14.0
0 12 24 36 48 60 72 84 96 108 120 132 144 156 168 180 192 204 216
Time (hrs)
RL(m)
0
4
8
12
16
20
24
WindVelocity(m/s)
Flood Level
Wind Velocity over
Water
Figure 8 - 2000 yr Flood and 10 yr Wind
The models were run using the existing
embankment configuration and at least two
levels of slope protection for each option in
order to provide data for the risk analysis and
cost optimisation.
⇒ Erosion Analysis Results
Typical erosion plots are shown on Figures 9,
10 and 11 for the Full Supply Level conditions
and the annual wind for the existing Saddle
Dam and Section 1 of the Subsidiary Dam with
and without the proposed slope protection in
this embankment section.
The models showed that the beach erosion
forms relatively rapidly and then maintains a
stable profile. The erosion of the embankment
does not extend through the core zone below the
FSL of RL12.8m, however, considerable
damage occurs for a number of flood events.
The erosion for the full supply level condition
indicated that the erosion will progress about
5m to 10m into the face of the embankments to
a depth of up to 1m.
The volume of material eroded was calculated
for each embankment using the level difference
at each 1m grid point between the original
profile and the eroded profile. A damage factor
was used to account for the non uniformity of
the erosion along the full length of each section
and the cost for the repairs calculated using a
rate for replacement of eroded sand.
Repair cost versus frequency curves were
developed for each embankment section and
level of slope protection for all of the options.
A typical plot is shown on Figure 12 for Section
1 of the Subsidiary Dam with the Berm
protection option to RL 13.0m.
⇒ Risk Model
The following assumptions and limitations
applied to the risk analysis.
◊ The likelihood of coincident winds occurring
with floods increases with flood magnitude
to the point where at the PMF, the 100 year
wind may be coincident with the peak flow (
Met. Bureau).
◊ The peak flood levels for the PMF event
occur during the 12hr or 24hr storm event.
The PMF event was also evaluated using a
72 hour storm duration.
◊ Peak winds occur at about 6hrs after the
peak flood level. Sensitivity analysis to the
occurrence of the wind was carried out.
◊ The annual wind speed occurrs continuously
for 30% of the year.
◊ Only the critical storm durations for each
flood have been used.
◊ The risk assessment applies only to the flood
and wind events.
6
7
8
9
10
11
12
13
14
15
16
20 30 40 50 60 70 80 90 100 110
Chainage (m)
Level(m)
Original Profile
100yr Wind
10yr Wind
1yr Wind
Figure 11 - Subsidiary Dam Section 1
Erosion Plot for FSL & Berm Slope
Protection
Subsidiary Dam Section 1 - Repair Costs versus Flood Frequency
Berm Slope Protection at RL 13.0m
0
2,000
4,000
6,000
8,000
10,000
12,000
14,000
16,000
1.E-06 1.E-05 1.E-04 1.E-03 1.E-02 1.E-01 1.E+00
Flood Frequency
RepairCosts($)
100yr Wind
10yr Wind
1yr Wind
Figure 12 - Typical Plot of Repair Cost versus
Frequency
Slope Protection
PMF to 100,000
100,000 to 10,000
10,000 to 1,000
1,000 to 100
100 to 10
10 to 1
100yr Wind
10 yr Wind
1 yr Wind
Damage
No Damage
Failure
No Failure
Figure 13 - Part Event Tree
The risk model combined the likelihood of the
flood and wind events with the potential
damage and failure probabilities assessed using
the wave erosion results. A typical model, as
shown in Figure 13 for the Saddle Dam existing
slope protection, included the following event
sequences occurring during a flood event.
Ø Flood and Wind
The flood and wind combinations are
shown on Table 6.
Ø Erosion Damage
Ø Embankment Failure
Ø Embankment OK
The model was run for each embankment
section with the slope protection levels
appropriate to each option.
Flood Event Interval
(years)
Wind ARI
(years)
1 to 10 1, 10, 100
10 to 100 1, 10, 100
100 to 1000 1, 10, 100
1,000 to 10,000 10, 100
10,000 to 100,000 100
100,000 to PMF 100
Table 6 - Flood and Wind Event
Combinations for Risk Analysis
The total annual risk cost of damage or failure
and the present value of each was calculated
using a discount rate of 8% and lifetime of
100years. The present value maintenance risk
cost was also determined using a 5 yearly
interval for the annual risk cost and the
equivalent annual series costs determined for
this maintenance cost.
⇒ Risk Analysis Results and Evaluation
The risk analysis provided failure and damage
risk costs and total risk cost for each flood and
wind event range for present conditions. The
results for each flood range are shown in Tables
7 for Section 1 of the Subsidiary Dam.
The capital cost, annual and present value
failure and maintenance costs for each slope
protection option were obtained for the
embankment sections. The results for the
Section 1 of the Subsidiary Dam are shown on
Table 8 and the data for the berm option of this
embankment section is shown on Figure 14.
The results for this embankment are typical of
the other embankments and showed the
following:
• The majority of the damage risk cost with
the existing conditions occurs with the more
frequent annual flood events.
• The majority of the damage risk costs for
the wind events occurs as a result of the
annual wind event. This is due to the
extended duration of the wind events and
the high percentage damage expected from
the annual wind;
• Increasing the slope protection level results
in increased present value costs for
Flood Event Range Failure Risk Cost Damage Risk Cost Total Risk Cost
(years) Risk Cost
($)
Percent of
Total
Risk Cost
($)
Percent of
Total
Risk Cost
($)
Percent of
Total
10 to 1 228 1.6% 12,370 88.5% 12,598 90.1%
100 to 10 228 1.6% 200 1.4% 428 3.1%
1,000 to 100 789 5.6% 24 0.2% 813 5.8%
10,000 to 1,000 79 0.6% 12 0.1% 91 0.6%
100,000 to 10,000 39 0.3% 2 0.0% 41 0.3%
PMF to 100,000 8 0.1% 0 0.0% 8 0.1%
Totals $ 1,371 9.8% $ 12,608 90.2% 13,979 100%
$ 13,979
Table 7 - Summary of Risk Costs for Subsidiary Dam Section 1 with Existing Conditions
0
20,000
40,000
60,000
80,000
100,000
120,000
140,000
160,000
180,000
11.5 12 12.5 13 13.5 14
Slope Protection Level (m)
RiskCost($)
0
20,000
40,000
60,000
80,000
100,000
120,000
140,000
160,000
180,000
Capital+PVMaintenaceRiskCost($)
Failure and Maintenance Total PV Risk Cost
Maintenance Annual Risk Cost
Maintenance PV Risk Cost
Capital + PV Maintenance
Initial Capital Cost
Figure 14 - Risk Analysis Berm Option
maintenance and initial capital cost.
• As the beach erosion model indicated that
the beaching is likely to be stable and not
progress to failure, it was considered
appropriate to extend the maintenance
period to a 5 yearly interval which
significantly reduced the total maintenance
risk cost taken over a 50 year lifetime. As
shown on Table 8, the capital and present
value of the risk cost for the Subsidiary
Dam Section 1 was reduced from $154,241
to $26,291.
• Of all of the embankment areas analysed,
only Section 1 of the Subsidiary Dam could
be shown to have similar capital costs for
the slope protection option compared with
ongoing maintenance of the do-nothing
option. The results for the remainder of the
embankments indicated that the present
value of the reduced maintenance cost and
capital cost was significantly higher than
the maintenance costs for the do-nothing
option.
Based on the results of the risk analysis, the
following recommendations were made for the
Slope Protection works for the Grahamstown
Saddle Dam and Subsidiary Dam:
− provide additional slope protection for the
Section 1 of the Subsidiary Dam from the
present level of RL 11.5m to RL 13.0m
during the present Stage 2 augmentation
works. The slope protection will be required
over a length of about 100m of the
embankment at a cost of about $35,000;
− apart from Section 1 of the Subsidiary Dam,
provide no additional slope protection for the
Saddle Dam or the Subsidiary Dam during
the present Stage 2 augmentation works;
− perform maintenance and remedial works at
five yearly intervals;
− monitor the embankments for signs of
excessive erosion beyond that predicted by
the erosion model. If this occurs, slope
protection should be constructed using either
the berm or gabion options to a level
considered appropriate to the observed
damage and as necessary to minimise the
total risk cost;
− Plant water resistant grass between
RL 10.4m and RL 12.8m along Section 2 of
the Subsidiary Dam and between RL 11.5m
Protection
Level
Initial
Capital
Failure and
Maintenance Cost
Maintenance Cost
($)
Capital +
PV Maint.
(m) Cost
($)
Annual
Risk Cost
($)
PV Risk
Cost
($)
Annual
Risk
Cost
PV
Risk
Cost
PV Risk
Cost - 5yr
Interval
Annual
Maint. for
5yr Risk
Cost
($)
Reno Mattress
11.5 0 13,979 171,011 12,608 154,241 26,291 2,149 154,241
13 49,018 2,274 27,813 903 11,043 1,882 154 60,060
13.6 65,874 643 7,870 115 1,405 240 20 67,280
Berm
11.5 0 13,979 171,011 12,608 154,241 26,291 2,149 154,241
13 32,523 1,666 20,384 295 3,613 616 50 36,137
13.6 53,824 585 7,152 56 687 117 10 54,510
Gabion
(Risk Model Assumed to be the same as the Berm Option)
11.5 0 13,979 171,011 12,608 154,241 26,291 2,149 154,241
13 42,000 1,666 20,384 295 3,613 616 50 45,613
13.6 66,000 585 7,152 56 687 117 10 66,687
Table 8 - Risk Analysis Results Subsidiary Dam Section 1
to 12.8m along Section 1 of the Subsidiary
Dam;
− Where required, grass of the runner type
should be planted above the existing rip rap
or the water resistant grass up to the
embankment crest level to bind the sand
together and provide some resistance to
wind and wave erosion.
7 Summary and Conclusions
An economic risk model was developed for the
Grahamstown Dam Saddle and Subsidiary
embankment sections with various types and
levels of slope protection. The costs for slope
protection options were developed using slope
protection levels based on a standards approach
for slope protection. A risk management
approach was then used to develop damage risk
costs for each slope protection level and a
present value analysis performed to provide
cost curves of total cost versus slope protection
level. The cost curves were finally used to
determine the required slope protection measure
and the level to which the protection was
required for each of the representative
embankment sections.
The risk management approach clearly showed
that a significant cost savings in the order of
$1M could be achieved by using the risk
management approach rather than the standards
approach. Furthermore, the cost curves clearly
showed the sections of the embankments for
which present capital works would not be
economically justified and for which ongoing
maintenance works would be economically
advantageous.
References
CEC (1993), “Augmentation of Lake
Grahamstown Report on Final Spillway
Layout”, Civil Engineering Consulting,
February 1993
SBEACH (1996), “SBEACH Numerical Model
for Simulating Storm Induced Beach Change
Report 4”, US Army Corps of Engineers,
Waterways Experiment Station, Technical
Report CERC-89-9, April 1996
Decision Tools (1996), “Decision Tools Suite -
@Risk, Precision Tree, Top Rank, Best Fit and
Risk View” Palisade Corporation, Windows
Version 1996
ANCOLD (2000) “Guidelines on Selection of
Acceptable Flood Capacity for Dams”, March
2000

Weitere ähnliche Inhalte

Was ist angesagt?

Collection and Conveyance of Water
Collection and Conveyance of WaterCollection and Conveyance of Water
Collection and Conveyance of WaterGAURAV. H .TANDON
 
Water supply appurtenances
Water supply appurtenancesWater supply appurtenances
Water supply appurtenancesAjay B.K
 
Queuing (Transportation Engineering)
Queuing (Transportation Engineering)Queuing (Transportation Engineering)
Queuing (Transportation Engineering)Hossam Shafiq I
 
Highway Horizontal Alignment
Highway Horizontal AlignmentHighway Horizontal Alignment
Highway Horizontal AlignmentAkshathaBhandary
 
Station and Yards in Indian Railway
Station and Yards in Indian RailwayStation and Yards in Indian Railway
Station and Yards in Indian RailwayArbaz Kazi
 
Transportation planning
Transportation planningTransportation planning
Transportation planningPiter Biswas
 
Air port presentation 6th unit
Air port presentation 6th unitAir port presentation 6th unit
Air port presentation 6th unitT.Naga Anusha
 
Intersections & Interchanges ( Highway Engineering Dr. Sherif El-Badawy )
Intersections & Interchanges ( Highway Engineering Dr. Sherif El-Badawy )Intersections & Interchanges ( Highway Engineering Dr. Sherif El-Badawy )
Intersections & Interchanges ( Highway Engineering Dr. Sherif El-Badawy )Hossam Shafiq I
 
Chapter 6 design of irrigation channel1
Chapter 6 design of irrigation channel1Chapter 6 design of irrigation channel1
Chapter 6 design of irrigation channel1Mulugeta Abera
 
Traffic Flow Fundamentals
Traffic Flow FundamentalsTraffic Flow Fundamentals
Traffic Flow FundamentalsShaira Lucero
 
Airport Planning & Terminal Building Design
Airport Planning & Terminal Building DesignAirport Planning & Terminal Building Design
Airport Planning & Terminal Building DesignSiniša Prvanov
 

Was ist angesagt? (20)

Sydney harbour bridge
Sydney harbour bridgeSydney harbour bridge
Sydney harbour bridge
 
Traffic control devices
Traffic control devicesTraffic control devices
Traffic control devices
 
Collection and Conveyance of Water
Collection and Conveyance of WaterCollection and Conveyance of Water
Collection and Conveyance of Water
 
Water supply appurtenances
Water supply appurtenancesWater supply appurtenances
Water supply appurtenances
 
Airport lighting
Airport lightingAirport lighting
Airport lighting
 
Queuing (Transportation Engineering)
Queuing (Transportation Engineering)Queuing (Transportation Engineering)
Queuing (Transportation Engineering)
 
Highway Horizontal Alignment
Highway Horizontal AlignmentHighway Horizontal Alignment
Highway Horizontal Alignment
 
Station and Yards in Indian Railway
Station and Yards in Indian RailwayStation and Yards in Indian Railway
Station and Yards in Indian Railway
 
MAX FAJARDO ESTIMATE.pdf
MAX FAJARDO ESTIMATE.pdfMAX FAJARDO ESTIMATE.pdf
MAX FAJARDO ESTIMATE.pdf
 
Transportation planning
Transportation planningTransportation planning
Transportation planning
 
Airport drainage
Airport drainageAirport drainage
Airport drainage
 
Air port presentation 6th unit
Air port presentation 6th unitAir port presentation 6th unit
Air port presentation 6th unit
 
Intersections & Interchanges ( Highway Engineering Dr. Sherif El-Badawy )
Intersections & Interchanges ( Highway Engineering Dr. Sherif El-Badawy )Intersections & Interchanges ( Highway Engineering Dr. Sherif El-Badawy )
Intersections & Interchanges ( Highway Engineering Dr. Sherif El-Badawy )
 
Chapter 6 design of irrigation channel1
Chapter 6 design of irrigation channel1Chapter 6 design of irrigation channel1
Chapter 6 design of irrigation channel1
 
Traffic Flow Fundamentals
Traffic Flow FundamentalsTraffic Flow Fundamentals
Traffic Flow Fundamentals
 
Road network
Road networkRoad network
Road network
 
Components of railway track
Components of railway trackComponents of railway track
Components of railway track
 
Airport engineering
Airport engineering Airport engineering
Airport engineering
 
Airport Planning & Terminal Building Design
Airport Planning & Terminal Building DesignAirport Planning & Terminal Building Design
Airport Planning & Terminal Building Design
 
Signals on Railway
Signals on RailwaySignals on Railway
Signals on Railway
 

Ähnlich wie Risk and standards based riprap design for grahamstown dam barker & holroyde

Adequacy Check of Existing Crest Level of Sea Facing Coastal Polders by the E...
Adequacy Check of Existing Crest Level of Sea Facing Coastal Polders by the E...Adequacy Check of Existing Crest Level of Sea Facing Coastal Polders by the E...
Adequacy Check of Existing Crest Level of Sea Facing Coastal Polders by the E...IOSR Journals
 
Use of MIKE 21/3 in the Hydraulic Analysis for the Dublin Port ABR Project - ...
Use of MIKE 21/3 in the Hydraulic Analysis for the Dublin Port ABR Project - ...Use of MIKE 21/3 in the Hydraulic Analysis for the Dublin Port ABR Project - ...
Use of MIKE 21/3 in the Hydraulic Analysis for the Dublin Port ABR Project - ...Stephen Flood
 
Report work on retaining wall
Report work on retaining wallReport work on retaining wall
Report work on retaining wallvikas Meena
 
Effects of time-series data resolution on modelling shoreline change. Avidesh...
Effects of time-series data resolution on modelling shoreline change. Avidesh...Effects of time-series data resolution on modelling shoreline change. Avidesh...
Effects of time-series data resolution on modelling shoreline change. Avidesh...Stephen Flood
 
Flood Control Challenges for Large Hydroelectric Reservoirs
Flood Control Challenges for Large Hydroelectric ReservoirsFlood Control Challenges for Large Hydroelectric Reservoirs
Flood Control Challenges for Large Hydroelectric ReservoirsCPWF Mekong
 
AIP-Procceding-Article
AIP-Procceding-ArticleAIP-Procceding-Article
AIP-Procceding-ArticleMehdi Karimi
 
Flood alleviationbrief170214
Flood alleviationbrief170214Flood alleviationbrief170214
Flood alleviationbrief170214Naoise
 
Coastal engineering introduction
Coastal engineering introductionCoastal engineering introduction
Coastal engineering introductionJorge C. Palma
 
Download-manuals-surface water-software-estimationofdischargebyarea-slopemethod
 Download-manuals-surface water-software-estimationofdischargebyarea-slopemethod Download-manuals-surface water-software-estimationofdischargebyarea-slopemethod
Download-manuals-surface water-software-estimationofdischargebyarea-slopemethodhydrologyproject0
 
NABARD TRAINING PROGRAM_for NABARDDDMS.pdf
NABARD TRAINING PROGRAM_for NABARDDDMS.pdfNABARD TRAINING PROGRAM_for NABARDDDMS.pdf
NABARD TRAINING PROGRAM_for NABARDDDMS.pdfssuserb170111
 
DCC Dollymount Flood Defence Report
DCC Dollymount Flood Defence ReportDCC Dollymount Flood Defence Report
DCC Dollymount Flood Defence ReportNaoise
 
Evaluation Of Low Impact Developments (LID)
Evaluation Of Low Impact Developments (LID)Evaluation Of Low Impact Developments (LID)
Evaluation Of Low Impact Developments (LID)Dawit A. Melaku
 
offshore structural design detailed engineering fixed plate form
offshore structural design detailed engineering fixed plate formoffshore structural design detailed engineering fixed plate form
offshore structural design detailed engineering fixed plate formkhalidsiddig8
 
RMT Group5 presentation.pptx
RMT Group5 presentation.pptxRMT Group5 presentation.pptx
RMT Group5 presentation.pptxSubratDash37
 
ACOE Coastal Storm Management Alternative for Jamaica Bay Communities
ACOE Coastal Storm Management Alternative for Jamaica Bay CommunitiesACOE Coastal Storm Management Alternative for Jamaica Bay Communities
ACOE Coastal Storm Management Alternative for Jamaica Bay Communitiesecowatchers
 

Ähnlich wie Risk and standards based riprap design for grahamstown dam barker & holroyde (20)

Adequacy Check of Existing Crest Level of Sea Facing Coastal Polders by the E...
Adequacy Check of Existing Crest Level of Sea Facing Coastal Polders by the E...Adequacy Check of Existing Crest Level of Sea Facing Coastal Polders by the E...
Adequacy Check of Existing Crest Level of Sea Facing Coastal Polders by the E...
 
Use of MIKE 21/3 in the Hydraulic Analysis for the Dublin Port ABR Project - ...
Use of MIKE 21/3 in the Hydraulic Analysis for the Dublin Port ABR Project - ...Use of MIKE 21/3 in the Hydraulic Analysis for the Dublin Port ABR Project - ...
Use of MIKE 21/3 in the Hydraulic Analysis for the Dublin Port ABR Project - ...
 
Report work on retaining wall
Report work on retaining wallReport work on retaining wall
Report work on retaining wall
 
Nam Ngiep Hydropower Dam -- Climate Risk Assessment
Nam Ngiep Hydropower Dam -- Climate Risk Assessment Nam Ngiep Hydropower Dam -- Climate Risk Assessment
Nam Ngiep Hydropower Dam -- Climate Risk Assessment
 
Effects of time-series data resolution on modelling shoreline change. Avidesh...
Effects of time-series data resolution on modelling shoreline change. Avidesh...Effects of time-series data resolution on modelling shoreline change. Avidesh...
Effects of time-series data resolution on modelling shoreline change. Avidesh...
 
Flood Control Challenges for Large Hydroelectric Reservoirs
Flood Control Challenges for Large Hydroelectric ReservoirsFlood Control Challenges for Large Hydroelectric Reservoirs
Flood Control Challenges for Large Hydroelectric Reservoirs
 
AIP-Procceding-Article
AIP-Procceding-ArticleAIP-Procceding-Article
AIP-Procceding-Article
 
Flood alleviationbrief170214
Flood alleviationbrief170214Flood alleviationbrief170214
Flood alleviationbrief170214
 
Coastal engineering introduction
Coastal engineering introductionCoastal engineering introduction
Coastal engineering introduction
 
Download-manuals-surface water-software-estimationofdischargebyarea-slopemethod
 Download-manuals-surface water-software-estimationofdischargebyarea-slopemethod Download-manuals-surface water-software-estimationofdischargebyarea-slopemethod
Download-manuals-surface water-software-estimationofdischargebyarea-slopemethod
 
Floods
FloodsFloods
Floods
 
NABARD TRAINING PROGRAM_for NABARDDDMS.pdf
NABARD TRAINING PROGRAM_for NABARDDDMS.pdfNABARD TRAINING PROGRAM_for NABARDDDMS.pdf
NABARD TRAINING PROGRAM_for NABARDDDMS.pdf
 
DCC Dollymount Flood Defence Report
DCC Dollymount Flood Defence ReportDCC Dollymount Flood Defence Report
DCC Dollymount Flood Defence Report
 
Evaluation Of Low Impact Developments (LID)
Evaluation Of Low Impact Developments (LID)Evaluation Of Low Impact Developments (LID)
Evaluation Of Low Impact Developments (LID)
 
CH-2.pptx
CH-2.pptxCH-2.pptx
CH-2.pptx
 
DAM ENGINEERING I.pptx
DAM ENGINEERING I.pptxDAM ENGINEERING I.pptx
DAM ENGINEERING I.pptx
 
offshore structural design detailed engineering fixed plate form
offshore structural design detailed engineering fixed plate formoffshore structural design detailed engineering fixed plate form
offshore structural design detailed engineering fixed plate form
 
RMT Group5 presentation.pptx
RMT Group5 presentation.pptxRMT Group5 presentation.pptx
RMT Group5 presentation.pptx
 
Exploration Process Data
Exploration Process DataExploration Process Data
Exploration Process Data
 
ACOE Coastal Storm Management Alternative for Jamaica Bay Communities
ACOE Coastal Storm Management Alternative for Jamaica Bay CommunitiesACOE Coastal Storm Management Alternative for Jamaica Bay Communities
ACOE Coastal Storm Management Alternative for Jamaica Bay Communities
 

Kürzlich hochgeladen

PORTFOLIO DE ARQUITECTURA CRISTOBAL HERAUD 2024
PORTFOLIO DE ARQUITECTURA CRISTOBAL HERAUD 2024PORTFOLIO DE ARQUITECTURA CRISTOBAL HERAUD 2024
PORTFOLIO DE ARQUITECTURA CRISTOBAL HERAUD 2024CristobalHeraud
 
西北大学毕业证学位证成绩单-怎么样办伪造
西北大学毕业证学位证成绩单-怎么样办伪造西北大学毕业证学位证成绩单-怎么样办伪造
西北大学毕业证学位证成绩单-怎么样办伪造kbdhl05e
 
Passbook project document_april_21__.pdf
Passbook project document_april_21__.pdfPassbook project document_april_21__.pdf
Passbook project document_april_21__.pdfvaibhavkanaujia
 
Mookuthi is an artisanal nose ornament brand based in Madras.
Mookuthi is an artisanal nose ornament brand based in Madras.Mookuthi is an artisanal nose ornament brand based in Madras.
Mookuthi is an artisanal nose ornament brand based in Madras.Mookuthi
 
昆士兰大学毕业证(UQ毕业证)#文凭成绩单#真实留信学历认证永久存档
昆士兰大学毕业证(UQ毕业证)#文凭成绩单#真实留信学历认证永久存档昆士兰大学毕业证(UQ毕业证)#文凭成绩单#真实留信学历认证永久存档
昆士兰大学毕业证(UQ毕业证)#文凭成绩单#真实留信学历认证永久存档208367051
 
FiveHypotheses_UIDMasterclass_18April2024.pdf
FiveHypotheses_UIDMasterclass_18April2024.pdfFiveHypotheses_UIDMasterclass_18April2024.pdf
FiveHypotheses_UIDMasterclass_18April2024.pdfShivakumar Viswanathan
 
定制(RMIT毕业证书)澳洲墨尔本皇家理工大学毕业证成绩单原版一比一
定制(RMIT毕业证书)澳洲墨尔本皇家理工大学毕业证成绩单原版一比一定制(RMIT毕业证书)澳洲墨尔本皇家理工大学毕业证成绩单原版一比一
定制(RMIT毕业证书)澳洲墨尔本皇家理工大学毕业证成绩单原版一比一lvtagr7
 
'CASE STUDY OF INDIRA PARYAVARAN BHAVAN DELHI ,
'CASE STUDY OF INDIRA PARYAVARAN BHAVAN DELHI ,'CASE STUDY OF INDIRA PARYAVARAN BHAVAN DELHI ,
'CASE STUDY OF INDIRA PARYAVARAN BHAVAN DELHI ,Aginakm1
 
Call Us ✡️97111⇛47426⇛Call In girls Vasant Vihar༒(Delhi)
Call Us ✡️97111⇛47426⇛Call In girls Vasant Vihar༒(Delhi)Call Us ✡️97111⇛47426⇛Call In girls Vasant Vihar༒(Delhi)
Call Us ✡️97111⇛47426⇛Call In girls Vasant Vihar༒(Delhi)jennyeacort
 
原版美国亚利桑那州立大学毕业证成绩单pdf电子版制作修改#毕业文凭制作#回国入职#diploma#degree
原版美国亚利桑那州立大学毕业证成绩单pdf电子版制作修改#毕业文凭制作#回国入职#diploma#degree原版美国亚利桑那州立大学毕业证成绩单pdf电子版制作修改#毕业文凭制作#回国入职#diploma#degree
原版美国亚利桑那州立大学毕业证成绩单pdf电子版制作修改#毕业文凭制作#回国入职#diploma#degreeyuu sss
 
Pharmaceutical Packaging for the elderly.pdf
Pharmaceutical Packaging for the elderly.pdfPharmaceutical Packaging for the elderly.pdf
Pharmaceutical Packaging for the elderly.pdfAayushChavan5
 
原版1:1定制堪培拉大学毕业证(UC毕业证)#文凭成绩单#真实留信学历认证永久存档
原版1:1定制堪培拉大学毕业证(UC毕业证)#文凭成绩单#真实留信学历认证永久存档原版1:1定制堪培拉大学毕业证(UC毕业证)#文凭成绩单#真实留信学历认证永久存档
原版1:1定制堪培拉大学毕业证(UC毕业证)#文凭成绩单#真实留信学历认证永久存档208367051
 
办理(宾州州立毕业证书)美国宾夕法尼亚州立大学毕业证成绩单原版一比一
办理(宾州州立毕业证书)美国宾夕法尼亚州立大学毕业证成绩单原版一比一办理(宾州州立毕业证书)美国宾夕法尼亚州立大学毕业证成绩单原版一比一
办理(宾州州立毕业证书)美国宾夕法尼亚州立大学毕业证成绩单原版一比一F La
 
ARt app | UX Case Study
ARt app | UX Case StudyARt app | UX Case Study
ARt app | UX Case StudySophia Viganò
 
Call Girls in Okhla Delhi 💯Call Us 🔝8264348440🔝
Call Girls in Okhla Delhi 💯Call Us 🔝8264348440🔝Call Girls in Okhla Delhi 💯Call Us 🔝8264348440🔝
Call Girls in Okhla Delhi 💯Call Us 🔝8264348440🔝soniya singh
 
How to Empower the future of UX Design with Gen AI
How to Empower the future of UX Design with Gen AIHow to Empower the future of UX Design with Gen AI
How to Empower the future of UX Design with Gen AIyuj
 
Call Girls Aslali 7397865700 Ridhima Hire Me Full Night
Call Girls Aslali 7397865700 Ridhima Hire Me Full NightCall Girls Aslali 7397865700 Ridhima Hire Me Full Night
Call Girls Aslali 7397865700 Ridhima Hire Me Full Nightssuser7cb4ff
 
Cosumer Willingness to Pay for Sustainable Bricks
Cosumer Willingness to Pay for Sustainable BricksCosumer Willingness to Pay for Sustainable Bricks
Cosumer Willingness to Pay for Sustainable Bricksabhishekparmar618
 
Call Girls Satellite 7397865700 Ridhima Hire Me Full Night
Call Girls Satellite 7397865700 Ridhima Hire Me Full NightCall Girls Satellite 7397865700 Ridhima Hire Me Full Night
Call Girls Satellite 7397865700 Ridhima Hire Me Full Nightssuser7cb4ff
 
3D Printing And Designing Final Report.pdf
3D Printing And Designing Final Report.pdf3D Printing And Designing Final Report.pdf
3D Printing And Designing Final Report.pdfSwaraliBorhade
 

Kürzlich hochgeladen (20)

PORTFOLIO DE ARQUITECTURA CRISTOBAL HERAUD 2024
PORTFOLIO DE ARQUITECTURA CRISTOBAL HERAUD 2024PORTFOLIO DE ARQUITECTURA CRISTOBAL HERAUD 2024
PORTFOLIO DE ARQUITECTURA CRISTOBAL HERAUD 2024
 
西北大学毕业证学位证成绩单-怎么样办伪造
西北大学毕业证学位证成绩单-怎么样办伪造西北大学毕业证学位证成绩单-怎么样办伪造
西北大学毕业证学位证成绩单-怎么样办伪造
 
Passbook project document_april_21__.pdf
Passbook project document_april_21__.pdfPassbook project document_april_21__.pdf
Passbook project document_april_21__.pdf
 
Mookuthi is an artisanal nose ornament brand based in Madras.
Mookuthi is an artisanal nose ornament brand based in Madras.Mookuthi is an artisanal nose ornament brand based in Madras.
Mookuthi is an artisanal nose ornament brand based in Madras.
 
昆士兰大学毕业证(UQ毕业证)#文凭成绩单#真实留信学历认证永久存档
昆士兰大学毕业证(UQ毕业证)#文凭成绩单#真实留信学历认证永久存档昆士兰大学毕业证(UQ毕业证)#文凭成绩单#真实留信学历认证永久存档
昆士兰大学毕业证(UQ毕业证)#文凭成绩单#真实留信学历认证永久存档
 
FiveHypotheses_UIDMasterclass_18April2024.pdf
FiveHypotheses_UIDMasterclass_18April2024.pdfFiveHypotheses_UIDMasterclass_18April2024.pdf
FiveHypotheses_UIDMasterclass_18April2024.pdf
 
定制(RMIT毕业证书)澳洲墨尔本皇家理工大学毕业证成绩单原版一比一
定制(RMIT毕业证书)澳洲墨尔本皇家理工大学毕业证成绩单原版一比一定制(RMIT毕业证书)澳洲墨尔本皇家理工大学毕业证成绩单原版一比一
定制(RMIT毕业证书)澳洲墨尔本皇家理工大学毕业证成绩单原版一比一
 
'CASE STUDY OF INDIRA PARYAVARAN BHAVAN DELHI ,
'CASE STUDY OF INDIRA PARYAVARAN BHAVAN DELHI ,'CASE STUDY OF INDIRA PARYAVARAN BHAVAN DELHI ,
'CASE STUDY OF INDIRA PARYAVARAN BHAVAN DELHI ,
 
Call Us ✡️97111⇛47426⇛Call In girls Vasant Vihar༒(Delhi)
Call Us ✡️97111⇛47426⇛Call In girls Vasant Vihar༒(Delhi)Call Us ✡️97111⇛47426⇛Call In girls Vasant Vihar༒(Delhi)
Call Us ✡️97111⇛47426⇛Call In girls Vasant Vihar༒(Delhi)
 
原版美国亚利桑那州立大学毕业证成绩单pdf电子版制作修改#毕业文凭制作#回国入职#diploma#degree
原版美国亚利桑那州立大学毕业证成绩单pdf电子版制作修改#毕业文凭制作#回国入职#diploma#degree原版美国亚利桑那州立大学毕业证成绩单pdf电子版制作修改#毕业文凭制作#回国入职#diploma#degree
原版美国亚利桑那州立大学毕业证成绩单pdf电子版制作修改#毕业文凭制作#回国入职#diploma#degree
 
Pharmaceutical Packaging for the elderly.pdf
Pharmaceutical Packaging for the elderly.pdfPharmaceutical Packaging for the elderly.pdf
Pharmaceutical Packaging for the elderly.pdf
 
原版1:1定制堪培拉大学毕业证(UC毕业证)#文凭成绩单#真实留信学历认证永久存档
原版1:1定制堪培拉大学毕业证(UC毕业证)#文凭成绩单#真实留信学历认证永久存档原版1:1定制堪培拉大学毕业证(UC毕业证)#文凭成绩单#真实留信学历认证永久存档
原版1:1定制堪培拉大学毕业证(UC毕业证)#文凭成绩单#真实留信学历认证永久存档
 
办理(宾州州立毕业证书)美国宾夕法尼亚州立大学毕业证成绩单原版一比一
办理(宾州州立毕业证书)美国宾夕法尼亚州立大学毕业证成绩单原版一比一办理(宾州州立毕业证书)美国宾夕法尼亚州立大学毕业证成绩单原版一比一
办理(宾州州立毕业证书)美国宾夕法尼亚州立大学毕业证成绩单原版一比一
 
ARt app | UX Case Study
ARt app | UX Case StudyARt app | UX Case Study
ARt app | UX Case Study
 
Call Girls in Okhla Delhi 💯Call Us 🔝8264348440🔝
Call Girls in Okhla Delhi 💯Call Us 🔝8264348440🔝Call Girls in Okhla Delhi 💯Call Us 🔝8264348440🔝
Call Girls in Okhla Delhi 💯Call Us 🔝8264348440🔝
 
How to Empower the future of UX Design with Gen AI
How to Empower the future of UX Design with Gen AIHow to Empower the future of UX Design with Gen AI
How to Empower the future of UX Design with Gen AI
 
Call Girls Aslali 7397865700 Ridhima Hire Me Full Night
Call Girls Aslali 7397865700 Ridhima Hire Me Full NightCall Girls Aslali 7397865700 Ridhima Hire Me Full Night
Call Girls Aslali 7397865700 Ridhima Hire Me Full Night
 
Cosumer Willingness to Pay for Sustainable Bricks
Cosumer Willingness to Pay for Sustainable BricksCosumer Willingness to Pay for Sustainable Bricks
Cosumer Willingness to Pay for Sustainable Bricks
 
Call Girls Satellite 7397865700 Ridhima Hire Me Full Night
Call Girls Satellite 7397865700 Ridhima Hire Me Full NightCall Girls Satellite 7397865700 Ridhima Hire Me Full Night
Call Girls Satellite 7397865700 Ridhima Hire Me Full Night
 
3D Printing And Designing Final Report.pdf
3D Printing And Designing Final Report.pdf3D Printing And Designing Final Report.pdf
3D Printing And Designing Final Report.pdf
 

Risk and standards based riprap design for grahamstown dam barker & holroyde

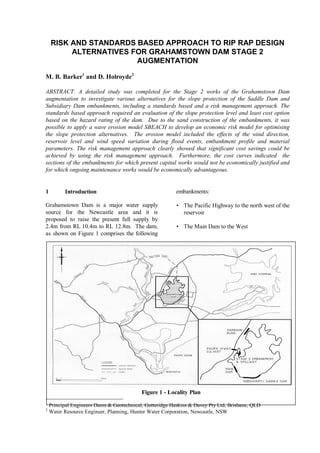
  • 1. RISK AND STANDARDS BASED APPROACH TO RIP RAP DESIGN ALTERNATIVES FOR GRAHAMSTOWN DAM STAGE 2 AUGMENTATION M. B. Barker1 and D. Holroyde2 ABSTRACT. A detailed study was completed for the Stage 2 works of the Grahamstown Dam augmentation to investigate various alternatives for the slope protection of the Saddle Dam and Subsidiary Dam embankments, including a standards based and a risk management approach. The standards based approach required an evaluation of the slope protection level and least cost option based on the hazard rating of the dam. Due to the sand construction of the embankments, it was possible to apply a wave erosion model SBEACH to develop an economic risk model for optimising the slope protection alternatives. The erosion model included the effects of the wind direction, reservoir level and wind speed variation during flood events, embankment profile and material parameters. The risk management approach clearly showed that significant cost savings could be achieved by using the risk management approach. Furthermore, the cost curves indicated the sections of the embankments for which present capital works would not be economically justified and for which ongoing maintenance works would be economically advantageous. 1 Principal Engineers Dams & Geotechnical, Gutteridge Haskins & Davey Pty Ltd, Brisbane, QLD 2 Water Resource Engineer, Planning, Hunter Water Corporation, Newcastle, NSW 1 Introduction Grahamstown Dam is a major water supply source for the Newcastle area and it is proposed to raise the present full supply by 2.4m from RL 10.4m to RL 12.8m. The dam, as shown on Figure 1 comprises the following embankments: • The Pacific Highway to the north west of the reservoir • The Main Dam to the West Figure 1 - Locality Plan
  • 2. • The Subsidiary/Saddle Dam to the South • The new embankment adjacent to the proposed spillway to the north west With the exception of the new embankment, all of the existing embankments have been constructed of sand. The main and saddle dam embankments have a central core while the subsidiary embankment has a bentonite sand cut-off. The raising is being completed in stages for which Stage 1 comprised raising the core level of the existing embankments to a level required for the Stage 2 full supply level and rip rap slope protection of the main embankment. The stage 2 works comprises construction of a new spillway and associated embankment, a culvert below the Pacific Highway to pass the new spillway flows, a protection bund for the Newline Road and pollution control works. To comply with the Supplementary Environmental Impact Statement for the Stage 2 works, approximately 3000m of the Saddle Dam and Subsidiary Dam upstream slopes required investigation and design of slope protection works. The objectives were to provide protection works in accordance with the ANCOLD 2000 Guidelines for Selection of Acceptable Flood Capacity for Dams to the satisfaction of the New South Wales Dam Safety Committee. 2 Hazard Classification The Main Dam has a hazard classification of High A due to the population at risk downstream of the main embankment and the high value of the stored water. This classification is applicable to the implementation of Surveillance and Operation and Maintenance procedures. Subject to New South Wales Dam Safety Committee approval, where there are distinct embankments comprising the dam, each structure may be considered separately for dam design. Based on the reduced consequences of Saddle Dam and Subsidiary Dam failure, the hazard rating to be used for design of the slope protection works for the Saddle Dam and Subsidiary Dam was assessed to be between Significant and High A. The acceptable flood capacity for a Significant Hazard Category Dam is in the range from 1:1000 to 1:10,000 AEP flood but not less than at least half the PMF while the acceptable flood capacity for the High A Hazard category dam is the PMF. As shown in Table 1, the calculated 1:10,000 AEP event is about half the PMF and was used for the standards based approach to the design of the Grahamstown Subsidiary and Saddle Dam slope protection works. Flood Event ARI (years) Outlfow (m3 /s) Max RL (m) 10 99 13.15 100 143 13.32 1000 240 13.53 10,000 350 13.73 PMF 628 14.12 Table 1 - Grahamstown Dam Floodrouting Data 3 Embankment Descriptions The Saddle Dam and Subsidiary Dam from chainage 0m to 650m are sand embankments with an upstream slope of about 8H on 1V and a downstream slope of 4H on 1V. The Saddle Dam has a vertical impervious clay core of approximately 6.1m wide while the Subsidiary Dam has a 1.5m wide bentonite sand cut-off. Rip rap slope protection on these embankment sections was generally placed at a slope of about 2H on 1V up to RL 12.8m with a thickness of 910mm and a d50 of 460mm. The Subsidiary Dam between chainage 650m to about 2000m comprises sand embankments on natural ground (sand). The upstream slope varies from about 14H on 1V for the natural ground surface to 6H on 1V for the placed embankment. The section profile and slope protection varies along this section of the embankment for which there are no design details. Rip rap slope protection has been placed in areas of the embankment which have suffered beach erosion in the past as well as a 300m length of the embankment (Embankment section 5 of Figure 3) where rip rap slope protection of about 2m width has been placed
  • 3. along the embankment. The embankment sections are grassed on the upstream side above the level of any rip rap to the crest of the embankment. During the Stage 1 construction, the core sections of all embankemnts were raised using a 300mm wide bentonite/clay section placed along the centre line of the core and extending up to the crest level at about RL 14.8m. 4. Slope Protection Options The following options were considered for the riprap protection as shown in Figure 2. • RipRap layer placed along slope of the embankment with underlying filter or geotextile filter fabric to prevent washing out of sand from the existing embankment. • Rip Rap Berm with underlying geotextile filter fabric to prevent washing out of sand from the existing embankment. • Rip Rap Berm alternative design using a rip rap zone supported on earthfill with underlying geotextile filter fabric to prevent washing out of sand from the existing embankment. • Reno Mattress placed on the embankment slope and keyed into the existing rip rap with a gabion at the top level for anchoring the mattress and underlying geotextile filter fabric to prevent washing out of sand form the existing embankment. • Gabions placed on the existing rip rap with underlying geotextile on the embankment sand material to prevent washing out of the sand. The Saddle Dam and Subsidiary Dam vary in section along the embankment and typical cross sections and embankment lengths were selected for the study, as shown on Figure 3. Figure 3 - Location of Cross Sections used for Slope Protection Analysis Figure 2 - Slope Protection Options
  • 4. 5 Standards Based Evaluation The standards based or deterministic approach to the design and selection of the preferred slope protection option was carried out as follows: • Wind Data Analysis The 10minute, 3 hourly interval wind speed data for the Williamtown RAAF Base, which is located approximately 5km south east of the dam was analysed for the period from 1942 and 1999. The 1year, 10year and 100 year ARI peak wind speeds were estimated for various directions perpendicular to the embankments using Normal, Log-normal and Log Pearson III statistical methods. An alternative method of estimating wind speeds was carried out using the Australian Wind Code AS 1170.2-1989. The maximum hourly wind speed obtained from the statistical analysis and the Australian Wind Code as well as the USBR design wind speed of 30m/s were used for the wave estimation and rip-rap design. • Estimation of Wave Height and Run up The wave height and wave run up data for each embankment was calculated using the procedure given in the ACER Technical Memorandum No 2 - 1992 using the following steps: ð Calculation of the effective fetch for each embankment section; The effective fetch for the embankments was calcuated to be in the order of 4.8km ð Adjust the overland wind speed to obtain overwater speeds; The correction factors determined by USBR (1981) were used to select a wind velocity ratio of 1.26 for the effective fetch. ð Calculate the wind set up; The wind setup is the rise in the water level at the leeward end of the fetch resulting from the shear force of the wind over the water. ð Calculate the significant wave height, wave length and wave period; The significant wave height Hs, represents the average wave height of the highest one-third of the waves present in each interval. If the water depth is greater than one half the wave length, the waves can be considered to be deep water waves. In the case of Grahamstown Dam, which is a relatively shallow reservoir, the water depth was marginally less than half the wave length but the difference in the deep and shallow water wave heights for the Grahamstown Dam was not significant. ð Calculate the wave run-up on the embankment slope. Wave runup, R, which is the vertical difference between the maximum level attained by the rush of water up the slope and the stillwater elevation was estimated using the ACER formula: R H H L S S = +      0 4 0 5 . * cot( ) . θ Where: R = Wave runup (m) Hs = Significant Wave height (m) L = Wave length (m) θ = Angle of the dam face from the horizontal (°) The wind set up and wave run up were calculated for upstream slopes of 2H:1V, 6H:1V, 8H:1V and 10H:1V using the 1, 10 and 100 year ARI wind speeds for the dominant wind directions as well as the USBR recommended over water wind speed of 30 m/s. The results of the analyses for the Saddle Dam with the USBR and 100yr North Westerly wind and an 8H on 1V slope are shown in Table 2. Similar results were obtained for the Subsidiary Dam which indicated that for the 8H on 1V slope, the minimum slope protection level for the rip rap or reno-mattress options should be RL 14.5m.
  • 5. Description Unit 100yr USBR Wind vel. over land m/s 26.2 23.81 Wind vel. over water m/s 33.0 30.00 Minimum duration hour 0.62 0.65 Significant wave ht. m 1.74 1.55 Wave run-up m 0.66 0.59 Wind set up m 0.14 0.12 Total Wet Freeboard m 0.80 0.71 Minimum Rip Rap Level for 10,000 yr Flood RL13.73m m 14.53 14.44 Table 2 - Wave Data for Saddle Dam using NW Wind and Upstream Slope 8H:1V The analysis with the 2H on 1V slope indicated that the wave set up and run up would be significantly higher than the flatter slopes and further analysis was performed to develop a reservoir level frequency curve for combined wind and flood events for the 2H on 1V and 8H on 1V embankment slopes using the following wind speeds derived from the statistical analysis of the wind data. Wind ARI (years) 1 10 100 1000 10,000 Speed (m/s) 9.0 17.5 26.0 30.5 40.0 The 1000 and 10,000 year wind speeds were derived from extrapolation of the available data and were only used for this frequency analysis. Figure 3 shows the frequency versus reservoir level curve for the 2H on 1 V slope. The reservoir level frequency data indicated that the minimum levels for the slope protection should be 14.3m for the reno-mattress and rip rap options and 15.2m for the berm and gabion option. However, as the analyses could not account for the combined berm and beach effect up-slope of the berm, it was assessed that a minimum slope protection level of RL 14.9m would be required for the berm and gabion options. • Slope Protection Design The approach recommended by US Corps of Engineers Shore Protection Manual (1984) was used for the design of the rip rap. Assuming a Rayleigh distribution for the waves, the design wave height was taken to be 1.27 times the significant wave height Hs. The significant wave height was calculated using a wind velocity over water of 30 m/s for the Subsidiary Dam and 33.0 m/s for the Saddle Dam as these were the highest wind speeds found from the wind analyses. The weight of the graded rock in the riprap was calculated using the formula: W H K r D r W 50 3 3 1 = −       γ γ γ θ * * * cot( ) Where: W50 = weight of the 50% percent size in the riprap (kN) γr = unit weight of the riprap rock (kN/m3 ) γw = unit weight of the water (kN/m3 ) H = design wave height (m) θ = Angle of the dam face from the horizontal (°) KD = stability coefficient (2.5 for angular quarried rock and non breaking waves) The maximum weight of graded riprap (W100) was taken to be 4W50 and the minimum 0.125W50. These are equivalent to the maximum size of 1.5 times the D50, and minimum size 0.5 times D50. The equivalent sieve size of the riprap is approximately 1.15(W/γr)0.33 . The rip rap requirements were determined for the existing upstream slope of the subsidiary dam and saddle dam which varies from 6H:1V to 10H:1V. As one of the alternatives for the slope protection is a berm placed as a continuation of the existing rip rap slope, the rip rap requirements were also determined for the Figure 3 - Slope Protection Exceedence Curve for Embankment Slope 2H on 1V 1.E-08 1.E-07 1.E-06 1.E-05 1.E-04 1.E-03 1.E-02 1.E-01 1.E+00 12.5 13.0 13.5 14.0 14.5 15.0 15.5 16.0 16.5 Maximum Water Level (m) ExceedenceProbability 0 500,000 1,000,000 1,500,000 2,000,000 2,500,000 3,000,000 3,500,000 4,000,000 Cost(AUD) Flood Level Rip Rap Option Reno Mattress Option Berm Option Saddle Berm Option Alternative Gabion Option Independent wind and wave Assumed design curve with transition from independent to dependent Dependent wind and wave Figure 3 - Frequency Reservoir Level Curve for a 2:1 Slope
  • 6. Saddle Dam using a slope of 2H on 1V. The rip rap sizes for the 2H:1V and 8H:1V slopes are presented in Table 3. The design of the bedding layer below the rip- rap was carried out with reference to US Corps of Engineers (1995) and Fell et al (1992). In the case of the reno-mattress design, a runup correction factor was applied to the values calculated for the rip rap using the following roughness reduction factors: Rreno-mattress = 0.77 Rriprap = 0.61 The ratio of these roughness factors of 1.26 was applied to the wave run up and set up to calculate the thickness of a Maccaferri Reno- Mattress. A geotextile fabric below the reno- mattress was selected to prevent erosion of the underlying material through the reno-mattress. The analyses indicated that a reno-mattress thickness of 170mm was required. Description Unit 2:1 8:1 Unit Weight of Riprap kN/m3 25.0 25.0 Wind vel. over water m/s 33.0 33.0 Significant wave ht m 1.74 1.74 Design wave ht m 2.21 2.21 Max wt of riprap kN 64.2 16.0 50% Wt of riprap kN 16.0 4.0 Min. weight of riprap kN 2.01 0.5 Max. size of riprap m 1.57 0.99 50% size of riprap m 0.99 0.63 Min. size of riprap m 0.50 0.32 Table 3 - Saddle dam Riprap Design • Cost Estimation and Option Selection The quantities and costs for each slope protection option were estimated using the calculated rip rap layer thicknesses and berm dimensions for each slope protection option as shown on Figure 3 and Table 4 for the levels of protection at RL 14.3 and 14.9m. The rip rap option and the reno-mattress option were significantly more costly than the berm and gabion options. While the gabion option was the lowest cost alternative for all levels of slope protection, the wave run-up characteristics and erosion potential differ from the flatter slopes applicable to the other options. There was also some concern over the long term durability of the gabions. The reno-mattress, berm and gabion options were used for the risk analysis to determine the required protection level and preferred option for each section of the embankments. 6 Risk Analysis Due to the sand construction of the embankments, it was possible to apply a wave erosion model SBEACH to determine the likelihood of embankment failure or damage resulting from beaching of the sand in unprotected or partly protected areas and to produce a risk model to evaluate the least cost option for the slope protection. Risk Analysis Methodology 1. The wind and rain data were evaluated to determine the likely wind pattern for the 1, 10 and 100 year events and the coincidence of the peak winds and rainfall events; 2. The SBEACH model was checked for sensitivity to the input parameters and calibrated using historical erosion of the embankments; 3. The erosion potential of the waves on each embankment section was determined for a selected number of combined wind and flood events to evaluate the likelihood of embankment breach and damage and estimate the cost of erosion repair works; 4. A risk model was developed to derive the failure and damage likelihoods for each flood and wind event likely to occur using the reno-mattress, berm and gabion options constructed to various levels; 5. Annual risk costs for failure and erosion damage of the saddle dam and subsidiary Option Cost ($M) RL 14.3m RL 14.9m Rip Rap 5.16 >5.42 Berm 1.70 2.41 Berm 1.17 1.51 Reno Mattress 2.89 >3.04 Gabion 0.74 1.18 Table 4 - Slope Protection Option Costs
  • 7. dam sections were determined and the present value of the annual risk cost calculated and compared with the capital cost of slope protection works required to prevent erosion or damage of the embankments; 6. The present value for the maintenance, if carried out on a five yearly basis, was calculated and the equivalent annual maintenance cost determined for each option to assess the effect of the reduced costs on the decision regarding the least cost option; 7. The results were used to determine rip rap level required to minimise the risk cost of failure and repair/maintenance for each embankment section considering annual and five yearly maintenance programmes. ⇒ Wind Data Analysis The half hourly wind data available from the Bureau of Meteorology, was plotted together with the three hourly data to review the wind patterns which indicated the following: • the wind direction for the more extreme events is generally within a 30° arc; • Wind direction for the more frequent events (1 year ARI) can be in any direction. • The maximum wind speeds generally occurred with the wind direction from the west (270°) to the north west (315°); • The peak wind is not sustained for more that 3 hours for the higher wind speed events (30m/s) • for the wind speeds in the order of 20m/s, the wind can oscillate about this peak for an extended period, as observed in 1956 where the speed varied between 18m/s to 23m/s for about 48 hours. It was clear from the data that two distinct wind patterns could be generated, as shown on Figures 4 and 5 which were assessed to be likely 10 and 100 year ARI events respectively. From discussions with the Bureau of Meteorology, it was established that during major rainfall events, the wind direction is generally from the south east while the maximum wind speeds can occur during or after the peak rainfall event. It was conservatively assumed that the wind direction would be normal to the embankments. The wind peak was assumed to occur six hours 12.80 13.00 13.20 13.40 13.60 13.80 14.00 0 20 40 60 80 100 120 140 160 Time (hrs) ReservoirLevel(m) 12h 24h 36h 48h 72h Figure 6 - Flood Hydrographs for 1:200,000 AEP Flood with various Storm Durations 0.0 5.0 10.0 15.0 20.0 25.0 30.0 35.0 0 24 48 72 96 120 144 168 192 Time (hrs) WindSpeed(m/s) 1953 1956 1980 1986 1997 1998 Composite Figure 4 - Composite Maximum Wind Event 1 in 10 yr ARI 0.0 5.0 10.0 15.0 20.0 25.0 30.0 35.0 0 24 48 72 96 120 144 Time (hrs) WindSpeed(m/s) 1954 1952 1955 1951 1980 1997 Composite Figure 5 - Composite Maximum Wind Event 1 in 100 yr ARI
  • 8. after the flood peak. A sensitivity analysis on the coincidence of wind and flood peaks indicated that the selected offset of the peaks was likely to be the worst case scenario, however, longer duration peaks could result in about an additional 10% erosion. The longer duration storm events have extended periods of relatively high reservoir levels as shown on Figure 6 for the 200,000 year flood event hydrographs. Flood Event Storm Duration (hrs) Peak RL Max. Erosion PMF 12 or 24 72 or 24 1:200,000 36 72 1:2,000 36 72 1:10 48 72 Table 5 - Critical Storm Durations for Flood Level and Erosion Model The storm durations shown in Table 5 were relevant to the reservoir level and erosion potential of the embankment slope for which the maximum erosion storm duration hydrographs were used for the risk analysis. ⇒ Erosion Model The wave erosion was evaluated using the US Army Corps of Engineers Waterways Experiment Station program Storm Induced Beach Change (SBEACH 32 Version 2.0). SBEACH is an empirically based numerical model for simulating two dimensional cross shore beach change. The model was initially formulated using data from prototype scale laboratory experiments and further developed and verified on field measurements and sensitivity testing. In calculating the beach profile change, the model assumes that the cross-shore sediment transport is produced by breaking waves and changes in water level. Wave transformation and sediment transport rates are calculated using random wave properties. The random wave generation assumes that the wave height follows a Raleigh distribution with adjustments made for use of the significant wave height and wave decay over either a monotonic or non- monotonic profile. In the case of the non- monotonic profile, a predictive equation is included in the model to determine the number of waves that reform along the negatively sloping sections of the slope i.e. upslope of the berm options used for Grahamstown Dam. The random wave model uses the conservation of wave energy to solve wave energy flux equations and compute the wave height decay across the surf zone where the waves are breaking on the embankment slope. Wave and wind induced water level setup are included in the calculation by solving a cross-shore momentum equation. Computations of random wave parameters are performed across the profile at each time step based on input wave and water level information and the wave parameters are used to calculate the sediment transport rates. The input for the model included the flood hydrograph, wind speed and direction,, significant wave height and period, embankment section and embankment material properties including: − Effective grain size diameter; − Avalanching angle which defines the steepest profile that can develop before avalanching of the beaching material occurs and was assumed to be 45° for the well compacted material which had evidence of near vertical erosion faces. − A transport rate coefficient (K) which influences the rate at which transport occurs when the energy dissipation per unit volume is greater than the equilibrium energy dissipation per unit volume. − Slope Dependent Transport term (ε) which influences the slope of the eroded profile. Higher values of this parameter result in profiles with gentler slopes and flatter bars Figure 7 - Description of Shore Profile
  • 9. while lower values result in steeper near shore profiles and steeper bars. − Depth of Foreshore Parameter DFS which defines the landward end of the surf zone in the model and affects the magnitude of transport in the swash zone. A higher value, corresponding to a greater depth at the boundary between the surf and swash zones, typically increases the transport rates in the swash zone producing more erosion at the foreshore. ⇒ Erosion Model Sensitivity and Calibration Sensitivity analyses and model calibration were carried out on a section of the Subsidiary Dam using the annual wind with the reservoir at the FSL and a sand size of 0.35mm. The following parameters were used: • Grid spacing 5m, 3m, 2m, 1m. The model was found to be particularly sensitive to the grid spacing for which a 1m spacing was required to correctly model the gabion and berm options. Larger grid spacing underestimated the erosion potential. • Particle Size Sensitivity analysis was performed with particle sizes from 0.25mm to 0.35mm. The particle size of 0.25mm is consistent with wind blown material in the area while the 0.35mm was the average of the main embankment particle size. • Transport Rate Coefficient The transport rate coefficient (K) was varied and finally selected to provide a reasonable depth of erosion. • Slope Dependent Transport term (ε) The slope dependent transport term had a significant impact on the erosion potential and was reduced from the default value of 0.002m2 /s to 0.001m2 /s to improve the erosion prediction. • Depth of Foreshore Parameter DFS The erosion was found to be relatively insensitive to this parameter which was kept at the default value of 0.3m Erosion Analysis The wave erosion model was run for each of the representative embankment sections using the PMF; 200,000 year; 2,000 year; and 10 year ARI flood events and the FSL using the 100, 10 and 1 year ARI wind events. In the case of the FSL condition, the erosion was analysed using a 10,000year ARI wind event for each embankment to determine the likelihood of failure under this extreme event. A typical input hydrograph and wind speed data for the 200yr flood and the 10yr wind is shown on Figure 8. 6 7 8 9 10 11 12 13 14 15 16 20 30 40 50 60 70 80 90 100 110 Chainage (m) Level(m) Original Profile 10,000 yr Wind (Sand 0.3mm) 100 yr Wind (Sand 0.25mm) 100 yr Wind (Sand 0.3mm) 100 yr Wind (Sand 0.35mm) 10 yr Wind (Sand 0.25mm) 10 yr Wind (Sand 0.3mm) 10 yr Wind (Sand 0.35mm) 1 yr Wind (Sand 0.25mm) 1 yr Wind (Sand 0.3mm) 1 yr Wind (Sand 0.35mm) Figure 9 - Saddle Dam Erosion Plots for FSL & Existing Slope Protection 6 7 8 9 10 11 12 13 14 15 16 20 30 40 50 60 70 80 90 100 110 Chainage (m) Level(m) Original Profile 100 yr Wind (Sand 0.25mm) 100 yr Wind (Sand 0.3mm) 100 yr Wind (Sand 0.35mm) 10 yr Wind (Sand 0.25mm) 10 yr Wind (Sand 0.3mm) 10 yr Wind (Sand 0.35mm) 1 yr Wind (Sand 0.25mm) 1 yr Wind (Sand 0.3mm) 1 yr Wind (Sand 0.35mm) Figure 10 - Subsidiary Dam Section 1 Erosion Plot for FSL & Existing Slope Protection 12.8 13.0 13.2 13.4 13.6 13.8 14.0 0 12 24 36 48 60 72 84 96 108 120 132 144 156 168 180 192 204 216 Time (hrs) RL(m) 0 4 8 12 16 20 24 WindVelocity(m/s) Flood Level Wind Velocity over Water Figure 8 - 2000 yr Flood and 10 yr Wind
  • 10. The models were run using the existing embankment configuration and at least two levels of slope protection for each option in order to provide data for the risk analysis and cost optimisation. ⇒ Erosion Analysis Results Typical erosion plots are shown on Figures 9, 10 and 11 for the Full Supply Level conditions and the annual wind for the existing Saddle Dam and Section 1 of the Subsidiary Dam with and without the proposed slope protection in this embankment section. The models showed that the beach erosion forms relatively rapidly and then maintains a stable profile. The erosion of the embankment does not extend through the core zone below the FSL of RL12.8m, however, considerable damage occurs for a number of flood events. The erosion for the full supply level condition indicated that the erosion will progress about 5m to 10m into the face of the embankments to a depth of up to 1m. The volume of material eroded was calculated for each embankment using the level difference at each 1m grid point between the original profile and the eroded profile. A damage factor was used to account for the non uniformity of the erosion along the full length of each section and the cost for the repairs calculated using a rate for replacement of eroded sand. Repair cost versus frequency curves were developed for each embankment section and level of slope protection for all of the options. A typical plot is shown on Figure 12 for Section 1 of the Subsidiary Dam with the Berm protection option to RL 13.0m. ⇒ Risk Model The following assumptions and limitations applied to the risk analysis. ◊ The likelihood of coincident winds occurring with floods increases with flood magnitude to the point where at the PMF, the 100 year wind may be coincident with the peak flow ( Met. Bureau). ◊ The peak flood levels for the PMF event occur during the 12hr or 24hr storm event. The PMF event was also evaluated using a 72 hour storm duration. ◊ Peak winds occur at about 6hrs after the peak flood level. Sensitivity analysis to the occurrence of the wind was carried out. ◊ The annual wind speed occurrs continuously for 30% of the year. ◊ Only the critical storm durations for each flood have been used. ◊ The risk assessment applies only to the flood and wind events. 6 7 8 9 10 11 12 13 14 15 16 20 30 40 50 60 70 80 90 100 110 Chainage (m) Level(m) Original Profile 100yr Wind 10yr Wind 1yr Wind Figure 11 - Subsidiary Dam Section 1 Erosion Plot for FSL & Berm Slope Protection Subsidiary Dam Section 1 - Repair Costs versus Flood Frequency Berm Slope Protection at RL 13.0m 0 2,000 4,000 6,000 8,000 10,000 12,000 14,000 16,000 1.E-06 1.E-05 1.E-04 1.E-03 1.E-02 1.E-01 1.E+00 Flood Frequency RepairCosts($) 100yr Wind 10yr Wind 1yr Wind Figure 12 - Typical Plot of Repair Cost versus Frequency Slope Protection PMF to 100,000 100,000 to 10,000 10,000 to 1,000 1,000 to 100 100 to 10 10 to 1 100yr Wind 10 yr Wind 1 yr Wind Damage No Damage Failure No Failure Figure 13 - Part Event Tree
  • 11. The risk model combined the likelihood of the flood and wind events with the potential damage and failure probabilities assessed using the wave erosion results. A typical model, as shown in Figure 13 for the Saddle Dam existing slope protection, included the following event sequences occurring during a flood event. Ø Flood and Wind The flood and wind combinations are shown on Table 6. Ø Erosion Damage Ø Embankment Failure Ø Embankment OK The model was run for each embankment section with the slope protection levels appropriate to each option. Flood Event Interval (years) Wind ARI (years) 1 to 10 1, 10, 100 10 to 100 1, 10, 100 100 to 1000 1, 10, 100 1,000 to 10,000 10, 100 10,000 to 100,000 100 100,000 to PMF 100 Table 6 - Flood and Wind Event Combinations for Risk Analysis The total annual risk cost of damage or failure and the present value of each was calculated using a discount rate of 8% and lifetime of 100years. The present value maintenance risk cost was also determined using a 5 yearly interval for the annual risk cost and the equivalent annual series costs determined for this maintenance cost. ⇒ Risk Analysis Results and Evaluation The risk analysis provided failure and damage risk costs and total risk cost for each flood and wind event range for present conditions. The results for each flood range are shown in Tables 7 for Section 1 of the Subsidiary Dam. The capital cost, annual and present value failure and maintenance costs for each slope protection option were obtained for the embankment sections. The results for the Section 1 of the Subsidiary Dam are shown on Table 8 and the data for the berm option of this embankment section is shown on Figure 14. The results for this embankment are typical of the other embankments and showed the following: • The majority of the damage risk cost with the existing conditions occurs with the more frequent annual flood events. • The majority of the damage risk costs for the wind events occurs as a result of the annual wind event. This is due to the extended duration of the wind events and the high percentage damage expected from the annual wind; • Increasing the slope protection level results in increased present value costs for Flood Event Range Failure Risk Cost Damage Risk Cost Total Risk Cost (years) Risk Cost ($) Percent of Total Risk Cost ($) Percent of Total Risk Cost ($) Percent of Total 10 to 1 228 1.6% 12,370 88.5% 12,598 90.1% 100 to 10 228 1.6% 200 1.4% 428 3.1% 1,000 to 100 789 5.6% 24 0.2% 813 5.8% 10,000 to 1,000 79 0.6% 12 0.1% 91 0.6% 100,000 to 10,000 39 0.3% 2 0.0% 41 0.3% PMF to 100,000 8 0.1% 0 0.0% 8 0.1% Totals $ 1,371 9.8% $ 12,608 90.2% 13,979 100% $ 13,979 Table 7 - Summary of Risk Costs for Subsidiary Dam Section 1 with Existing Conditions 0 20,000 40,000 60,000 80,000 100,000 120,000 140,000 160,000 180,000 11.5 12 12.5 13 13.5 14 Slope Protection Level (m) RiskCost($) 0 20,000 40,000 60,000 80,000 100,000 120,000 140,000 160,000 180,000 Capital+PVMaintenaceRiskCost($) Failure and Maintenance Total PV Risk Cost Maintenance Annual Risk Cost Maintenance PV Risk Cost Capital + PV Maintenance Initial Capital Cost Figure 14 - Risk Analysis Berm Option
  • 12. maintenance and initial capital cost. • As the beach erosion model indicated that the beaching is likely to be stable and not progress to failure, it was considered appropriate to extend the maintenance period to a 5 yearly interval which significantly reduced the total maintenance risk cost taken over a 50 year lifetime. As shown on Table 8, the capital and present value of the risk cost for the Subsidiary Dam Section 1 was reduced from $154,241 to $26,291. • Of all of the embankment areas analysed, only Section 1 of the Subsidiary Dam could be shown to have similar capital costs for the slope protection option compared with ongoing maintenance of the do-nothing option. The results for the remainder of the embankments indicated that the present value of the reduced maintenance cost and capital cost was significantly higher than the maintenance costs for the do-nothing option. Based on the results of the risk analysis, the following recommendations were made for the Slope Protection works for the Grahamstown Saddle Dam and Subsidiary Dam: − provide additional slope protection for the Section 1 of the Subsidiary Dam from the present level of RL 11.5m to RL 13.0m during the present Stage 2 augmentation works. The slope protection will be required over a length of about 100m of the embankment at a cost of about $35,000; − apart from Section 1 of the Subsidiary Dam, provide no additional slope protection for the Saddle Dam or the Subsidiary Dam during the present Stage 2 augmentation works; − perform maintenance and remedial works at five yearly intervals; − monitor the embankments for signs of excessive erosion beyond that predicted by the erosion model. If this occurs, slope protection should be constructed using either the berm or gabion options to a level considered appropriate to the observed damage and as necessary to minimise the total risk cost; − Plant water resistant grass between RL 10.4m and RL 12.8m along Section 2 of the Subsidiary Dam and between RL 11.5m Protection Level Initial Capital Failure and Maintenance Cost Maintenance Cost ($) Capital + PV Maint. (m) Cost ($) Annual Risk Cost ($) PV Risk Cost ($) Annual Risk Cost PV Risk Cost PV Risk Cost - 5yr Interval Annual Maint. for 5yr Risk Cost ($) Reno Mattress 11.5 0 13,979 171,011 12,608 154,241 26,291 2,149 154,241 13 49,018 2,274 27,813 903 11,043 1,882 154 60,060 13.6 65,874 643 7,870 115 1,405 240 20 67,280 Berm 11.5 0 13,979 171,011 12,608 154,241 26,291 2,149 154,241 13 32,523 1,666 20,384 295 3,613 616 50 36,137 13.6 53,824 585 7,152 56 687 117 10 54,510 Gabion (Risk Model Assumed to be the same as the Berm Option) 11.5 0 13,979 171,011 12,608 154,241 26,291 2,149 154,241 13 42,000 1,666 20,384 295 3,613 616 50 45,613 13.6 66,000 585 7,152 56 687 117 10 66,687 Table 8 - Risk Analysis Results Subsidiary Dam Section 1
  • 13. to 12.8m along Section 1 of the Subsidiary Dam; − Where required, grass of the runner type should be planted above the existing rip rap or the water resistant grass up to the embankment crest level to bind the sand together and provide some resistance to wind and wave erosion. 7 Summary and Conclusions An economic risk model was developed for the Grahamstown Dam Saddle and Subsidiary embankment sections with various types and levels of slope protection. The costs for slope protection options were developed using slope protection levels based on a standards approach for slope protection. A risk management approach was then used to develop damage risk costs for each slope protection level and a present value analysis performed to provide cost curves of total cost versus slope protection level. The cost curves were finally used to determine the required slope protection measure and the level to which the protection was required for each of the representative embankment sections. The risk management approach clearly showed that a significant cost savings in the order of $1M could be achieved by using the risk management approach rather than the standards approach. Furthermore, the cost curves clearly showed the sections of the embankments for which present capital works would not be economically justified and for which ongoing maintenance works would be economically advantageous. References CEC (1993), “Augmentation of Lake Grahamstown Report on Final Spillway Layout”, Civil Engineering Consulting, February 1993 SBEACH (1996), “SBEACH Numerical Model for Simulating Storm Induced Beach Change Report 4”, US Army Corps of Engineers, Waterways Experiment Station, Technical Report CERC-89-9, April 1996 Decision Tools (1996), “Decision Tools Suite - @Risk, Precision Tree, Top Rank, Best Fit and Risk View” Palisade Corporation, Windows Version 1996 ANCOLD (2000) “Guidelines on Selection of Acceptable Flood Capacity for Dams”, March 2000