Kshivets O. Cancer, Computer Sciences and Alive Supersystems
MCR_Article_JW
1. Genomics
Genomic Analysis of Head and Neck Squamous Cell
Carcinoma Cell Lines and Human Tumors: A Rational
Approach to Preclinical Model Selection
Hua Li1
, John S. Wawrose1
, William E. Gooding2
, Levi A. Garraway5,6,7
, Vivian Wai Yan Lui1
, Noah D. Peyser1
,
and Jennifer R. Grandis1,3,4
Abstract
Head and neck squamous cell carcinoma (HNSCC) is the sixth most common type of cancer worldwide.
The increasing amount of genomic information on human tumors and cell lines provides more biologic data to
design preclinical studies. We and others previously reported whole-exome sequencing data of 106 HNSCC
primary tumors. In 2012, high-throughput genomic data and pharmacologic profiling of anticancer drugs of
hundreds of cancer cell lines were reported. Here, we compared the genomic data of 39 HNSCC cell lines with the
genomic findings in 106 HNSCC tumors. Amplification of eight genes (PIK3CA, EGFR, CCND2, KDM5A,
ERBB2, PMS1, FGFR1, and WHSCIL1) and deletion of five genes (CDKN2A, SMAD4, NOTCH2, NRAS, and
TRIM33) were found in both HNSCC cell lines and tumors. Seventeen genes were only mutated in HNSCC cell
lines (>10%), suggesting that these mutations may arise through immortalization in tissue culture. Conversely, 11
genes were only mutated in >10% of human HNSCC tumors. Several mutant genes in the EGF receptor (EGFR)
pathway are shared both in cell lines and in tumors. Pharmacologic profiling of eight anticancer agents in six
HNSCC cell lines suggested that PIK3CA mutation may serve as a predictive biomarker for the drugs targeting the
EGFR/PI3K pathway. These findings suggest that a correlation of gene mutations between HNSCC cell lines and
human tumors may be used to guide the selection of preclinical models for translational research.
Implications: These findings suggest that a correlation of gene mutations between HNSCC cell lines and human
tumors may be used to guide the selection of preclinical models for translational research.
Visual Overview: http://mcr.aacrjournals.org/content/12/4/571/F1.large.jpg.
Mol Cancer Res; 12(4); 571–82. Ó2014 AACR.
Introduction
Head and neck squamous cell carcinoma (HNSCC) is the
sixth most common cancer worldwide, arising in the upper ae-
rodigestive tract, including the oral cavity, pharynx, and larynx.
HNSCC, with more than 600,000 new cases diagnosed
annually, is often lethal with only 40% to 50% of HNSCC
patients surviving 5 years after their diagnosis (1). Risk factors
for HNSCC include tobacco and alcohol use. Infection with
the human papilloma virus (HPV) is increasingly identified as
a strong contributing factor, especially in oropharyngeal cancer
(1, 2). Inherited disorders such as Fanconi anemia are also
associated with increased susceptibility to HNSCC (3).
HNSCC cell lines have been developed in many labora-
tories worldwide (4). Improved understanding of the bio-
logic underpinnings of HNSCC and a more rational
approach to therapy can best be accomplished through the
judicious use of models that reproduce key features of
human tumors. The use of cell lines derived from human
tumors dates back to derivation of HeLa cells, a robust cancer
cell line developed from a cervical cancer afflicting a patient
named Henrietta Lacks in 1951 (5). In 1990, cancer cell
lines encompassing nine tumor types were used as preclinical
models for drug-screening efforts known as the NCI60
collection. To date, more than 10,000 different potential
therapeutic agents have been tested using these models (6).
Although the NCI60 contains a wide variety of cancer types,
the collection lacks HNSCC cell lines. In 2010, the genomic
profiling and pharmacologic data for 311 cancer cell lines
was released by GlaxoSmithKline via the National Cancer
Institute's cancer Bioinformatics Grid (caBIG), including 10
HNSCC cell lines (7). However, none of these HNSCC cell
lines contained mutations in the six genes analyzed (HRAS,
KRAS, NRAS, BRAF, PIK3CA, and PTEN). Although larger
Authors' Affiliations: Departments of 1
Otolaryngology, 2
Biostatistics, and
3
Pharmacology & Chemical Biology, University of Pittsburgh School of
Medicine; 4
University of Pittsburgh Cancer Institute, Pittsburgh, Pennsyl-
vania; 5
The Broad Institute of Harvard and MIT, Cambridge; 6
Department of
Medical Oncology; and 7
Center for Cancer Genome Discovery, Dana-
Farber Cancer Institute, Harvard Medical School, Boston, Massachusetts
Note: Supplementary data for this article are available at Molecular Cancer
Research Online (http://mcr.aacrjournals.org/).
CorrespondingAuthor:JenniferR.Grandis,UniversityofPittsburghSchool
of Medicine, 200 Lothrop Street, Suite 500, Pittsburgh, PA 15213. Phone:
412-647-5979; Fax: 412-383-5409; E-mail: jgrandis@pitt.edu
doi: 10.1158/1541-7786.MCR-13-0396
Ó2014 American Association for Cancer Research.
Molecular
Cancer
Research
www.aacrjournals.org 571
2. cell line panels have been used for compound screening, no
study to date has focused on genetically characterized
HNSCC cell line panels.
The Cancer Cell Line Encyclopedia (CCLE), a compre-
hensive database including the mutational status of more
than 1,600 genes, gene expression, and chromosome copy-
number data across a panel of 947 human cancer cell lines
from 36 different tissue types was recently reported by
Barretina and colleagues (8). Similar to the NCI60 collec-
tion, pharmacologic profiling of 24 different anticancer
drugs and compounds was carried out in 479 of these cell
lines. The profiling focused on identifying preclinical, genet-
ic indicators of sensitivity to specific compounds (8). Thirty-
two HNSCC cell lines were included in the CCLE and
sequencing data were reported for 30 of these models. Drug-
sensitivity profiling was carried out in six of the HNSCC cell
lines. In addition to the CCLE, Garnett and colleagues
presented their systematic identification of genomic markers
of drug sensitivity in cancer cells, which is a repository of
mutation profiles of 639 cell lines, including 20 HNSCC cell
lines and 130 drugs for screening across the majority of these
cell lines. Eleven of these HNSCC cell lines and 25 of the
130 drugs were also studied in the CCLE. In contrast with
the high-throughput sequencing approach used in the
CCLE, the Garnett and colleagues database only rese-
quenced the full coding exons for 77 genes identified in
their Cancer Gene Census (9).
Cancer cell lines are typically used as preclinical models for
mechanistic studies. However, the potential for established
HNSCC cell lines to reflect the genetic alterations found in
human HNSCC tumors has not been thoroughly investi-
gated. Two recent studies have profiled the mutations, using
whole-exome sequencing, in 106 unique HNSCC tumor
samples (10, 11). These efforts revealed a number of onco-
genes implicated in the pathogenesis of HNSCC (10–12).
The present study was undertaken to compare the gene
mutation frequencies between HNSCC human tumors and
cell lines to facilitate the rational selection of cell line models
for translational HNSCC research.
Materials and Methods
Databases
Databases used in this article are publicly available. The
five cohorts are included:
1. HNSCC cell lines genomic and pharmacologic
profiling from Barretina and colleagues database
(http://www.nature.com/nature/journal/v483/
n7391/full/nature11003.html and http://www.
broadinstitute.org/ccle/home).
2. HNSCC cell lines genomic and pharmacologic
profiling from Garnett and colleagues database (http://
www.nature.com/nature/journal/v483/n7391/full/
nature11005.html).
3. HNSCC tumors genomic profiling from Stransky and
colleagues database (http://www.sciencemag.org/
content/333/6046/1157).
4. HNSCC tumors genomic profiling from Agrawal and
colleagues database (http://www.sciencemag.org/
content/333/6046/1154.full).
5. The Cancer Genome Atlas (TCGA) database (http://
www.cbioportal.org/public-portal/).
Statistical analysis
We used logistic regression to estimate the effects of source
(cell line or tumor) and site of disease (oral cavity, pharynx,
and larynx) on mutation frequency. A test of interaction
between source and site was conducted. No interaction was
detected for any gene, thereby prompting tests of main
effects. Significant effects were reported for any genes sat-
isfying a maximum 10% expected false discovery rate. To
tabulate mutations in common, we used a comparison
program, created using Microsoft Excel. The mutations
(nonsynonymous mutation) and gene copy numbers in
HNSCC cell lines were compared with those in HNSCC
tumors side by side by this comparison program. The use of
this comparison program was reported previously (13). The
gene copy-number analysis used log2 ratio as described in ref.
(8). The log2 ratio of normal (copy-neutral) clones is log2
(2/2) ¼ 0, single copy losses is log2(1/2) ¼ À1, and single
copy gains is log2(3/2) ¼ 0.58. The effects of drug treatment
versus dimethyl sulfoxide (DMSO) control was repeated
three times and compared using an unpaired t test with
Welch's correction (P < 0.05 as statistically significant).
Cell cultures
The HNSCC cell lines, CAL-27, and SCC-9 cells were
obtained from the American Type Culture Collection
(ATCC). All cell lines were genotypically verified. HNSCC
cell lines were cultured in the respective culture medium
containing 10% fetal calf serum, 1Â penicillin/streptomycin
solution(Invitrogen): CAL-27 in Dulbecco's Modified Eagle
Medium (DMEM), SCC-9 in DMEM/F12 with 0.4 mg/mL
hydrocortisone (Mediatech, Inc). All cell lines were main-
tained in a humidified cell incubator at 37
C, 5% CO2.
Cloning and mutagenesis
Cloning and mutagenesis were performed as previously
described (13).
Cell transfection and drug treatment
HNSCC cells were plated at 20% confluency in T25 flasks
24 hours before transfection. Then, cells were transfected
with either pMXspuro-PIK3CA wild-type (WT) or pMXs-
puro-PIK3CA mutants (H1047R)usingLipofectamine2000
(Invitrogen) according to the manufacturer's instructions.
Twenty-fourhoursaftertransfection,1Â104
cellswereplated
in48-well culture plates24hours beforedrugtreatment. Cells
were treated with either 2.0 mmol/L or 8.0 m mol/L erlotinib
for 48 hours. MTT assay was performed.
Results
Clinical and pathologic features of HNSCC genotyped
cell lines
Thirty-nine HNSCC cell lines were included in the
reports by Barretina and colleagues and Garnett and
Li et al.
Mol Cancer Res; 12(4) April 2014 Molecular Cancer Research572
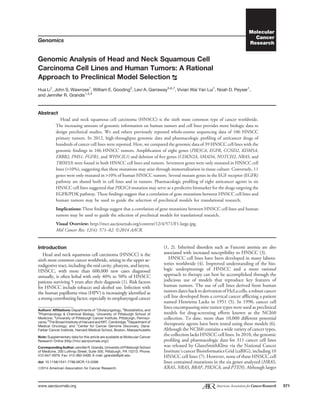
3. colleagues. Eleven cell lines are common to both data sets
while Barretina and colleagues included 30 unique HNSCC
cell lines and Garnett and colleagues reported on 20 addi-
tional HNSCC cell lines (Fig. 1). Clinical and pathologic
information from these 39 HNSCC cell lines is summarized
in Table 1 and Supplementary Table S1. The mean age of
the 28 patients with known age from whom the cell lines
were derived was 58.2 years. Thirty (83% of known gender)
patients were male, 6 (17% of known gender) were female,
and 3 patients have no reported information for sex. The oral
cavity is the most highly represented anatomic tumor site,
accounting for 68% of the cell lines with known primary site.
Pharyngeal tumors account for four (12%) of the cell lines,
six (18%) of the cell lines were derived from the larynx, one
(3%) cell line was from the nasal septum, and the anatomic
site of the remaining five are unknown. Only three cell lines
are reported to be HPV-negative and the remaining cell lines
have no reported HPV status. Given the paucity of con-
firmed HPV-positive HNSCC cell lines, it is likely that none
of the sequenced HNSCC cell lines are derived from HPV-
positive HNSCC (14). Although the clinical and pathologic
information available for the sequenced HNSCC cell lines is
incomplete, the age and male predominance reflects most
HNSCC clinical cohorts. Cell lines are generally derived
from resected tumor specimens. Given the increasing ten-
dency over the past few decades to treat tumors of the
(19)
Garnett et al
(9)
BB30-HNC,
BB49-HNC,
Ca9-22, HN, HO-
1-N-1,
KOSC-2,
LB771-HNC,
RPMI-2650
SAS
BICR6, BICR16 , BICR18,
BICR31, BICR56, HSC-4
PE/CA-PJ15,
PE/CA-PJ34 (Clone C12),
PE/CA-PJ41 (Clone D2),
PE/CA-PJ49, SNU-1041,
SNU-1066, SNU-1076,
SNU-1214, SNU-46,
SNU-899, YD-10B,
YD-38, YD-8
Barretina et al
BHY, CAL-27,
CAL-33, Detroit 562,
FaDu, HSC-2,
HSC-3, SCC-15,
SCC-25, SCC-4,
SCC-9
(11)
Figure 1. Venn diagram of unique and common HNSCC cell lines with
sequence information. Cell lines derived from the squamous mucosal
surfaces of the head and neck (HNSCC) were identified in the Barretina
and colleagues (blue) and/or in Garnett and colleagues (yellow)
databases and identified as unique or overlapping.
Table 1. Clinical and pathologic information for sequenced HNSCC cell lines
Parameters Class Number Proportion of none missing values
Samples in only CCLE 19 48.72
Samples in only Sanger 9 23.08
Samples in both CCLE and Sanger 11 28.21
Total 39 100
Age
50 y 4 14.29
50 and 60 13 46.43
60 and 70 11 39.29
Unknown 11
Gender
Male 30 83.33
Female 6 16.67
Unknown 3
Primary site
Oral cavity 23 67.65
Pharynx 4 11.76
Larynx 6 17.64
Nasal septum 1 2.94
Unknown 5
Tumor grade
Well differentiated 3 21.43
Moderately differentiated 10 71.43
Poorly differentiated 1 7.14
Unknown 25
Tumor type
Primary 7 63.64
Metastatic 3 27.27
Recurrent 1 9.09
Unknown 28
Genomic Analysis of Head and Neck Cancer Cell Lines and Human Tumors
www.aacrjournals.org Mol Cancer Res; 12(4) April 2014 573
4. pharynx and larynx primarily with nonoperative therapy, it is
not surprising that the majority of cell lines are derived from
oral cavity tumors where the primary treatment strategy is
surgical resection. Similarly, because the HPV-HNSCC
tumors are largely pharyngeal (especially tonsil) cancers
(14), the small number of cell lines derived from tumors
arising in the pharynx likely contributes to the limited
availability of HPV-HNSCC cell line models.
Comparison of gene mutations and alterations between
HNSCC cell lines and human tumors
Cancer is thought to arise, at least in part, by the accu-
mulation of genetic mutations, including activating onco-
genes and inactivating tumor-suppressor genes (15–17).
However, the dynamic evolution of mutation calling algo-
rithms and varying approaches between institutions can
limit the ability to compare sequencing results. We first
compared the methods to generate the genetic data including
HNSCC cell line data in these two cancer cell line databases
and HNSCC primary tumor data in the two reported human
cohorts (8–11). All of the studies used Affymetrix SNP6.0
arrays to elucidate genotypes. For sequencing, the cell line
samples in the CCLE and the 74 tumor samples from our
prior study were both performed at the Broad Institute on
Illumina instruments and generated gene profiles using
similar strategies (7, 9). Seventeen tumor samples in the
other human HNSCC cohort were also sequenced using
Illumina, whereas 15 tumor samples were performed by
SOLiD (Table 2; ref. 10). Barretina and colleagues provide
genomic data for 947 cell lines, including gene mutation
status of 1,651 cancer-related genes for 30 HNSCC cell lines
(Table 2). These cell lines harbored 1,637 mutations in 654
genes. Garnett and colleagues reported markedly fewer
mutations for each cell line with 49 mutations in seven
genes as only selected 77 genes were sequenced in their
project. A total of 13 genes were mutated in more than 50%
of the HNSCC cell lines evaluated (Supplementary Table
S2). Human HNSCC tumors from the Stranksy and col-
leagues cohort harbored 7,165 mutations in 4,897 genes,
whereas the human HNSCC tumors in the Agrawal and
colleagues cohort contained 609 mutations in 561 genes.
In an attempt to further determine the potential of
immortalized HNSCC cell lines to reflect the underlying
biology of human HNSCC tumors by gene mutation status,
the mutation rates of specific genes in HNSCC tumors and
cell lines were compared. Here, we analyzed the HNSCC cell
line mutation data from Barretina and colleagues and Gar-
nett and colleagues databases as a cell line panel and the two
human HNSCC tumor cohorts as a human tumor panel. Of
note, 334 genes were found in both HNSCC cell lines
and human tumors, representing 51% of the mutated
genes in HNSCC cell lines (Fig. 2A). The 15 most
commonly mutated genes in HNSCC cell lines are
depicted in Table 3. TP53 is the most commonly mutated
gene both in HNSCC tumors and cell lines [64.2% (68 of
106) of human tumors and 84.6% (33 of 39) of cell lines;
Supplementary Table S3]. We noted that almost all
patient tumors (103 of 106) and most cell lines (33 of
39) are from oral cavity, pharynx, or larynx (Supplemen-
tary Table S4). We analyzed the mutant genes with
frequencies more than 5% in both human HNSCC cell
lines and human tumors from these anatomic sites. The
mutation frequencies were computed and tested for dif-
ferences with logistic regression adjusting for disease site.
The mutation rates of 19 genes were not different in
HNSCC cell lines and primary tumors, whereas four genes
had greater frequency of mutation among the tested cell
lines compared with tumor specimens with an expected
false discovery to 10% or less, including CDKN2A (42%
in cell lines vs. 11% in tumors), FMN2 (30% in cell lines
vs. 6% in tumors), MLL3 (30% in cell lines vs. 6% in
tumors), and TTN (61% in cell lines vs. 28% in
tumors; Fig. 2B and Supplementary Table S5). We further
compared the gene mutation status between the HNSCC
cell lines and tumors according to the primary anatomic
tumor site. There were seven genes with different muta-
tion rates by site, including CSMD3, CUBN, NAV3,
NSD1, PKHD1, TP53, and TTN. TTN was the only
gene with a mutation rate differing by both source cell line
versus human tumor and anatomic site (Supplementary
Fig. S1). There was no interaction between source and
site, indicating that differences in mutation frequency by
site are consistent across source and vice versa.
Some genes, however, were only mutated in HNSCC cell
lines, indicating a discordance between HNSCC human
tumors and cell line models. Seventeen genes mutated in
Table 2. Comparison of sequencing methods in reported HNSCC cell lines and tumors
HNSCC cell line HNSCC tumor
Database Barretina et al Garnett et al Stransky et al Agrawal et al
Sample number 30 20 74 32
SNP determination Affymetrix SNP6.0 Affymetrix SNP6.0 Affymetrix SNP6.0 Affymetrix SNP6.0
Sequencing method Illumina Capillary sequencing Illumina Illumina/SOLiD
Genes for sequencing 1,651 77 Whole-exome Whole-exome
Numbers of mutated genes 654 7 4,897 501
Number of mutations 1,637 49 7,165 609
Li et al.
Mol Cancer Res; 12(4) April 2014 Molecular Cancer Research574
5. more than 10% of HNSCC cell lines were never mutated in
the human tumors (Table 4), whereas 11 genes were only
mutated in human HNSCC tumors with frequencies more
than 10% but never reported in cell lines (Supplementary
Table S6). It is noteworthy that six genes were mutated in
more than 50% of cell lines but never mutated in tumors
including VEGFC, PRKDC, GRIA3, MAML3, GPR112,
and NEK3.
Analysis of DNA copy numbers in HNSCC cell lines
in the two cell lines database revealed 194 amplified genes
(log2 0.58), including 40 genes amplified in more than
50% of HNSCC cell lines, whereas 60 genes were deleted
(log2 À1) in these cell lines. Because the human HNSCC
tumor studies only reported gene copy alterations of 14genes
including 13 amplified genes and one deleted gene, we also
compared the gene copy-number alterations in HNSCC cell
lines and in tumor samples in TCGA (The Cancer Genome
Atlas) cohort. Only eight genes were amplified (PIK3CA,
EGFR, CCND2, KDM5A, ERBB2, PMS1, FGFR1, and
WHSCIL1) and five genes were deleted (CDKN2A,
SMAD4, NOTCH2, NRAS, and TRIM33) in both cell lines
and tumors (Fig. 2C). All of these genes had higher alteration
frequencies in HNSCC cell lines compared with primary
tumors. These cumulative findings suggest that mutations
HNSCC tumors
4,747
HNSCC cells
320
334
BA
Gene
0.0
0.2
0.4
0.6
0.8
ATRX
CASP8
CDKN2A
CSMD3
CUBN
DNAH8
DST
EPHA7
FMN2
HERC2
HRAS
LAMA1
LRP1B
MLL3
NAV3
NOTCH1
NSD1
PCDH15
PIK3CA
PKHD1
RIM
S2
TP53
TTN
Source
Cell line
Tumor
* 42% vs. 11%
* 30% vs. 6% * 30% vs. 6%
* 61% vs. 28%
*, Proportion with mutation in cell lines vs. tumor with FDR £ 10%
Proportionwithmutation
C Amplification
Gene name
%ofSampleswithamplification
PIK
3C
A
EG
FR
C
C
N
D
2
K
D
M
5A
ER
B
B
2
PM
S1
FG
FR
1W
H
SC
1L1
0
20
40
60
80
Cell lines
Tumors
Deletion
Gene name
%ofSampleswithdeletion
C
D
K
N
2A
SM
A
D
4
N
O
TC
H
2
N
R
A
S
TR
IM
33
0
10
20
30
40
50
Cell lines
Tumors
Figure 2. Comparison of gene mutation frequencies and copy numbers between HNSCC cell lines and human tumors. A, Venn diagram of
overlapping mutated genes in HNSCC cell lines (purple) and human tumors (green). Nonsynonymous mutations are defined as all mutations, with the
exception of silent mutations and mutations occurring in the 30
and 50
untranslated regions (UTR). B, comparison of the incidence of mutations in genes
mutated in more than 5% of HNSCC cell lines and tumors derived from larynx, oral cavity, and pharynx sites; Ã
, significantly higher incidence of
mutation in cell lines compared with tumors with false discovery rate (FDR) 10%. C, comparison of the incidence of gene copy-number alterations
in HNSCC cell lines and tumors. Left, incidence of the eight genes amplified both in HNSCC cell lines and tumors. Amplification is defined as
having a log2 value of greater than or equal to 0.58. Right, incidence of the five genes deleted both in HNSCC cell lines and tumors. Deletion is defined
as having a log2 value of less than or equal to À1.
Genomic Analysis of Head and Neck Cancer Cell Lines and Human Tumors
www.aacrjournals.org Mol Cancer Res; 12(4) April 2014 575
6. and gene copy-number alterations exist in HNSCC cell
lines, but not in human tumors, and may result from
selection and/or propagation in tissue culture that does not
reflect critical biologic properties of this cancer. In addition,
tumor cells containing selected HNSCC mutations may not
survive the process of cell line selection and can only be
modeled by cell line engineering.
Mutation of genes in the EGF receptor signaling
pathway
The EGF receptor (EGFR) is a member of the type 1
tyrosine kinase family and is recognized as a key regulator of
cellular differentiation and proliferation by activating down-
stream signal transduction pathways, including the Ras–
Raf–MAPK pathway and phosphatidylinositol-3 kinases
(PI3K). Increased EGFR expression, by gene amplification
and transcriptional activation, is one of the most frequent
alterations found in HNSCC in which EGFR has been
identified as a prognostic biomarker and molecular thera-
peutic target (18). Although EGFR overexpression is one of
the most common alterations found in HNSCC, the inci-
dence of EGFR mutations in HNSCC is negligible (19, 20).
We defined the EGFR pathway and found 10 genes in the
pathway mutated in both HNSCC cell lines and human
tumors (Fig. 3). Genes in the Ras–Raf–MAPK pathway,
including HRAS, KRAS, RAF1, and MAPK1 (ERK1) were
mutated both in HNSCC cell lines and tumors, whereas N-
RAS and MAP2K1 (MEK1) were only mutated in HNSCC
cell lines and B-RAF was only mutated in HNSCC tumors.
In the PI3K pathway, GAB1, PI3K p110 subunits (PIK3CA,
PIK3CD, and PIK3CG), three MAP3Ks (MAP3K3,
MAP3K4, and MAP3K6), and MAP2K4 (MEK4) were
mutated in both cell lines and tumors, whereas MAPK8
(JNK1) was only mutated in HNSCC cell lines and MAPK9
(JNK2) mutations were restricted to HNSCC tumors.
STAT1 was mutated both in HNSCC tumors and cell lines,
whereas STAT3 mutation was only found in HNSCC
tumors (Supplementary Table S7). These results suggest
that mutations of genes in the EGFR signaling pathway may
Table 3. Commonly mutated cancer-related genes in HNSCC cell lines
TP53
PIK3CA
SMAD4
CDKN2a(p14)
CDKN2A
CASP8
DICER1
NF1
HRAS
APC
NOTCH1
NOTCH2
PTEN
RIPK4
TP63
% of Gene mutation
0
20
40
60
80
BB30-HNC BHY BICR16 BICR31 BICR56 BICR6 Ca9-22 CAL27 CAL33
DETROIT562 FaDU HN HO-1-N-1 HSC2 HSC3 HSC4 KOSC-2 LB771-HNC
PECAPJ15 PECAPJ34CLONEC12 PECAPJ41CLONED2 SAS SCC15
SCC25 SCC4 SCC-9 SNU1066 SNU1214 SNU46 YD10B YD38
BB49-HNC BHY CAL-27 CAL-33 Detroit562 FaDU HN HSC2 HSC3 HSC4
KOSC-2 LB771-HNC SCC-25 SCC-4 SCC-9 SNU1214 YD10B
BB49-HNC HSC-2 KOSC-2 LB771-HNC Detroit562 HN SCC-9 SCC-25
BB30-HNC BICR31 CAL27 CAL33 FaDU HSC3 PECAPJ34CLONEC12
CAL33 DETROIT562 HSC-2 SNU-1076
SCC4 SCC9 YD10B YD8
BICR18 SNU1066 SNU1076 YD38
CAL27 CAL33 HSC2 HSC3
BICR6 HSC4 PECAPJ15
BICR56 PECAPJ49 HSC3
SCC9 BB49-HNC
HSC2
SNU899
HSC4
Table 4. Genes mutated in 10% of HNSCC cell
lines but not mutated in human HNSCC tumors
Gene name
Number of cell
lines with mutation
Mutation
frequency (%)
VEGFC 31 79.49
PRKDC 30 76.92
GRIA3 30 76.92
MAML3 27 69.23
GPR112 23 58.97
NEK3 22 56.41
MAP3K1 18 46.15
MYST4 15 38.46
AKAP9 10 25.64
HSP90B1 9 23.08
CHD1 8 20.51
CDKN2a(p14) 6 15.38
RBPJ 5 12.82
PCSK7 4 10.26
MLL 4 10.26
TOP2B 4 10.26
KDM6A 4 10.26
Li et al.
Mol Cancer Res; 12(4) April 2014 Molecular Cancer Research576
7. contribute to HNSCC either in tumorigenesis or tumor
growth despite the paucity of EGFR mutations.
Pharmacologic profiling of HNSCC cell lines
Six agents have been U.S. Food and Drug Administration
(FDA)–approved for the treatment of HNSCC, including
methotrexate (approved in 1956), 5-FU (5-fluorouracil;
approved in 1957), bleomycin (approved in 1973 and rarely
used in modern oncology), cisplatin (approved in 1978), and
docetaxel and cetuximab (both approved in 2006). Six
HNSCC cell lines were included in the pharmacologic
profiling in the Barretina and colleagues database, including
Cal 27, Detroit 562, FaDu, HSC-2, SCC9, and SCC25
using 24 chemotherapy and molecular-targeting agents (8).
We analyzed the responses of these HNSCC cell lines to the
24 compounds by the activity area (defined as the area
between the pharmacologic dose–response curve and a fixed
reference Aref ¼ 0. Using the fixed reference, activity area ¼ 0
corresponds to an inactive compound; ref. 8). Paclitaxel
(targeting TUBB1), panobinostat (targeting HDAC), 17-
AAG (targeting HSP90), and irinotecan (targeting TOP2)
most potently inhibited the growth of HNSCC cell lines.
However, HNSCC cell lines were resistant to PLX4720
(targeting BRAF), PF2341066 (targeting c-MET), PD-
0332991 (targeting CDK4), sorafenib (a multikinase inhib-
itor), nultin-3 (targeting MDM2), and L-685458 (targeting
Gamma Secretase; Fig. 4A). Compared with cell lines
derived from other organ sites, HNSCC cell lines were
significantly more sensitive to the EGFR tyrosine kinase
inhibitor (TKI) erlotinib (P ¼ 0.002). The pharmacologic
data in Garnett and colleagues cohort also confirmed this
finding. We then further analyzed the drug responses of
these six HNSCC cell lines to EGFR inhibitors. Among the
six HNSCC cell lines tested, HSC-2 and Detroit 562,
derived from tumors of the oral cavity and pharynx, respec-
tively, were resistant to the five compounds including
AZD0530 (targeting Src family kinases), erlotinib (targeting
EGFR), lapatinib (targeting HER2 and EGFR), TKI 258
(targeting EGFR), and ZD-6474 [targeting EGFR and
VEGFR (VEGF receptor); Fig. 4B]. To determine the
Cell proliferation, cycle, death, and inflammation
EGF
EGFR
PLCg
DAG
PKC
IKK
P
RAS
Raf
MEK1
ERK1
PI3K
p85
AKT
mTOR
MAP3Ks
MEK4
JNKs
GAB1
Rac1
ERK2
MEK2 MEK7
PI3K
p110a
JAK
1/2
Stat3
P
Stat1
P
Stat3
P
Stat3
P Stat1
P
Stat1
P
No mutation found
Mutation both in
cell line and tumor
Mutation in tumor
Mutation in cell line
Figure 3. Genes mutated in EGFR signaling pathways in HNSCC cell lines and/or tumors. Unfilled circle indicates that the gene is not mutated in either HNSCC
cell lines or humantumors. Red represents a gene that is mutated both in tumors and cell lines. Green indicates a gene that is mutated only in tumors and yellow
denotes a gene that is only mutated in cell lines.
Genomic Analysis of Head and Neck Cancer Cell Lines and Human Tumors
www.aacrjournals.org Mol Cancer Res; 12(4) April 2014 577
8. correlation between gene mutations and drug sensitivity, we
compared the genomic profile of HSC-2 and Detroit 562
with the other four HNSCC cell lines profiled. Interestingly,
PIK3CA was only mutated in HSC-2 and Detroit 562 cell
lines, whereas the other four cell lines harbored WT
PIK3CA. To determine if PIK3CA mutation contributes to
sensitivity to EGFR-targeting agents, we introduced a
PIK3CA mutation (H1047R) or WT PIK3CA into Cal
27 and SCC9 cells that harbor WT PIK3CA and assessed
the impact of PIK3CA mutation on drug sensitivity. Cal 27
and SCC9-expressing mutant (H1047R) or WT PIK3CA
were treated with erlotinib. Both Cal 27 and SCC9-expres-
sing mutant PIK3CA were significantly more resistant
to erlotinib treatment at both concentrations tested, com-
paring with isogenic cells expressing WT PIK3CA (Fig. 4C).
These results indicate that PIK3CA mutation might serve as
a negative predictive biomarker for erlotinib in HNSCC,
indicating that the mutational status of PIK3CA may be
used to select preclinical models for response to EGFR
TKI.
Discussion
Human tumor-derived cell lines serve as important pre-
clinical models to identify therapeutic targets and mechan-
isms of anticancer agents for translational studies. The first
high-throughput cancer cell line screening program was the
NCI60platform, which led to the development of many new
technologies for drug screening from 1984 to 2005 (18).
However, this platform is limited by the lack of represen-
tation of cell lines derived from a number of human tumors,
including HNSCC. The reduced cost of gene sequencing in
conjunction with the efforts of TCGA and other groups has
led to the increased availability of mutation data linked to
human cancer cell lines and patient tumors. In addition, the
large number of molecular-targeting agents in clinical devel-
opment underscores the need to link baseline tumor cell
characteristics to drug responses to improve treatment selec-
tion. The Cancer Cell line Project at the Wellcome Trust's
Sanger Institute is well known for resequencing the most
common cancer-associated genes in human tumor-derived
cell lines, and 77 genes in 770 cancer cell lines have been
resequenced in this project to date. The CCLE project at the
Broad Institute generated genomic profiles including a
compilation of gene expression, chromosomal copy number,
and massively parallel sequencing data from 947 human
cancer cell lines with pharmacologic profiles for 24 antican-
cer drugs across 479 of the lines (8). Matching normal
genomic DNA is rarely, if ever, available for cell lines as
most established cell lines have been in culture for many
years and the paired normal material is not available. None of
the sequencing results to date on HNSCC cell lines have
used matched normal DNA. In the CCLE project, gene
mutations were evaluated in conjunction with dbSNP134
or allele frequency in the National Heart, Lung, and Blood
Institute Exome Sequencing Project or 1000 Genomes
Project to exclude common germline variants (8). There
were 1,147 gene mutation sites found in HNSCC cell lines
0
1
2
3
4
5
6
Activearea
Drug
All cell lines
HNSCC cell lines
A
B
Drugs
Activityarea
AZD0530 Erlotinib Lapatinib TKI 258 ZD-6474
0
1
2
3
4 CAL 27
Detroit562
HSC-2
FaDu
SCC-25
SCC-9
P = 0.0218
P = 0.9824
P = 0.0379
P = 0.6023
P = 0.0399
P = 0.3039
P = 0.0375
P = 0.9496
C
Drugs
Cellgrowthinhibition(%)
VEH Erlotinib 2.5 mmol/L Erlotinib 8.0 mmol/L
0
10
20
30 CAL 27
CAL 27 PIK3CA WT
CAL27 PIK3CA MT(H1047R)
SCC9
SCC9 PIK3CA WT
SCC9 PIK3CA MT(H1047R)
Paclitaxel
Panobinostat
17-A
A
G
Irinotecan
PLX4720
Topotecan
PH
A
-665752
PD
-0325901
PF2341066
PD
-0332991
TK
I258
TA
E684
R
A
F265
Sorafenib
A
ZD
6244
ZD
-6474
A
EW
541
A
ZD
0530
LB
W
242
Lapatinib
N
ilotinib
Erlotinib
N
utlin-3
L-685458
Figure 4. The pharmacologic sensitivities of HNSCC cell lines. A, drug
activity areas were compared between HNSCC cell lines with all cancer
cell lines in CCLE. B, drug response of HNSCC cell lines for EGFR
pathway inhibitors AZD0530, erlotinib, lapatinib, TKI 258, and ZD-6474
as measured by the activity area. Middle bar, median; black, Cal 27;
green, Detroit 562; blue: FaDu; red, HSC-2; yellow, SCC-25; purple, SCC-
9. C, expression of a PIK3CA mutation (H1047R) reduces sensitivity to
erlotinib in Cal 27 and SCC 9 cells. PIK3CA mutant (H1047R) or WT
PIK3CA were introduced into Cal27 and SCC9 cells followed by
treatment with either of two concentrations of erlotinib (2.5 or 8.0 mmol/L)
for 48 hours. Cell survival was measured by the MTT assay. P values were
calculated using an unpaired t test with Welch's correction. The
experiments were repeated three times with similar results.
Li et al.
Mol Cancer Res; 12(4) April 2014 Molecular Cancer Research578
9. in CCLE, only 72 of which were reported single-nucleotide
polymorphisms (SNP) according to dbSNP134 and the
1000 Genomes Project. Although not all of the mutations
found in HNSCC cells represent somatic changes, such large
annotated cell line collections can still be used to facilitate
preclinical stratification for anticancer agent testing. To date,
the genomic data from HNSCC cell lines and human tumors
have not been linked to allow investigators to rationally select
preclinical models for translational studies. The present
study was undertaken in an attempt to address this gap in
knowledge.
Genetic profiling of large cell line panels has been used
to determine correlations between tumor and cell lines in
other cancers. Neve and colleagues showed that 51 breast
cancer cell lines display the same heterogeneity in copy
number and gene expression as 145 primary subtype
tumors. These breast cancer cell lines harbored most of
the recurrent genomic abnormalities associated with clin-
ical outcome in primary tumors (21). Lin and colleagues
reported that cultured melanoma cells encompass the
spectrum of significant genomic alterations present in
primary tumors (22). Although both of these prior reports
suggested that cell lines could mirror primary tumors from
the corresponding tumor type by genomic copy number
and transcriptional profiles for the cell lines with primary
tumors, gene mutations were not compared. In the present
study, we analyzed the correlation of mutations in 39
HNSCC cell lines and 106 human tumors. Our results
suggest that the mutated genes in HNSCC cell lines can
reflect many, but not all, of the mutated genes in HNSCC
primary tumors. Of note, 51% (334) of mutated genes
were detected in both HNSCC cell lines and primary
human HNSCC tumors, and 83% (19 of the 23 genes) of
genes with mutation frequencies more than 5% in cell
lines have similar mutation frequencies in primary tumors.
Even in a specific signaling pathway such as the EGFR
pathway, the mutations in cell lines mirror most of the
mutations in human tumors. These findings suggest that
genes commonly mutated in HNSCC tumors are gener-
ally reflected in cell line models.
Our results indicate some discordance between mutations
in HNSCC cell lines and tumors including genes, which had
higher mutation frequencies in cell lines and genes that were
mutated only in cell lines, but not in tumors. In breast
cancer, cell lines were reported to harbor more genetic
aberrations and high-level amplifications than primary
tumors (23). Ross and colleagues analyzed the variation in
expression of approximately 8,000 unique genes among the
NCI60 cell lines and found that genes involved in prolif-
eration were generally upregulated in cell lines (24). Others
have reported that expression of p16INK4a
steadily increases
in culture epithelial cells immortalized by telomerase, where-
as loss of p16INK4a
expression is common in human cancers
that are derived from epithelia (25, 26). It has been postu-
lated that high-level gene amplification may provide a
selective advantage for growth in vitro (22). Our analysis
showed that many genes have higher mutation frequencies in
HNSCC cell lines and 17 genes that are mutated only in
HNSCC cell lines by more than 10%. We further extended
our analysis to check these genes' mutation status in TCGA.
There are 308 HNSCC tumor samples contained in the
recently published TCGA, much more than the Stransky
and colleagues and Agrawal and colleagues cohorts. Overall,
the comparison yielded results consistent with our previous
comparisons. Although the genes that had previously
believed to be mutated exclusively in cell lines were also
found to be mutated in TCGA tumor samples, they were
found at frequencies far below their incidence in cell lines.
For example, VEGFC is mutated in the majority of
HNSCC cell lines (79.5%) but never in human HNSCC
tumors in the Stransky and colleagues and Agrawal and
colleagues cohorts. Although VEGFC is found to be
mutated in TCGA, the mutation frequency is still less
than 1% of the 308 tumors contained in this database.
VEGFC is a member of the VEGF family and it plays an
important role in lymphangiogenesis and angiogenesis in
embryos and tumors. It enhances cancer cell mobility and
invasiveness and contributes to the promotion of cancer
cell metastasis by activating Fit-4. VEGFC overexpression
in the lung cancer cell line H928 induces cell migration
and invasion through the p38 mitogen—activated protein
kinase (MAPK) pathway (27). It was reported by Benke
and colleagues that forced expression of VEGFC in
HNSCC HN4 cells with low endogenous CXCL5 levels
increased cell growth and suppression of VEGFC-inhib-
ited migration of HNSCC HN12 cells (28). Although the
functional consequences of VEGFC mutations are incom-
pletely understood, the mutations of this gene, found
uniquely in HNSCC cell lines, may represent an artifact
of the culture process. It suggested that these genes, which
just found mutated or have much higher mutation fre-
quencies in HNSCC cell lines might be acquired through
the immortalization process.
EGFR is a type 1 receptor tyrosine kinase and contributes
to cell growth, development, and differentiation. EGFR is
expressed in most epithelial tissues but is upregulated in
many epithelial malignancies including HNSCC in which
overexpression compared with corresponding normal tis-
sues has been reported in 80% to 90% of cases (29).
Gandhi and colleagues analyzed the alterations of genes in
the EGFR signaling pathway in 77 non–small cell lung
cancer cell lines and copy-number gains were frequent
(10%) for EGFR, HER2, HER3, and KRAS (30). We
found four genes in the EGFR pathway in HNSCC cell
lines, which were amplified with the frequencies 10%,
including PIK3CA, EGFR, ERBB2, and AKT 1. PIK3CA
and EGFR were also found to be amplified in HNSCC
tumors in primary HNSCC tumors. We and others have
reported that EGFR gene amplification contributes to
EGFR overexpression in HNSCC (31). PIK3CA ampli-
fication has also been found more frequently in HPV-
positive HNSCC compared with HPV-negative tumors
(13). In addition to gene amplification, 12 genes in the
EGFR signaling pathway were mutated in both HNSCC
cell lines and human tumors, including PIK3CA, RAS,
RAF, STAT1, MAP3Ks, and MAP2K4. This finding
Genomic Analysis of Head and Neck Cancer Cell Lines and Human Tumors
www.aacrjournals.org Mol Cancer Res; 12(4) April 2014 579
10. suggests that genetic alteration of the components of the
EGFR signaling pathway in HNSCC cell lines may reflect
genetic alterations in primary HNSCC tumors.
A new generation of anticancer drugs with molecular
targets has emerged as potent therapeutic agents. The EGFR
signaling pathway has been implicated in HNSCC biology.
Many agents inhibiting EGFR or components of the EGFR
pathway have been FDA-approved for cancer treatment. In
the CCLE pharmacologic profiling, six HNSCC cell lines
were treated by seven agents targeting EGFR. HSC-2 and
Detroit 562 cell lines, both of which harbor mutant PIK3CA
(H1047R), were relatively resistant to seven EGFR pathway
inhibitors compared with the other four HNSCC cell lines
with WT PIK3CA. PIK3CA is the p110a catalytic subunit
of the class IA PI3K and can be activated by growth factor
receptor tyrosine kinases, including EGFR (32). We recently
reported that genes in the PI3K pathway represent the most
common alterations in HNSCC (13). In the present study,
we analyzed PI3K pathway mutations in HNSCC cell lines
and tumors. Eight genes in the PI3K pathway were found to
be mutated both in cell lines and tumors, whereas four genes
were only mutated in cell lines and four other genes were
only reportedly mutated in tumors (Table 5). We also found
that PIK3CA is the most commonly mutated gene in this
pathway in HNSCC tumors (13). All of the PIK3CA
mutants tested enhancedcell growth, andcell lines harboring
endogenous PIK3CA (H1047R) mutations demonstrated
increased sensitivity to PI3K pathway inhibition using a
mTOR/PI3K–targeted agent (BEZ-235) in vitro and in vivo.
Both HPV-positive and HPV-negative PIK3CA-mutated
patient tumorgrafts were significantly more sensitive
to BEZ-235 in vivo compared with tumors containing WT
PIK3CA. Inhibition of tumor growth was accompanied
by decreased PI3K signaling, as demonstrated by
Table 5. PI3K pathway mutations in HNSCC cell lines and tumors
Gene name Cell line/site Tumor/site
MTOR BICR18/p.V1692A HN_62421/p.L2260H HN_62469/p.R1161Q
PIK3CA CAL33/p.H1047R DETROIT562/p.H1047R
HSC2/p.H1047R SNU1076/p.H1047R
HN_62415/p.E545G HN_62426/p.E545K
HN_62469/p.H1047R HN_62825/p.R115L
HN_63027/p.E542K HN_63039/p.H1047L
HN11PT/p.H1047R HN41PT/p.H1047L 325/p.H1047L
PIK3CD SNU1076/p.L558V HN_62672/p.T423S
PIK3CG CAL27/p.R178C SNU1041/p.A197T
SNU899/p.R366G p.H577Y
HN_01000/p.R1021S HN_62532/p.L843H
HN_62854/p.S446F
HN_63021/p.P526S HN22PT/p.G491E
PIK3C2A BICR6/p.M1577V YD38/p.A1649V HN_62699/c.e6_splice_site
PIK3C2B SNU899/p.R1610H HN_62739/p.R564C
PIK3C2G BHY/p.P129del BICR16/p.P129del HN_00190/p.V656L
BICR18/p.P129del BICR6/p.P129del
BICR56/p.H1304R DETROIT562/p.P129del
PECAPJ15/p.P129del PECAPJ49/p.P129del
PECAPJ41CLONED2/p.P129del
HSC2/p.P129del HSC4/p.P129del
SCC15/p.P129del SNU1041/p.K714N
SNU46 /p.E1301D
YD8/p.P129del YD38/p.K70R YD38/p.P129del
PIK3R1 HN_00361/p.453_454insN HN_62338/p.I290V
HN_62421/p.D560H
PIK3R4 BICR56/p.574_575NDKY
SCC25/p.E529_splice YD10B/p.A968D
PIK3R6 HN_62860/p.R483H
PTEN HSC4/p.C136W p.V343_splice HN_00190/p.D92E HN_62652/c.e7_splice_site
HN_62741/p.D252Y HN_62863/p.P246L
HN_63039/p.R335Ã
PDK1 BICR18/p.P283T
PIK3AP1 HN_62506/p.A136D HN22PT/p.G313R
91/p.R478Q 266/p.T352S
PIK3C3 SNU1066/p.R162K
TSC1 HN_00761/p.R245Ã
TSC2 PECAPJ49/p.R1268C
Li et al.
Mol Cancer Res; 12(4) April 2014 Molecular Cancer Research580
11. downregulation of p-AKT (S473) and p-S6(S235/236) in
the BEZ-235–treated tumors. PIK3CA mutants have been
reported to contribute to drug resistance in other cancers but
have not been studied to date in HNSCC cell line models.
Berns and colleagues reported that the oncogenic PIK3CA
mutant (H1047R) contributed to trastuzumab resistance in
breast cancer cell lines. The presence of PIK3CA mutations
or low PTEN expression was associated with poor prognosis
after trastuzumab therapy in patients with breast cancer (33).
The PIK3CA mutant colorectal cancer cell line HCT116was
more resistant to EGFR-targeted monoclonal antibodies
compared with PIK3CA WT controls (34, 35). In RAS
mutant cancer cells, activating PIK3CA mutations could
reduce the sensitivity to MEK inhibition (36). Two recent
studies found that EGFR TKIs were relatively inactive in
unselected HNSCC populations (37). HSC-2 and Detroit
562 cell lines were less sensitive to BRAF inhibitor RAF265
and MEK inhibitors AZD6244 and PD-0325901 in the
CCLE report (8). These cumulative findings suggest that
identification of individuals whose tumors harbor mutant
PIK3CA may identify a subgroup of patients who may not be
responsive to EGFR targeting and underscore the value of
rational cell line model selection to guide the choice of
therapies in the clinic.
Disclosure of Potential Conflicts of Interest
L.A. Garraway received commercial research grant from Novartis, has ownership
interest (including patents) in Foundation Medicine, and is consultant/advisory board
member of Foundation Medicine, Novartis, Boehringer Ingelheim, Millennium
Pharmaceuticals, and Onyx Pharmaceuticals. V.W.Y. Lui received other commercial
research support from Novartis. No potential conflicts of interest were disclosed by the
other authors.
Authors' Contributions
Conception and design: H. Li, J.R. Grandis
Development of methodology: H. Li
Acquisition of data (provided animals, acquired and managed patients, provided
facilities, etc.): H. Li, J.R. Grandis
Analysis and interpretation of data (e.g., statistical analysis, biostatistics, compu-
tational analysis): H. Li, J.S. Wawrose, W.E. Gooding, L.A. Garraway, N.D. Peyser,
J.R. Grandis
Writing, review, and/or revision of the manuscript: H. Li, J.S. Wawrose,
W.E. Gooding, V.W.Y. Lui, J.R. Grandis
Administrative, technical, or material support (i.e., reporting or organizing data,
constructing databases): H. Li, J.S. Wawrose
Study supervision: J.R. Grandis
Grant Support
This study was funded by grants NIH P50CA097190, R01CA77308, and
R01CA098372 and the American Cancer Society (to J.R. Grandis).
The costs of publication of this article were defrayed in part by the payment of page
charges. This article must therefore be hereby marked advertisement in accordance with
18 U.S.C. Section 1734 solely to indicate this fact.
Received July 26, 2013; revised October 15, 2013; accepted December 5, 2013;
published OnlineFirst January 14, 2014.
References
1. Leemans CR, Braakhuis BJ, Brakenhoff RH. The molecular biology of
head and neck cancer. Nat Rev Cancer 2011;11:9–22.
2. Rothenberg SM, Ellisen LW. The molecular pathogenesis of head
and neck squamous cell carcinoma. J Clin Invest 2012;122:
1951–7.
3. Kutler DI, Auerbach AD, Satagopan J, Giampietro PF, Batish SD,
Huvos AG, et al. High incidence of head and neck squamous cell
carcinoma in patients with Fanconi anemia. Arch Otolaryngol Head
Neck Surg 2003;129:106–12.
4. Zhao M, Sano D, Pickering CR, Jasser SA, Henderson YC, Clayman
GL, et al. Assembly and initial characterization of a panel of 85
genomically validated cell lines from diverse head and neck tumor
sites. Clin Cancer Res 2011;17:7248–64.
5. Scherer WF, Syverton JT, Gey GO. Studies on the propagation in vitro
of poliomyelitis viruses. J Exp Med 1953;97:695–710.
6. Shoemaker RH. The NCI60 human tumour cell line anticancer drug
screen. Nat Rev Cancer 2006;6:813–23.
7. Caponigro G, Sellers WR. Advances in the preclinical testing of
cancer therapeutic hypotheses. Nat Rev Drug Discov 2011;10:
179–87.
8. Barretina J, Caponigro G, Stransky N, Venkatesan K, Margolin AA,
Kim S, et al. The Cancer Cell Line Encyclopedia enables predictive
modelling of anticancer drug sensitivity. Nature 2012;483:
603–7.
9. Garnett MJ, Edelman EJ, Heidorn SJ, Greenman CD, Dastur A, Lau
KW, et al. Systematic identification of genomic markers of drug
sensitivity in cancer cells. Nature 2012;483:570–7.
10. Stransky N, Egloff AM, Tward AD, Kostic AD, Cibulskis K, Sivachenko
A, et al. The mutational landscape of head and neck squamous cell
carcinoma. Science 2011;333:1157–60.
11. Agrawal N, Frederick MJ, Pickering CR, Bettegowda C, Chang K, Li
RJ, et al. Exome sequencing of head and neck squamous cell
carcinoma reveals inactivating mutations in NOTCH1. Science
2011;333:1154–7.
12. You JS, Jones PA. Cancer genetics and epigenetics: two sides of the
same coin? Cancer Cell 2012;22:9–20.
13. Lui VW, Hedberg ML, Li H, Vangara BS, Pendleton K, Zeng Y, et al.
Frequent mutation of the PI3K pathway in head and neck cancer
defines predictive biomarkers. Cancer Discov 2013;3:761–9.
14. Hanahan D, Weinberg RA. Hallmarks of cancer: the next generation.
Cell 2011;144:646–74.
15. Davies H, Bignell GR, Cox C, Stephens P, Edkins S, Clegg S, et al.
Mutations of the BRAF gene in human cancer. Nature 2002;417:
949–54.
16. Knudson AG Jr. Mutation and cancer: statistical study of retinoblas-
toma. Proc Natl Acad Sci U S A 1971;68:820–3.
17. VogelsteinB, Kinzler KW. The multistep nature of cancer. Trends Genet
1993;9:138–41.
18. Diniz-Freitas M, García-Caballero T, Antunez-Lopez J, Gandara-Rey
JM, García-García A. Pharmacodiagnostic evaluation of EGFR expres-
sion in oral squamous cell carcinoma. Oral Dis 2007;13:285–90.
19. Greshock J, Bachman KE, Degenhardt YY, Jing J, Wen YH, Eastman S,
et al. Molecular target class is predictive of in vitro response profile.
Cancer Res 2010;70:3677–86.
20. Williams M. Integration of biomarkers including molecular targeted
therapies in head and neck cancer. Head Neck Pathol 2010;4:62–9.
21. Neve RM, Chin K, Fridlyand J, Yeh J, Baehner FL, Fevr T, et al.
A collection of breast cancer cell lines for the study of functionally
distinct cancer subtypes. Cancer Cell 2006;10:515–27.
22. Lin WM, Baker AC, Beroukhim R, Winckler W, Feng W, Marmion JM,
et al. Modeling genomic diversity and tumor dependency in malignant
melanoma. Cancer Res 2008;68:664–73.
23. Jeffrey SS, Lonning PE, Hillner BE. Genomics-based prognosis and
therapeutic prediction in breast cancer. J Natl Compr Canc Netw
2005;3:291–300.
24. Ross DT, Scherf U, Eisen MB, Perou CM, Rees C, Spellman P, et al.
Systematic variation in gene expression patterns in human cancer cell
lines. Nat Genet 2000;24:227–35.
25. Harada H, Nakagawa H, Oyama K, Takaoka M, Andl CD, Jacobmeier
B, et al. Telomerase induces immortalization of human esophageal
keratinocytes without p16INK4a inactivation. Mol Cancer Res 2003;
1:729–38.
Genomic Analysis of Head and Neck Cancer Cell Lines and Human Tumors
www.aacrjournals.org Mol Cancer Res; 12(4) April 2014 581
12. 26. Farwell DG, Shera KA, Koop JI, Bonnet GA, Matthews CP, Reuther
GW, et al. Genetic and epigenetic changes in human epithelial
cells immortalized by telomerase. Am J Pathol 2000;156:
1537–47.
27. Su JL, Yang PC, Shih JY, Yang CY, Wei LH, Hsieh CY, et al. The VEGF-
C/Flt-4 axis promotes invasion and metastasis of cancer cells. Cancer
Cell 2006;9:209–23.
28. Benke EM, Ji Y, Patel V, Wang H, Miyazaki H, Yeudall WA. VEGF-C
contributes to head and neck squamous cell carcinoma growth and
motility. Oral Oncol 2010;46:e19–24.
29. Sharma SV, Haber DA, Settleman Jeff. Cell line-based platforms to
evaluate the therapeutic efficacy of candidate anticancer agents. Nat
Rev 2010;10:241—53.
30. Gandhi J, Zhang J, Xie Y, Soh J, Shigematsu H, Zhang W, et al.
Alterations in genes of the EGFR signaling pathway and their relation-
ship to EGFR tyrosine kinase inhibitor sensitivity in lung cancer cell
lines. PLoS ONE 2009;4:e4576.
31. Wheeler S, Siwak DR, Chai R, LaValle C, Seethala RR, Wang L, et al.
Tumor epidermal growth factor receptor and EGFR PY1068 are inde-
pendent prognostic indicators for head and neck squamous cell
carcinoma. Clin Cancer Res 2012;18:2278–89.
32. Samuels Y, Diaz LA Jr, Schmidt-Kittler O, Cummins JM, Delong L,
Cheong I, et al. Mutant PIK3CA promotes cell growth and invasion of
human cancer cells. Cancer Cell 2005;7:561–73.
33. Berns K, Horlings HM, Hennessy BT, Madiredjo M, Hijmans EM,
Beelen K, et al. A functional genetic approach identifies the PI3K
pathway as a major determinant of trastuzumab resistance in breast
cancer. Cancer Cell 2007;12:395–402.
34. Jhawer M, Goel S, Wilson AJ, Montagna C, Ling YH, Byun DS, et al.
PIK3CA mutation/PTEN expression status predicts response of colon
cancer cells to the epidermal growth factor receptor inhibitor cetux-
imab. Cancer Res 2008;68:1953–61.
35. Sartore-Bianchi A, Martini M, Molinari F, Veronese S, Nichelatti M,
Artale S, et al. PIK3CA mutations in colorectal cancer are associated
with clinical resistance to EGFR-targeted monoclonal antibodies.
Cancer Res 2009;69:1851–7.
36. Wee S, Jagani Z, Xiang KX, Loo A, Dorsch M, Yao YM, et al. PI3K
pathway activation mediates resistance to MEK inhibitors in KRAS
mutant cancers. Cancer Res 2009;69:4286–93.
37. Hansen AR, Siu LL. Epidermal growth factor receptor targeting in head
and neck cancer: have we been just skimming the surface? J Clin
Oncol 2013;31:1381–3.
Li et al.
Mol Cancer Res; 12(4) April 2014 Molecular Cancer Research582