SlideShare ist ein Scribd-Unternehmen logo
1 von 7
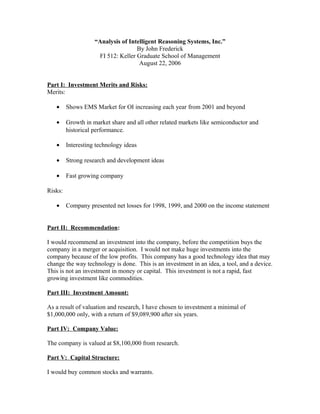
“Analysis of Intelligent Reasoning Systems, Inc.”
By John Frederick
FI 512: Keller Graduate School of Management
August 22, 2006
Part I: Investment Merits and Risks:
Merits:
• Shows EMS Market for OI increasing each year from 2001 and beyond
• Growth in market share and all other related markets like semiconductor and
historical performance.
• Interesting technology ideas
• Strong research and development ideas
• Fast growing company
Risks:
• Company presented net losses for 1998, 1999, and 2000 on the income statement
Part II: Recommendation:
I would recommend an investment into the company, before the competition buys the
company in a merger or acquisition. I would not make huge investments into the
company because of the low profits. This company has a good technology idea that may
change the way technology is done. This is an investment in an idea, a tool, and a device.
This is not an investment in money or capital. This investment is not a rapid, fast
growing investment like commodities.
Part III: Investment Amount:
As a result of valuation and research, I have chosen to investment a minimal of
$1,000,000 only, with a return of $9,089,900 after six years.
Part IV: Company Value:
The company is valued at $8,100,000 from research.
Part V: Capital Structure:
I would buy common stocks and warrants.
Income Statement
CAGR 53% 55% 43% 36%
2001 2002 2003 2004 2005
Rev. 520 590 670 759 998
COGS 506.8 542.7 542.9 469.4 545.9
Gross Profit 13.2 68.2 19.1 137.8 212.4
EBITDA 2.2 20.9 63.9 151.8 239.7
Operating Income 3,411 5,287 7,560 10,281 13,982
Int. Exp -206 -319 -456 -620 -843
Pre-Tax 3,617 4,968 7,104 9,661 13,139
Net Income 3,617 4,968 7,104 9,661 13,139
Balance Sheet
CAGR 53% 55% 43% 36%
2001 2002 2003 2004 2005
Assets
Cash & Cash Equ 10,986 16,808 26,052 37,254 50,665
A/R 6,397 9,787 15,169 21,691 29,499
Inventory 10,480 16,034 24,852 35,538 48,331
Other C.A. 97 148 229 327 444
Total C.A. 27,959 42,777 66,304 94,810 128,941
Net PP&E 3,014 4,611 7,147 10,220 13,899
Other Assets 512 783 1,213 1,734 2,358
Total Assets 31,485 32,671 50,640 72,415 98,484
Liab & Equity
Bank Revolver 0 0 0 0 0
A/P 4,091 6,259 9,701 13,872 18,865
Bank facility
Other C.L. 5,400 8,262 4,544 6,497 8,835
Total C.L. 9,491 14,521 22,507 32,185 43,771
Notes Payable
Other L-T Liab
Sub Convert N/P
Existing Sr Debt 640 979 1,517 2,169 2,949
Total Liab 10,131 15,500 24,024 34,354 46,721
Existing Pf stock 24,794 37,934 58,797 84,079 114,347
Common Equity -3,440 -5,263 -8,157 -11,664 -15,863
Total Liab & Eq 31,485 32,671 50,640 72,415 98,484
Cash Flow
CAGR 53% 55% 43% 36%
2001 2002 2003 2004 2005
CFO
Net Income 3,617 4,968 7,104 9,661 13,139
Adj to Net Income
Dep Exp 1,116 1,707 2,441 3,319 4,513
Prepaid
Accr Liab
Inventory -10,480 -16,034 -24,852 -35,538 -48,331
A/P -4,091 -6,259 -9,701 -13,872 -18,865
A/R 6,397 9,787 15,169 21,691 29,499
Total -7,058 -10,799 -16,943 -24,400 -33,184
Net CFO -3,441 -5,831 -19,384 -14,789 -22,045
CFI 0 0 0 0 0
CFF 0 0 0 0 0
Change in Cash -3,441 -5,831 -19,384 -14,789 -22,045
Unlevered Free Cash Flow
2001 2002 2003 2004 2005 Totals
Unlev Net Income 3,617 4,968 7,104 9,661 13,139
Dep 1,116 1,707 2,441 3,319 4,513
Delta in Work
Cap. -7,058 10,798 16,736 23,932 32,547
CapX 0 0 0 0 0
Total -2,325 17,473 26,281 36,912 50,199 128,540
FCF -2,325 17,473 26,281 36,912 50,199
1-WACC 30% 0.7 0.7 0.7 0.7 0.7
Totals -3,321 24,961 37,544 52,731 71,712 183,627
Perpetuity Growth Rate
128,540 0.7 183,627 Terminal Value
EBITDA Exit Multiple
2001 2002 2003 2004 2005 Totals
Year 5 EBIT 2.2 20.9 63.9 151.8 239.7 478.5
Plus Dep 1,116 1,707 2,441 3,319 4,513 13,096
Terminal EBITDA 3.3 22.6 66.3 155.1 244.2 491.5
EBITDA Multiple 5.0x
Terminal Value 183,627
Implied Perpetuity Growth Rate 37%
Enterprise Value WACC = 30% (CF/r)
Enterprise Value 183,627 Unleveed Cash Flow
Excess Cash 0
Debt 46,721 2005 Total Liab, from Balance Sheet
Equity Value 136,906 Enterprise Value
CF 136,906 Enterprise Value
r 30% WACC
456,353 Enterprise Value
Pro forma cash -- adjust
Enterprise Value 456,353
Excess Cash -22,045 from Cash Flow
Debt 10,131 2001 Total Liab, from Balance Sheet
Equity Value 444,439 Pre-Money Equity Value
Invested Money (Post-Money Value)
Date
Investor Hurdle Rate 37%
Cash Investment 1/1/2006 -1,000,000
Return of Capital 12/31/2010 8,100,000 (from research)
IRR 37%
Multiple of Invested Capital 8.0x
12/31/10 Projected Value 64,800,000
12/31/10 Investor Return 1,350,000
Implied Ownership 12%
Pre-Money Value 444,439
Post-Money Value 1,444,439
Investment 1,000,000
Ownership 12% (required % ownership)
Discounted Cash Flow -- 5 years
Cash
Flow 12% PV
1,000,000 1.12 1,120,000
1,000,000 1.254 1,254,000
1,000,000 1.405 1,405,000
1,000,000 1.574 1,574,000
1,000,000 1.762 1,762,000
1,000,000 1.974 1,974,000
9,089,000
What type of securities will you purchase? Common stock
Analysis of Intelligent Reasoning Systems--copy

Weitere ähnliche Inhalte

Was ist angesagt?

Carolyn Fisher, FCF DDM Model UPDATED
Carolyn Fisher, FCF DDM Model UPDATEDCarolyn Fisher, FCF DDM Model UPDATED
Carolyn Fisher, FCF DDM Model UPDATEDCarrie Fisher
 
Tata Motors Ratio Analysis
Tata Motors Ratio AnalysisTata Motors Ratio Analysis
Tata Motors Ratio Analysispurval
 
Financial analysis of tata motors
Financial analysis of tata motorsFinancial analysis of tata motors
Financial analysis of tata motorsCA Ajay Biwal
 
Illustration
IllustrationIllustration
Illustrationbinex77
 
Ting yin its_financialpla_march15_11am
Ting yin its_financialpla_march15_11amTing yin its_financialpla_march15_11am
Ting yin its_financialpla_march15_11amTing Yin
 
Internal cashflow and investment decisions: Case of Pakistani sugar sector.
Internal cashflow and investment decisions: Case of Pakistani sugar sector.Internal cashflow and investment decisions: Case of Pakistani sugar sector.
Internal cashflow and investment decisions: Case of Pakistani sugar sector.Mitsui & Co., Ltd.
 
Tata Motors Capital Structure
Tata Motors Capital StructureTata Motors Capital Structure
Tata Motors Capital Structureitsvineeth209
 
Fy21 q2 consolidated_financial_statements
Fy21 q2 consolidated_financial_statementsFy21 q2 consolidated_financial_statements
Fy21 q2 consolidated_financial_statementslos_pinos
 
financialsnapshot
financialsnapshotfinancialsnapshot
financialsnapshotfinance14
 
16.3 the ifrs 9
16.3   the ifrs 916.3   the ifrs 9
16.3 the ifrs 9crmbasel
 
Excel Model for Valuation of Natural Gas Firm
Excel Model for Valuation of Natural Gas FirmExcel Model for Valuation of Natural Gas Firm
Excel Model for Valuation of Natural Gas FirmFlevy.com Best Practices
 
DAILY AGRI REPORT BY EPIC RESEARCH-19 APRIL 2012
DAILY AGRI REPORT BY EPIC RESEARCH-19 APRIL 2012DAILY AGRI REPORT BY EPIC RESEARCH-19 APRIL 2012
DAILY AGRI REPORT BY EPIC RESEARCH-19 APRIL 2012Epic Research Limited
 

Was ist angesagt? (20)

Carolyn Fisher, FCF DDM Model UPDATED
Carolyn Fisher, FCF DDM Model UPDATEDCarolyn Fisher, FCF DDM Model UPDATED
Carolyn Fisher, FCF DDM Model UPDATED
 
Tata Motors Ratio Analysis
Tata Motors Ratio AnalysisTata Motors Ratio Analysis
Tata Motors Ratio Analysis
 
Excel Model of Trading Firm
Excel Model of Trading FirmExcel Model of Trading Firm
Excel Model of Trading Firm
 
Financial analysis of tata motors
Financial analysis of tata motorsFinancial analysis of tata motors
Financial analysis of tata motors
 
Illustration
IllustrationIllustration
Illustration
 
Ting yin its_financialpla_march15_11am
Ting yin its_financialpla_march15_11amTing yin its_financialpla_march15_11am
Ting yin its_financialpla_march15_11am
 
Internal cashflow and investment decisions: Case of Pakistani sugar sector.
Internal cashflow and investment decisions: Case of Pakistani sugar sector.Internal cashflow and investment decisions: Case of Pakistani sugar sector.
Internal cashflow and investment decisions: Case of Pakistani sugar sector.
 
ATS Company Reports: Mayur
ATS Company Reports: MayurATS Company Reports: Mayur
ATS Company Reports: Mayur
 
Hansson
HanssonHansson
Hansson
 
ATS Company Reports: Banco products
ATS Company Reports: Banco productsATS Company Reports: Banco products
ATS Company Reports: Banco products
 
Résultats Annuels 2015 En MDH
Résultats Annuels 2015 En MDHRésultats Annuels 2015 En MDH
Résultats Annuels 2015 En MDH
 
Tata Motors Capital Structure
Tata Motors Capital StructureTata Motors Capital Structure
Tata Motors Capital Structure
 
Fy21 q2 consolidated_financial_statements
Fy21 q2 consolidated_financial_statementsFy21 q2 consolidated_financial_statements
Fy21 q2 consolidated_financial_statements
 
financialsnapshot
financialsnapshotfinancialsnapshot
financialsnapshot
 
캐피탈 영문
캐피탈 영문캐피탈 영문
캐피탈 영문
 
ATS Company Reports: Century ply
ATS Company Reports: Century plyATS Company Reports: Century ply
ATS Company Reports: Century ply
 
16.3 the ifrs 9
16.3   the ifrs 916.3   the ifrs 9
16.3 the ifrs 9
 
Excel Model for Valuation of Natural Gas Firm
Excel Model for Valuation of Natural Gas FirmExcel Model for Valuation of Natural Gas Firm
Excel Model for Valuation of Natural Gas Firm
 
Resultats annuels au 1632017
Resultats annuels au 1632017Resultats annuels au 1632017
Resultats annuels au 1632017
 
DAILY AGRI REPORT BY EPIC RESEARCH-19 APRIL 2012
DAILY AGRI REPORT BY EPIC RESEARCH-19 APRIL 2012DAILY AGRI REPORT BY EPIC RESEARCH-19 APRIL 2012
DAILY AGRI REPORT BY EPIC RESEARCH-19 APRIL 2012
 

Andere mochten auch

ΤΟΥΡΝΟΥΑ ΑΤΕΡΜΩΝ ΤΜΗΜΑ ΠΡΟΤΖΟΥΝΙΟΡ
ΤΟΥΡΝΟΥΑ ΑΤΕΡΜΩΝ ΤΜΗΜΑ ΠΡΟΤΖΟΥΝΙΟΡΤΟΥΡΝΟΥΑ ΑΤΕΡΜΩΝ ΤΜΗΜΑ ΠΡΟΤΖΟΥΝΙΟΡ
ΤΟΥΡΝΟΥΑ ΑΤΕΡΜΩΝ ΤΜΗΜΑ ΠΡΟΤΖΟΥΝΙΟΡΓΙΑΝΝΗΣ ΚΑΡΑΚΩΣΤΑΣ
 
Como conquistar um homem religioso
Como conquistar um homem religiosoComo conquistar um homem religioso
Como conquistar um homem religiosopassguygjh145
 
Course outline pp_2
Course outline pp_2Course outline pp_2
Course outline pp_2Uc Man
 
Proyecto de aula nelson sierra alvarez
Proyecto de aula   nelson sierra alvarezProyecto de aula   nelson sierra alvarez
Proyecto de aula nelson sierra alvarezdcpe2014
 
Does Web 2.0 herald the end of in-house development and provision of IT servi...
Does Web 2.0 herald the end of in-house development and provision of IT servi...Does Web 2.0 herald the end of in-house development and provision of IT servi...
Does Web 2.0 herald the end of in-house development and provision of IT servi...Paul Walk
 
Meeting Minutes 2
Meeting Minutes 2Meeting Minutes 2
Meeting Minutes 2namzmedia
 
Learnings from a decade of agile in practice
Learnings from a decade of agile in practiceLearnings from a decade of agile in practice
Learnings from a decade of agile in practiceSunil Mundra
 
Lean Consulting, Six Sigma Training & Lean Manufacturing | SSA
Lean Consulting, Six Sigma Training & Lean Manufacturing | SSALean Consulting, Six Sigma Training & Lean Manufacturing | SSA
Lean Consulting, Six Sigma Training & Lean Manufacturing | SSAssasolutions
 
δελτιο τυπου δημιουργικη γραφη
δελτιο τυπου δημιουργικη γραφηδελτιο τυπου δημιουργικη γραφη
δελτιο τυπου δημιουργικη γραφηdoragk
 

Andere mochten auch (14)

ΤΟΥΡΝΟΥΑ ΑΤΕΡΜΩΝ ΤΜΗΜΑ ΠΡΟΤΖΟΥΝΙΟΡ
ΤΟΥΡΝΟΥΑ ΑΤΕΡΜΩΝ ΤΜΗΜΑ ΠΡΟΤΖΟΥΝΙΟΡΤΟΥΡΝΟΥΑ ΑΤΕΡΜΩΝ ΤΜΗΜΑ ΠΡΟΤΖΟΥΝΙΟΡ
ΤΟΥΡΝΟΥΑ ΑΤΕΡΜΩΝ ΤΜΗΜΑ ΠΡΟΤΖΟΥΝΙΟΡ
 
Ada3 cahr
Ada3 cahrAda3 cahr
Ada3 cahr
 
Como conquistar um homem religioso
Como conquistar um homem religiosoComo conquistar um homem religioso
Como conquistar um homem religioso
 
Course outline pp_2
Course outline pp_2Course outline pp_2
Course outline pp_2
 
Proyecto de aula nelson sierra alvarez
Proyecto de aula   nelson sierra alvarezProyecto de aula   nelson sierra alvarez
Proyecto de aula nelson sierra alvarez
 
Hibisco Chinês
Hibisco ChinêsHibisco Chinês
Hibisco Chinês
 
Does Web 2.0 herald the end of in-house development and provision of IT servi...
Does Web 2.0 herald the end of in-house development and provision of IT servi...Does Web 2.0 herald the end of in-house development and provision of IT servi...
Does Web 2.0 herald the end of in-house development and provision of IT servi...
 
Meeting Minutes 2
Meeting Minutes 2Meeting Minutes 2
Meeting Minutes 2
 
Crowley20140911
Crowley20140911Crowley20140911
Crowley20140911
 
Ranjancv
RanjancvRanjancv
Ranjancv
 
Learnings from a decade of agile in practice
Learnings from a decade of agile in practiceLearnings from a decade of agile in practice
Learnings from a decade of agile in practice
 
Lean Consulting, Six Sigma Training & Lean Manufacturing | SSA
Lean Consulting, Six Sigma Training & Lean Manufacturing | SSALean Consulting, Six Sigma Training & Lean Manufacturing | SSA
Lean Consulting, Six Sigma Training & Lean Manufacturing | SSA
 
Propuesta queremal
Propuesta queremalPropuesta queremal
Propuesta queremal
 
δελτιο τυπου δημιουργικη γραφη
δελτιο τυπου δημιουργικη γραφηδελτιο τυπου δημιουργικη γραφη
δελτιο τυπου δημιουργικη γραφη
 

Ähnlich wie Analysis of Intelligent Reasoning Systems--copy

Neslte India Ltd_Financial Model Working.pdf
Neslte India Ltd_Financial Model Working.pdfNeslte India Ltd_Financial Model Working.pdf
Neslte India Ltd_Financial Model Working.pdfDeepakKumar234566
 
Startup4Chinese #14: Hate financial trouble? Guidelines for non-finance backg...
Startup4Chinese #14: Hate financial trouble? Guidelines for non-finance backg...Startup4Chinese #14: Hate financial trouble? Guidelines for non-finance backg...
Startup4Chinese #14: Hate financial trouble? Guidelines for non-finance backg...Ke Zheng
 
$ANF Valuation Model
$ANF Valuation Model$ANF Valuation Model
$ANF Valuation ModelLindsay Meyer
 
2Q22_EN.pdf
2Q22_EN.pdf2Q22_EN.pdf
2Q22_EN.pdfirhcs
 
Apresentação 1T06
Apresentação 1T06Apresentação 1T06
Apresentação 1T06RiRossi
 
ration analysis of wipro
ration analysis of wiproration analysis of wipro
ration analysis of wiproMayank Singhal
 
Cfa research presentation university at buffalo
Cfa research presentation university at buffalo Cfa research presentation university at buffalo
Cfa research presentation university at buffalo Ke Guo
 
Current Years Estimation PowerPoint Presentation Slides
Current Years Estimation PowerPoint Presentation SlidesCurrent Years Estimation PowerPoint Presentation Slides
Current Years Estimation PowerPoint Presentation SlidesSlideTeam
 
10.3 practical issues in credit assessments
10.3   practical issues in credit assessments10.3   practical issues in credit assessments
10.3 practical issues in credit assessmentscrmbasel
 
2023_EN. HYUNDAI CAPITAL SERVICES 2023 PERFORMANCE
2023_EN. HYUNDAI CAPITAL SERVICES 2023 PERFORMANCE2023_EN. HYUNDAI CAPITAL SERVICES 2023 PERFORMANCE
2023_EN. HYUNDAI CAPITAL SERVICES 2023 PERFORMANCEirhcs
 
1Q23_EN.pdf
1Q23_EN.pdf1Q23_EN.pdf
1Q23_EN.pdfirhcs
 
AT&T Financial and Operational Results
AT&T Financial and Operational ResultsAT&T Financial and Operational Results
AT&T Financial and Operational Resultsfinance1
 
AT&TFinancial and Operational Results
AT&TFinancial and Operational ResultsAT&TFinancial and Operational Results
AT&TFinancial and Operational Resultsfinance1
 

Ähnlich wie Analysis of Intelligent Reasoning Systems--copy (20)

INVESTAURA_Business-Planning-Template.pdf
INVESTAURA_Business-Planning-Template.pdfINVESTAURA_Business-Planning-Template.pdf
INVESTAURA_Business-Planning-Template.pdf
 
Neslte India Ltd_Financial Model Working.pdf
Neslte India Ltd_Financial Model Working.pdfNeslte India Ltd_Financial Model Working.pdf
Neslte India Ltd_Financial Model Working.pdf
 
Forcast Model
Forcast ModelForcast Model
Forcast Model
 
Work sample
Work sampleWork sample
Work sample
 
Startup4Chinese #14: Hate financial trouble? Guidelines for non-finance backg...
Startup4Chinese #14: Hate financial trouble? Guidelines for non-finance backg...Startup4Chinese #14: Hate financial trouble? Guidelines for non-finance backg...
Startup4Chinese #14: Hate financial trouble? Guidelines for non-finance backg...
 
bKash equity valuation 2018
bKash equity valuation 2018bKash equity valuation 2018
bKash equity valuation 2018
 
$ANF Valuation Model
$ANF Valuation Model$ANF Valuation Model
$ANF Valuation Model
 
2Q22_EN.pdf
2Q22_EN.pdf2Q22_EN.pdf
2Q22_EN.pdf
 
UAC annual report 2017
UAC annual report 2017UAC annual report 2017
UAC annual report 2017
 
Apresentação 1T06
Apresentação 1T06Apresentação 1T06
Apresentação 1T06
 
ration analysis of wipro
ration analysis of wiproration analysis of wipro
ration analysis of wipro
 
Cfa research presentation university at buffalo
Cfa research presentation university at buffalo Cfa research presentation university at buffalo
Cfa research presentation university at buffalo
 
Example print out-efm-de
Example print out-efm-deExample print out-efm-de
Example print out-efm-de
 
Current Years Estimation PowerPoint Presentation Slides
Current Years Estimation PowerPoint Presentation SlidesCurrent Years Estimation PowerPoint Presentation Slides
Current Years Estimation PowerPoint Presentation Slides
 
10.3 practical issues in credit assessments
10.3   practical issues in credit assessments10.3   practical issues in credit assessments
10.3 practical issues in credit assessments
 
A9 r735e
A9 r735eA9 r735e
A9 r735e
 
2023_EN. HYUNDAI CAPITAL SERVICES 2023 PERFORMANCE
2023_EN. HYUNDAI CAPITAL SERVICES 2023 PERFORMANCE2023_EN. HYUNDAI CAPITAL SERVICES 2023 PERFORMANCE
2023_EN. HYUNDAI CAPITAL SERVICES 2023 PERFORMANCE
 
1Q23_EN.pdf
1Q23_EN.pdf1Q23_EN.pdf
1Q23_EN.pdf
 
AT&T Financial and Operational Results
AT&T Financial and Operational ResultsAT&T Financial and Operational Results
AT&T Financial and Operational Results
 
AT&TFinancial and Operational Results
AT&TFinancial and Operational ResultsAT&TFinancial and Operational Results
AT&TFinancial and Operational Results
 

Analysis of Intelligent Reasoning Systems--copy

  • 1. “Analysis of Intelligent Reasoning Systems, Inc.” By John Frederick FI 512: Keller Graduate School of Management August 22, 2006 Part I: Investment Merits and Risks: Merits: • Shows EMS Market for OI increasing each year from 2001 and beyond • Growth in market share and all other related markets like semiconductor and historical performance. • Interesting technology ideas • Strong research and development ideas • Fast growing company Risks: • Company presented net losses for 1998, 1999, and 2000 on the income statement Part II: Recommendation: I would recommend an investment into the company, before the competition buys the company in a merger or acquisition. I would not make huge investments into the company because of the low profits. This company has a good technology idea that may change the way technology is done. This is an investment in an idea, a tool, and a device. This is not an investment in money or capital. This investment is not a rapid, fast growing investment like commodities. Part III: Investment Amount: As a result of valuation and research, I have chosen to investment a minimal of $1,000,000 only, with a return of $9,089,900 after six years. Part IV: Company Value: The company is valued at $8,100,000 from research. Part V: Capital Structure: I would buy common stocks and warrants.
  • 3. CAGR 53% 55% 43% 36% 2001 2002 2003 2004 2005 Rev. 520 590 670 759 998 COGS 506.8 542.7 542.9 469.4 545.9 Gross Profit 13.2 68.2 19.1 137.8 212.4 EBITDA 2.2 20.9 63.9 151.8 239.7 Operating Income 3,411 5,287 7,560 10,281 13,982 Int. Exp -206 -319 -456 -620 -843 Pre-Tax 3,617 4,968 7,104 9,661 13,139 Net Income 3,617 4,968 7,104 9,661 13,139 Balance Sheet CAGR 53% 55% 43% 36% 2001 2002 2003 2004 2005 Assets Cash & Cash Equ 10,986 16,808 26,052 37,254 50,665 A/R 6,397 9,787 15,169 21,691 29,499 Inventory 10,480 16,034 24,852 35,538 48,331 Other C.A. 97 148 229 327 444 Total C.A. 27,959 42,777 66,304 94,810 128,941 Net PP&E 3,014 4,611 7,147 10,220 13,899 Other Assets 512 783 1,213 1,734 2,358 Total Assets 31,485 32,671 50,640 72,415 98,484 Liab & Equity Bank Revolver 0 0 0 0 0 A/P 4,091 6,259 9,701 13,872 18,865 Bank facility Other C.L. 5,400 8,262 4,544 6,497 8,835 Total C.L. 9,491 14,521 22,507 32,185 43,771 Notes Payable Other L-T Liab Sub Convert N/P Existing Sr Debt 640 979 1,517 2,169 2,949 Total Liab 10,131 15,500 24,024 34,354 46,721 Existing Pf stock 24,794 37,934 58,797 84,079 114,347 Common Equity -3,440 -5,263 -8,157 -11,664 -15,863 Total Liab & Eq 31,485 32,671 50,640 72,415 98,484
  • 4. Cash Flow CAGR 53% 55% 43% 36% 2001 2002 2003 2004 2005 CFO Net Income 3,617 4,968 7,104 9,661 13,139 Adj to Net Income Dep Exp 1,116 1,707 2,441 3,319 4,513 Prepaid Accr Liab Inventory -10,480 -16,034 -24,852 -35,538 -48,331 A/P -4,091 -6,259 -9,701 -13,872 -18,865 A/R 6,397 9,787 15,169 21,691 29,499 Total -7,058 -10,799 -16,943 -24,400 -33,184 Net CFO -3,441 -5,831 -19,384 -14,789 -22,045 CFI 0 0 0 0 0 CFF 0 0 0 0 0 Change in Cash -3,441 -5,831 -19,384 -14,789 -22,045 Unlevered Free Cash Flow 2001 2002 2003 2004 2005 Totals Unlev Net Income 3,617 4,968 7,104 9,661 13,139 Dep 1,116 1,707 2,441 3,319 4,513 Delta in Work Cap. -7,058 10,798 16,736 23,932 32,547 CapX 0 0 0 0 0 Total -2,325 17,473 26,281 36,912 50,199 128,540 FCF -2,325 17,473 26,281 36,912 50,199 1-WACC 30% 0.7 0.7 0.7 0.7 0.7 Totals -3,321 24,961 37,544 52,731 71,712 183,627 Perpetuity Growth Rate 128,540 0.7 183,627 Terminal Value EBITDA Exit Multiple 2001 2002 2003 2004 2005 Totals Year 5 EBIT 2.2 20.9 63.9 151.8 239.7 478.5 Plus Dep 1,116 1,707 2,441 3,319 4,513 13,096 Terminal EBITDA 3.3 22.6 66.3 155.1 244.2 491.5 EBITDA Multiple 5.0x Terminal Value 183,627 Implied Perpetuity Growth Rate 37%
  • 5. Enterprise Value WACC = 30% (CF/r) Enterprise Value 183,627 Unleveed Cash Flow Excess Cash 0 Debt 46,721 2005 Total Liab, from Balance Sheet Equity Value 136,906 Enterprise Value CF 136,906 Enterprise Value r 30% WACC 456,353 Enterprise Value Pro forma cash -- adjust Enterprise Value 456,353 Excess Cash -22,045 from Cash Flow Debt 10,131 2001 Total Liab, from Balance Sheet Equity Value 444,439 Pre-Money Equity Value Invested Money (Post-Money Value) Date Investor Hurdle Rate 37% Cash Investment 1/1/2006 -1,000,000 Return of Capital 12/31/2010 8,100,000 (from research) IRR 37% Multiple of Invested Capital 8.0x 12/31/10 Projected Value 64,800,000 12/31/10 Investor Return 1,350,000 Implied Ownership 12% Pre-Money Value 444,439 Post-Money Value 1,444,439 Investment 1,000,000 Ownership 12% (required % ownership) Discounted Cash Flow -- 5 years Cash Flow 12% PV 1,000,000 1.12 1,120,000 1,000,000 1.254 1,254,000 1,000,000 1.405 1,405,000 1,000,000 1.574 1,574,000 1,000,000 1.762 1,762,000 1,000,000 1.974 1,974,000 9,089,000 What type of securities will you purchase? Common stock