2019 05 Monthly Home Sales Stats for Calgary
•
0 gefällt mir•104 views

2019 05 Monthly Home Sales Stats for Calgary Feel free to contact us for all your Real Estate Needs in Calgary.

Empfohlen
Empfohlen
Weitere ähnliche Inhalte
Was ist angesagt?
Was ist angesagt? (17)
Ähnlich wie 2019 05 Monthly Home Sales Stats for Calgary
Ähnlich wie 2019 05 Monthly Home Sales Stats for Calgary (20)
Mehr von Jerry Charlton
Mehr von Jerry Charlton (14)
Kürzlich hochgeladen
Kürzlich hochgeladen (20)
2019 05 Monthly Home Sales Stats for Calgary
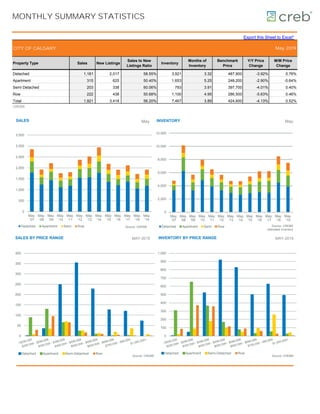
- 1. MONTHLY SUMMARY STATISTICS Export this Sheet to Excel* CITY OF CALGARY Property Type Sales New Listings Sales to New Listings Ratio Inventory Months of Inventory Benchmark Price Y/Y Price Change M/M Price Change Detached 1,181 2,017 58.55% 3,921 3.32 487,900 -3.92% 0.76% Apartment 315 625 50.40% 1,653 5.25 248,200 -2.90% -0.64% Semi Detached 203 338 60.06% 793 3.91 397,700 -4.01% 0.40% Row 222 438 50.68% 1,100 4.95 286,500 -5.63% 0.46% Total 1,921 3,418 56.20% 7,467 3.89 424,600 -4.13% 0.52% CREB® May 2019 0 500 1,000 1,500 2,000 2,500 3,000 3,500 May. '07 May. '08 May. '09 May. '10 May. '11 May. '12 May. '13 May. '14 May. '15 May. '16 May. '17 May. '18 May. '19 SALES Detached Apartment Semi Row Source: CREB® May 0 100 200 300 400 500 600 700 800 900 1,000 INVENTORY BY PRICE RANGE Detached Apartment Semi-Detached Row Source: CREB® MAY-2019 0 50 100 150 200 250 300 350 400 SALES BY PRICE RANGE Detached Apartment Semi-Detached Row Source: CREB® MAY-2019 0 2,000 4,000 6,000 8,000 10,000 12,000 May. '07 May. '08 May. '09 May. '10 May. '11 May. '12 May. '13 May. '14 May. '15 May. '16 May. '17 May. '18 May. '19 INVENTORY Detached Apartment Semi Row Source: CREB® estimated inventory May
- 2. TOTAL RESIDENTIAL CITY OF CALGARY Sales Y/Y% New Listings Y/Y% S/NL Ratio Inventory Months of Supply DOM SP/LP Benchmark Price Y/Y% Median Price Y/Y% Average Price Y/Y% Index Jan-10 1,126 47% 2,742 -8% 0.41 3,792 3.37 45 97.3% 380,600 3.7% 355,000 3.5% 388,518 5.1% 173 Feb-10 1,561 35% 3,229 11% 0.48 4,711 3.02 38 97.3% 384,500 6.5% 354,000 4.1% 398,217 6.9% 175 Mar-10 1,976 30% 4,311 49% 0.46 5,957 3.01 35 97.7% 388,500 8.3% 377,000 10.9% 416,568 9.7% 176 Apr-10 1,973 7% 4,379 49% 0.45 7,096 3.60 38 97.4% 390,900 9.7% 367,500 6.5% 404,913 6.3% 177 May-10 1,762 -20% 4,152 30% 0.42 7,926 4.50 40 97.2% 391,600 9.2% 380,000 8.6% 431,083 10.8% 178 Jun-10 1,496 -41% 3,766 20% 0.40 8,264 5.52 42 96.9% 389,200 7.6% 371,500 2.3% 425,892 6.4% 177 Jul-10 1,301 -43% 2,810 -5% 0.46 7,723 5.94 47 96.4% 385,600 5.6% 362,500 2.7% 410,780 5.3% 175 Aug-10 1,221 -35% 2,745 1% 0.44 7,137 5.85 52 96.5% 380,300 3.1% 357,500 0.7% 398,636 0.5% 173 Sep-10 1,310 -28% 3,133 13% 0.42 6,955 5.31 54 96.1% 376,400 1.4% 357,250 0.6% 411,966 1.8% 171 Oct-10 1,183 -36% 2,458 -7% 0.48 6,422 5.43 53 96.2% 372,400 -0.4% 360,000 -0.7% 404,072 -0.7% 169 Nov-10 1,189 -25% 1,924 -6% 0.62 5,675 4.77 54 96.2% 369,500 -1.9% 365,000 0.6% 410,493 -0.1% 168 Dec-10 1,041 -7% 1,104 -11% 0.94 4,037 3.88 60 96.2% 368,400 -2.7% 349,000 -4.3% 392,107 -2.5% 167 2010 17,139 -17% 36,753 13% 0.47 6,308 4.52 45 96.9% 381,492 4.1% 365,000 3.3% 409,180 4.0% 173 Jan-11 1,076 -4% 2,804 2% 0.38 4,377 4.07 58 96.5% 366,700 -3.7% 355,000 0.0% 406,769 4.7% 166 Feb-11 1,618 4% 3,188 -1% 0.51 5,083 3.14 47 96.9% 370,600 -3.6% 365,000 3.1% 412,558 3.6% 168 Mar-11 1,909 -3% 3,405 -21% 0.56 5,723 3.00 42 97.0% 373,700 -3.8% 362,000 -4.0% 406,053 -2.5% 170 Apr-11 1,742 -12% 3,239 -26% 0.54 6,172 3.54 45 97.1% 375,700 -3.9% 370,224 0.7% 421,017 4.0% 171 May-11 1,803 2% 3,531 -15% 0.51 6,476 3.59 44 97.1% 377,300 -3.7% 380,000 0.0% 432,617 0.4% 171 Jun-11 1,953 31% 3,332 -12% 0.59 6,537 3.35 46 97.0% 379,200 -2.6% 375,000 0.9% 425,507 -0.1% 172 Jul-11 1,591 22% 2,842 1% 0.56 6,437 4.05 49 97.0% 379,200 -1.7% 370,000 2.1% 407,752 -0.7% 172 Aug-11 1,563 28% 2,946 7% 0.53 6,362 4.07 50 97.0% 378,100 -0.6% 363,500 1.7% 404,088 1.4% 172 Sep-11 1,457 11% 3,192 2% 0.46 6,552 4.50 51 96.7% 377,000 0.2% 362,500 1.5% 417,120 1.3% 171 Oct-11 1,348 14% 2,521 3% 0.53 6,199 4.60 53 96.6% 376,200 1.0% 358,944 -0.3% 408,662 1.1% 171 Nov-11 1,333 12% 1,830 -5% 0.73 5,308 3.98 53 96.6% 375,100 1.5% 355,000 -2.7% 410,061 -0.1% 170 Dec-11 1,023 -2% 1,070 -3% 0.96 3,967 3.88 60 96.4% 372,000 1.0% 356,500 2.1% 401,717 2.5% 169 2011 18,416 7% 33,900 -8% 0.54 5,766 3.81 49 96.9% 375,067 -1.7% 365,000 0.0% 413,841 1.1% 170 Jan-12 1,063 -1% 2,523 -10% 0.42 4,301 4.05 60 96.8% 372,200 1.5% 358,000 0.8% 391,134 -3.8% 169 Feb-12 1,715 6% 2,862 -10% 0.60 4,676 2.73 49 97.1% 375,300 1.3% 378,000 3.6% 424,367 2.9% 170 Mar-12 2,160 13% 3,331 -2% 0.65 4,999 2.31 42 97.4% 378,600 1.3% 375,750 3.8% 422,154 4.0% 172 Apr-12 2,190 26% 3,229 0% 0.68 5,176 2.36 41 97.6% 382,500 1.8% 381,250 3.0% 428,420 1.8% 174 May-12 2,371 32% 3,783 7% 0.63 5,641 2.38 40 97.6% 387,200 2.6% 390,000 2.6% 444,209 2.7% 176 Jun-12 2,190 12% 3,282 -2% 0.67 5,626 2.57 40 97.6% 389,800 2.8% 391,500 4.4% 441,041 3.7% 177 Jul-12 1,922 21% 2,640 -7% 0.73 5,380 2.80 43 97.3% 390,300 2.9% 378,750 2.4% 425,159 4.3% 177 Aug-12 1,715 10% 2,567 -13% 0.67 5,104 2.98 45 97.4% 390,900 3.4% 374,900 3.1% 416,304 3.0% 177 Sep-12 1,603 10% 2,664 -17% 0.60 4,938 3.08 45 97.3% 391,400 3.8% 369,000 1.8% 419,019 0.5% 178 Oct-12 1,654 23% 2,300 -9% 0.72 4,591 2.78 46 97.2% 392,000 4.2% 385,732 7.5% 436,662 6.9% 178 Nov-12 1,451 9% 1,621 -11% 0.90 3,882 2.68 51 97.1% 391,800 4.5% 375,000 5.6% 433,252 5.7% 178 Dec-12 1,078 5% 877 -18% 1.23 2,740 2.54 54 96.8% 392,000 5.4% 374,750 5.1% 436,212 8.6% 178 2012 21,112 15% 31,679 -7% 0.67 4,755 2.77 45 97.3% 386,167 3.0% 380,000 4.1% 428,035 3.4% 175 Jan-13 1,222 15% 2,479 -2% 0.49 3,079 2.52 50 97.5% 394,400 6.0% 390,450 9.1% 438,646 12.1% 179 Feb-13 1,697 -1% 2,659 -7% 0.64 3,496 2.06 38 97.5% 398,900 6.3% 394,500 4.4% 456,969 7.7% 181 Mar-13 2,096 -3% 3,176 -5% 0.66 3,933 1.88 35 97.9% 404,100 6.7% 401,802 6.9% 460,003 9.0% 183 Apr-13 2,361 8% 3,459 7% 0.68 4,313 1.83 33 97.8% 409,700 7.1% 397,800 4.3% 445,055 3.9% 186 May-13 2,524 6% 3,702 -2% 0.68 4,715 1.87 32 98.0% 413,200 6.7% 405,000 3.8% 460,016 3.6% 188 Jun-13 2,300 5% 2,982 -9% 0.77 4,507 1.96 35 97.8% 416,000 6.7% 405,000 3.4% 465,794 5.6% 189 Jul-13 2,256 17% 2,718 3% 0.83 4,115 1.82 39 97.7% 418,500 7.2% 399,000 5.3% 460,819 8.4% 190 Aug-13 2,185 27% 2,764 8% 0.79 3,861 1.77 38 97.8% 420,200 7.5% 398,000 6.2% 453,234 8.9% 191 Sep-13 1,908 19% 2,777 4% 0.69 3,853 2.02 36 97.9% 422,400 7.9% 400,500 8.5% 453,471 8.2% 192 Oct-13 1,935 17% 2,507 9% 0.77 3,679 1.90 40 97.8% 426,600 8.8% 407,500 5.6% 457,397 4.7% 194 Nov-13 1,719 18% 1,821 12% 0.94 3,136 1.82 40 97.6% 428,400 9.3% 406,500 8.4% 457,227 5.5% 194 Dec-13 1,169 8% 968 10% 1.21 2,259 1.93 46 97.7% 430,100 9.7% 406,000 8.3% 455,138 4.3% 195 2013 23,372 11% 32,012 1% 0.73 3,746 1.95 38 97.8% 415,208 7.5% 400,000 5.3% 455,977 6.5% 188 Jan-14 1,432 17% 2,382 -4% 0.60 2,500 1.75 40 98.1% 432,600 9.7% 416,250 6.6% 462,170 5.4% 196 Feb-14 1,843 9% 2,704 2% 0.68 2,899 1.57 30 98.6% 438,500 9.9% 423,000 7.2% 482,405 5.6% 199 Mar-14 2,471 18% 3,308 4% 0.75 3,207 1.30 28 98.7% 444,700 10.0% 430,000 7.0% 483,634 5.1% 202 Apr-14 2,526 7% 3,738 8% 0.68 3,937 1.56 27 98.8% 451,300 10.2% 428,000 7.6% 476,994 7.2% 205 May-14 2,939 16% 4,314 17% 0.68 4,687 1.59 27 98.7% 458,400 10.9% 434,000 7.2% 486,066 5.7% 208 Jun-14 2,657 16% 3,800 27% 0.70 4,964 1.87 29 98.4% 463,200 11.3% 426,500 5.3% 491,424 5.5% 210 Jul-14 2,317 3% 3,207 18% 0.72 4,921 2.12 33 98.1% 464,300 10.9% 425,000 6.5% 481,198 4.4% 211 Aug-14 2,250 3% 3,131 13% 0.72 4,841 2.15 35 98.0% 465,400 10.8% 420,500 5.7% 475,676 5.0% 211 Sep-14 2,142 12% 3,242 17% 0.66 4,805 2.24 36 98.0% 466,500 10.4% 425,000 6.1% 486,762 7.3% 212 Oct-14 2,134 10% 2,914 16% 0.73 4,646 2.18 37 97.9% 467,800 9.7% 430,000 5.5% 487,609 6.6% 212 Nov-14 1,769 3% 2,076 14% 0.85 4,057 2.29 38 98.0% 467,600 9.2% 429,000 5.5% 485,937 6.3% 212 Dec-14 1,073 -8% 1,363 41% 0.79 3,379 3.15 43 97.5% 465,800 8.3% 415,000 2.2% 471,867 3.7% 211 2014 25,553 9% 36,179 13% 0.71 4,070 1.98 33 98.3% 457,175 10.1% 426,000 6.5% 482,114 5.7% 207
- 3. TOTAL RESIDENTIAL CITY OF CALGARY Sales Y/Y% New Listings Y/Y% S/NL Ratio Inventory Months of Supply DOM SP/LP Benchmark Price Y/Y% Median Price Y/Y% Average Price Y/Y% Index Jan-15 877 -39% 3,269 37% 0.27 4,792 5.46 41 97.6% 467,400 8.0% 422,000 1.4% 460,646 -0.3% 212 Feb-15 1,207 -35% 2,935 9% 0.41 5,531 4.58 35 97.6% 465,200 6.1% 420,000 -0.7% 460,039 -4.6% 211 Mar-15 1,777 -28% 3,129 -5% 0.57 5,704 3.21 38 97.2% 463,900 4.3% 420,000 -2.3% 473,680 -2.1% 211 Apr-15 1,963 -22% 3,064 -18% 0.64 5,637 2.87 40 97.3% 459,700 1.9% 418,000 -2.3% 469,572 -1.6% 209 May-15 2,186 -26% 3,168 -27% 0.69 5,393 2.47 41 97.6% 459,900 0.3% 433,000 -0.2% 478,740 -1.5% 209 Jun-15 2,183 -18% 3,121 -18% 0.70 5,138 2.35 40 97.7% 461,400 -0.4% 430,000 0.8% 483,607 -1.6% 209 Jul-15 1,991 -14% 2,989 -7% 0.67 5,135 2.58 40 97.6% 461,900 -0.5% 435,000 2.4% 476,520 -1.0% 210 Aug-15 1,643 -27% 2,742 -12% 0.60 5,215 3.17 40 97.5% 461,900 -0.8% 422,000 0.4% 465,338 -2.2% 210 Sep-15 1,449 -32% 3,095 -5% 0.47 5,599 3.86 40 97.5% 461,200 -1.1% 425,000 0.0% 458,655 -5.8% 209 Oct-15 1,422 -33% 2,692 -8% 0.53 5,622 3.95 41 97.0% 459,700 -1.7% 419,000 -2.6% 457,591 -6.2% 209 Nov-15 1,262 -29% 2,181 5% 0.58 5,321 4.22 45 96.8% 456,800 -2.3% 410,575 -4.3% 461,303 -5.1% 207 Dec-15 879 -18% 1,491 9% 0.59 4,340 4.94 49 96.4% 454,200 -2.5% 408,000 -1.7% 462,674 -1.9% 206 2015 18,839 -26% 33,876 -6% 0.56 5,286 3.64 41 97.3% 461,100 0.9% 424,000 -0.5% 469,369 -2.6% 209 Jan-16 765 -13% 2,742 -16% 0.28 5,023 6.57 51 96.1% 450,200 -3.7% 407,500 -3.4% 456,889 -0.8% 204 Feb-16 1,130 -6% 2,907 -1% 0.39 5,683 5.03 43 96.8% 447,600 -3.8% 420,000 0.0% 473,940 3.0% 203 Mar-16 1,590 -11% 3,225 3% 0.49 6,102 3.84 43 96.9% 445,100 -4.1% 422,250 0.5% 468,642 -1.1% 202 Apr-16 1,767 -10% 3,217 5% 0.55 6,251 3.54 46 97.0% 443,600 -3.5% 430,000 2.9% 476,988 1.6% 201 May-16 1,920 -12% 3,317 5% 0.58 6,177 3.22 42 97.2% 443,400 -3.6% 432,750 -0.1% 491,832 2.7% 201 Jun-16 2,029 -7% 3,098 -1% 0.65 6,001 2.96 47 97.1% 443,800 -3.8% 430,000 0.0% 485,468 0.4% 201 Jul-16 1,743 -12% 2,683 -10% 0.65 5,708 3.27 47 97.2% 444,000 -3.9% 429,500 -1.3% 485,543 1.9% 202 Aug-16 1,570 -4% 2,766 1% 0.57 5,679 3.62 46 97.1% 444,900 -3.7% 418,500 -0.8% 474,192 1.9% 202 Sep-16 1,479 2% 2,976 -4% 0.50 5,881 3.98 46 97.2% 444,200 -3.7% 432,500 1.8% 490,233 6.9% 202 Oct-16 1,647 16% 2,361 -12% 0.70 5,431 3.30 46 96.9% 443,100 -3.6% 410,000 -2.1% 461,245 0.8% 201 Nov-16 1,226 -3% 1,985 -9% 0.62 4,987 4.07 50 96.8% 440,700 -3.5% 426,000 3.8% 484,950 5.1% 200 Dec-16 929 6% 992 -33% 0.94 3,766 4.05 56 96.3% 440,100 -3.1% 425,000 4.2% 494,671 6.9% 200 2016 17,795 -6% 32,269 -5% 0.55 5,557 3.95 46 96.9% 444,225 -3.7% 425,000 0.2% 479,460 2.1% 202 Jan-17 943 23% 2,383 -13% 0.40 4,110 4.36 53 97.0% 439,400 -2.4% 425,000 4.3% 467,509 2.3% 199 Feb-17 1,334 18% 2,459 -15% 0.54 4,502 3.37 48 97.2% 439,200 -1.9% 428,000 1.9% 480,786 1.4% 199 Mar-17 1,890 19% 3,240 0% 0.58 5,124 2.71 42 97.3% 441,800 -0.7% 435,000 3.0% 490,980 4.8% 201 Apr-17 1,900 8% 3,295 2% 0.58 5,518 2.90 39 97.6% 442,700 -0.2% 445,000 3.5% 495,002 3.8% 201 May-17 2,115 10% 3,864 16% 0.55 6,213 2.94 37 97.7% 446,900 0.8% 448,000 3.5% 504,230 2.5% 203 Jun-17 2,136 5% 3,753 21% 0.57 6,669 3.12 38 97.8% 448,200 1.0% 452,500 5.2% 500,889 3.2% 203 Jul-17 1,624 -7% 2,978 11% 0.55 6,696 4.12 43 97.4% 450,200 1.4% 425,000 -1.0% 477,982 -1.6% 204 Aug-17 1,595 2% 3,004 9% 0.53 6,619 4.15 45 97.3% 448,900 0.9% 428,000 2.3% 478,280 0.9% 204 Sep-17 1,460 -1% 3,263 10% 0.45 6,882 4.71 45 97.3% 447,600 0.8% 423,000 -2.2% 485,041 -1.1% 203 Oct-17 1,467 -11% 2,608 10% 0.56 6,479 4.42 50 97.1% 445,100 0.5% 415,000 1.2% 475,097 3.0% 202 Nov-17 1,410 15% 2,061 4% 0.68 5,683 4.03 52 97.0% 443,100 0.5% 412,000 -3.3% 462,521 -4.6% 201 Dec-17 1,008 9% 1,221 23% 0.83 4,322 4.29 58 97.0% 439,400 -0.2% 410,000 -3.5% 453,093 -8.4% 199 2017 18,882 6% 34,129 6% 0.55 5,735 3.76 45 97.4% 444,375 0.0% 430,000 1.2% 484,066 1.0% 202 Jan-18 959 2% 2,456 3% 0.39 4,640 4.84 61 97.1% 439,400 0.0% 415,000 -2.4% 468,023 0.1% 199 Feb-18 1,089 -18% 2,403 -2% 0.45 5,207 4.78 51 97.2% 440,700 0.3% 425,000 -0.7% 493,008 2.5% 200 Mar-18 1,369 -28% 3,445 6% 0.40 6,389 4.67 45 97.4% 442,000 0.0% 439,000 0.9% 495,374 0.9% 201 Apr-18 1,514 -20% 3,564 8% 0.42 7,334 4.84 47 97.3% 443,400 0.2% 430,500 -3.3% 478,116 -3.4% 201 May-18 1,725 -18% 4,366 13% 0.40 8,458 4.90 46 97.2% 442,900 -0.9% 428,000 -4.5% 490,207 -2.8% 201 Jun-18 1,895 -11% 3,869 3% 0.49 8,830 4.66 46 97.0% 442,900 -1.2% 434,000 -4.1% 494,035 -1.4% 201 Jul-18 1,547 -5% 2,961 -1% 0.52 8,473 5.48 52 96.7% 440,900 -2.1% 423,500 -0.4% 479,224 0.3% 200 Aug-18 1,491 -7% 3,057 2% 0.49 8,139 5.46 56 96.7% 437,400 -2.6% 427,000 -0.2% 483,752 1.1% 199 Sep-18 1,267 -13% 3,086 -5% 0.41 7,961 6.28 56 96.6% 434,300 -3.0% 413,000 -2.4% 466,016 -3.9% 197 Oct-18 1,320 -10% 2,437 -7% 0.54 7,338 5.56 60 96.4% 432,300 -2.9% 410,250 -1.1% 468,444 -1.4% 196 Nov-18 1,172 -17% 1,914 -7% 0.61 6,534 5.58 63 96.4% 429,000 -3.2% 396,625 -3.7% 443,533 -4.1% 195 Dec-18 794 -21% 1,044 -14% 0.76 4,916 6.19 69 96.2% 424,600 -3.4% 401,000 -2.2% 449,000 -0.9% 193 2018 16,142 -15% 34,602 1% 0.47 7,018 5.27 53 96.9% 437,483 -1.6% 420,000 -2.3% 478,088 -1.2% 199 Jan-19 802 -16% 2,572 5% 0.31 5,496 6.85 71 95.9% 421,100 -4.2% 390,750 -5.8% 450,777 -3.7% 191 Feb-19 974 -11% 2,207 -8% 0.44 5,899 6.06 64 96.3% 420,200 -4.7% 399,575 -6.0% 460,434 -6.6% 191 Mar-19 1,327 -3% 2,978 -14% 0.45 6,611 4.98 61 96.6% 420,700 -4.8% 412,500 -6.0% 460,368 -7.1% 191 Apr-19 1,545 2% 3,125 -12% 0.49 7,077 4.58 55 96.7% 422,400 -4.7% 410,000 -4.8% 460,745 -3.6% 192 May-19 1,921 11% 3,418 -22% 0.56 7,467 3.89 56 96.7% 424,600 -4.1% 420,000 -1.9% 472,825 -3.5% 193 Jun-19 Jul-19 Aug-19 Sep-19 Oct-19 Nov-19 Dec-19 2019 6,569 -58% 14,300 -58% 0.46 6,510 5.27 60 96.5% 421,800 -3.6% 410,000 -2.4% 463,414 -3.1% 191
- 4. TOTAL RESIDENTIAL CITY OF CALGARY -20% -15% -10% -5% 0% 5% 10% 15% - 1 2 3 4 5 6 MONTHS OF SUPPLY AND PRICE CHANGE Months of supply trend (12 M) Benchmark price y/y% change Source: CREB® 0 1,000 2,000 3,000 4,000 5,000 6,000 7,000 8,000 9,000 10,000 0% 10% 20% 30% 40% 50% 60% 70% 80% 90% SALES TO NEW LISTINGS RATIO AND INVENTORY Inventory Sales to New listings ratio trend (12 M) Inventory trend (12 M) Source: CREB® 0 100,000 200,000 300,000 400,000 500,000 600,000 PRICE COMPARISON Average Median Benchmark Source: CREB® - 10 20 30 40 50 60 70 DAYS ON MARKET Days on market trend (12 M) Source: CREB® 405,000 410,000 415,000 420,000 425,000 430,000 435,000 440,000 445,000 0 1,000 2,000 3,000 4,000 5,000 6,000 7,000 8,000 9,000 10,000 May. '18 Jun. '18 Jul. '18 Aug. '18 Sep. '18 Oct. '18 Nov. '18 Dec. '18 Jan. '19 Feb. '19 Mar. '19 Apr. '19 May. '19 INVENTORY, SALES AND PRICE Inventory Sales Benchmark Price Source: CREB® 0 1 2 3 4 5 6 7 8 9 <$200,000 $200,000 - $299,999 $300,000 - $399,999 $400,000 - $499,999 $500,000 - $599,999 $600,000 - $699,999 $700,000 - 999,999 $1,000,000+ MONTHS OF SUPPLY BY PRICE RANGE May-16 May-17 May-18 May-19 Source: CREB® May
- 5. TOTAL RESIDENTIAL CITY OF CALGARY - 500 1,000 1,500 2,000 2,500 Jan. Feb. Mar. Apr. May Jun. Jul. Aug. Sept. Oct. Nov. Dec. SALES COMPARISON 2019 2018 2017 2016 Source: CREB® 0 200 400 600 800 1,000 1,200 1,400 1,600 1,800 2,000 <$200,000 $200,000 - $299,999 $300,000 - $399,999 $400,000 - $499,999 $500,000 - $599,999 $600,000 - $699,999 $700,000 - 999,999 $1,000,000+ YTD SALES BY PRICE RANGE YTD-2016 YTD-2017 YTD-2018 YTD-2019 Source: CREB® YTD-MAY 0 500 1,000 1,500 2,000 2,500 3,000 3,500 4,000 <$200,000 $200,000 - $299,999 $300,000 - $399,999 $400,000 - $499,999 $500,000 - $599,999 $600,000 - $699,999 $700,000 - 999,999 $1,000,000+ YTD NEW LISTINGS BY PRICE RANGE YTD-2016 YTD-2017 YTD-2018 YTD-2019 Source: CREB® YTD-MAY 0 200 400 600 800 1,000 1,200 1,400 1,600 1,800 <$200,000 $200,000 - $299,999 $300,000 - $399,999 $400,000 - $499,999 $500,000 - $599,999 $600,000 - $699,999 $700,000 - 999,999 $1,000,000+ INVENTORY BY PRICE RANGE May-16 May-17 May-18 May-19 Source: CREB® May - 500 1,000 1,500 2,000 2,500 3,000 3,500 4,000 4,500 5,000 Jan. Feb. Mar. Apr. May Jun. Jul. Aug. Sept. Oct. Nov. Dec. NEW LISTINGS COMPARISON 2019 2018 2017 2016 Source: CREB® - 1,000 2,000 3,000 4,000 5,000 6,000 7,000 8,000 9,000 10,000 Jan. Feb. Mar. Apr. May Jun. Jul. Aug. Sept. Oct. Nov. Dec. INVENTORY COMPARISON 2019 2018 2017 2016 Source: CREB®
- 6. DETACHED CITY OF CALGARY Sales Y/Y% New Listings Y/Y% S/NL Ratio Inventory Months of Supply DOM SP/LP Benchmark Price Y/Y% Median Price Y/Y% Average Price Y/Y% Index Jan-10 676 37% 1,599 -13% 0.42 2,141 3.17 42 97.4% 423,700 5.1% 403,000 6.8% 449,539 7.7% 173 Feb-10 936 23% 1,922 5% 0.49 2,669 2.85 34 97.4% 428,300 8.0% 417,750 9.9% 465,092 10.8% 175 Mar-10 1,240 28% 2,656 46% 0.47 3,460 2.79 33 97.8% 433,200 9.6% 428,000 12.6% 479,511 11.8% 177 Apr-10 1,201 3% 2,766 55% 0.43 4,284 3.57 36 97.5% 435,700 10.5% 423,900 11.0% 468,831 9.6% 178 May-10 1,120 -22% 2,655 35% 0.42 4,863 4.34 38 97.2% 435,400 9.6% 424,400 8.8% 492,624 11.4% 178 Jun-10 939 -43% 2,422 23% 0.39 5,164 5.50 39 96.9% 432,500 7.6% 420,000 5.0% 487,222 8.4% 176 Jul-10 834 -41% 1,754 -5% 0.48 4,783 5.74 46 96.4% 427,600 5.3% 407,750 3.0% 474,552 6.9% 174 Aug-10 777 -30% 1,753 3% 0.44 4,405 5.67 51 96.6% 421,000 2.6% 400,000 0.0% 452,355 -1.2% 172 Sep-10 869 -22% 2,011 22% 0.43 4,286 4.93 53 96.0% 415,800 0.4% 392,000 -3.4% 466,216 0.3% 170 Oct-10 803 -29% 1,562 -1% 0.51 3,916 4.88 51 96.3% 411,100 -1.4% 391,000 -6.5% 446,440 -5.5% 168 Nov-10 794 -17% 1,153 -5% 0.69 3,371 4.25 52 96.3% 408,700 -2.7% 399,450 -3.5% 456,823 -4.0% 167 Dec-10 654 -6% 657 -8% 1.00 2,341 3.58 58 96.2% 408,000 -3.2% 390,000 -4.4% 440,537 -4.0% 166 2010 10,843 -16% 22,910 15% 0.47 3,807 4.27 43 96.9% 423,417 4.2% 410,000 3.5% 467,383 4.3% 173 Jan-11 697 3% 1,734 8% 0.40 2,526 3.62 56 96.7% 406,500 -4.1% 394,000 -2.2% 460,161 2.4% 166 Feb-11 1,038 11% 2,024 5% 0.51 2,996 2.89 44 96.8% 412,100 -3.8% 400,450 -4.1% 468,175 0.7% 168 Mar-11 1,222 -1% 2,176 -18% 0.56 3,454 2.83 39 97.0% 416,000 -4.0% 405,000 -5.4% 467,426 -2.5% 170 Apr-11 1,105 -8% 2,038 -26% 0.54 3,756 3.40 41 97.2% 419,000 -3.8% 423,400 -0.1% 483,091 3.0% 171 May-11 1,187 6% 2,265 -15% 0.52 3,923 3.30 41 97.2% 421,200 -3.3% 425,000 0.1% 496,458 0.8% 172 Jun-11 1,261 34% 2,154 -11% 0.59 4,016 3.18 42 97.0% 423,900 -2.0% 420,000 0.0% 485,394 -0.4% 173 Jul-11 1,041 25% 1,816 4% 0.57 3,940 3.78 48 97.0% 423,700 -0.9% 413,000 1.3% 460,530 -3.0% 173 Aug-11 987 27% 1,858 6% 0.53 3,906 3.96 49 97.1% 422,900 0.5% 409,000 2.3% 457,623 1.2% 172 Sep-11 912 5% 2,036 1% 0.45 4,052 4.44 48 96.8% 421,000 1.3% 405,000 3.3% 476,356 2.2% 172 Oct-11 874 9% 1,586 2% 0.55 3,815 4.36 52 96.7% 420,000 2.2% 398,250 1.9% 460,846 3.2% 171 Nov-11 844 6% 1,131 -2% 0.75 3,211 3.80 51 96.5% 419,000 2.5% 408,000 2.1% 472,712 3.5% 171 Dec-11 629 -4% 644 -2% 0.98 2,349 3.73 58 96.4% 417,000 2.2% 397,000 1.8% 457,969 4.0% 170 2011 11,797 9% 21,462 -6% 0.55 3,495 3.61 46 96.9% 418,525 -1.2% 410,000 0.0% 472,020 1.0% 171 Jan-12 680 -2% 1,535 -11% 0.44 2,508 3.69 58 97.0% 418,500 3.0% 400,000 1.5% 446,090 -3.1% 171 Feb-12 1,125 8% 1,762 -13% 0.64 2,688 2.39 47 97.0% 421,700 2.3% 414,900 3.6% 470,670 0.5% 172 Mar-12 1,413 16% 2,113 -3% 0.67 2,918 2.07 40 97.4% 426,400 2.5% 415,000 2.5% 476,786 2.0% 174 Apr-12 1,435 30% 2,050 1% 0.70 3,049 2.12 38 97.7% 430,500 2.7% 425,000 0.4% 485,615 0.5% 176 May-12 1,553 31% 2,436 8% 0.64 3,338 2.15 36 97.6% 435,900 3.5% 437,000 2.8% 502,903 1.3% 178 Jun-12 1,435 14% 2,062 -4% 0.70 3,299 2.30 36 97.7% 438,600 3.5% 431,500 2.7% 493,227 1.6% 179 Jul-12 1,237 19% 1,695 -7% 0.73 3,182 2.57 40 97.3% 438,600 3.5% 423,000 2.4% 482,989 4.9% 179 Aug-12 1,052 7% 1,589 -14% 0.66 3,063 2.91 42 97.4% 439,800 4.0% 425,000 3.9% 480,001 4.9% 179 Sep-12 1,006 10% 1,680 -17% 0.60 2,977 2.96 42 97.3% 440,100 4.5% 417,000 3.0% 475,772 -0.1% 179 Oct-12 1,056 21% 1,426 -10% 0.74 2,731 2.59 42 97.2% 441,100 5.0% 435,000 9.2% 495,149 7.4% 180 Nov-12 882 5% 989 -13% 0.89 2,298 2.61 50 97.1% 440,800 5.2% 424,000 3.9% 490,496 3.8% 180 Dec-12 657 4% 539 -16% 1.22 1,616 2.46 51 96.8% 441,100 5.8% 420,000 5.8% 500,797 9.4% 180 2012 13,531 15% 19,876 -7% 0.68 2,806 2.57 42 97.4% 434,425 3.8% 423,000 3.2% 484,647 2.7% 177 Jan-13 781 15% 1,523 -1% 0.51 1,792 2.29 47 97.5% 443,300 5.9% 432,500 8.1% 493,638 10.7% 181 Feb-13 1,051 -7% 1,625 -8% 0.65 2,068 1.97 37 97.5% 448,900 6.5% 440,000 6.0% 525,160 11.6% 183 Mar-13 1,304 -8% 2,008 -5% 0.65 2,373 1.82 33 98.0% 454,800 6.7% 450,000 8.4% 518,670 8.8% 185 Apr-13 1,428 0% 2,124 4% 0.67 2,602 1.82 30 97.9% 460,400 6.9% 450,000 5.9% 512,217 5.5% 188 May-13 1,572 1% 2,390 -2% 0.66 2,929 1.86 31 98.0% 465,100 6.7% 459,250 5.1% 527,291 4.8% 190 Jun-13 1,478 3% 1,916 -7% 0.77 2,835 1.92 33 97.7% 468,100 6.7% 456,500 5.8% 536,450 8.8% 191 Jul-13 1,386 12% 1,753 3% 0.79 2,616 1.89 37 97.7% 471,500 7.5% 450,504 6.5% 533,655 10.5% 192 Aug-13 1,351 28% 1,712 8% 0.79 2,429 1.80 37 97.7% 473,200 7.6% 452,500 6.5% 522,010 8.8% 193 Sep-13 1,199 19% 1,715 2% 0.70 2,393 2.00 37 97.9% 474,900 7.9% 455,000 9.1% 517,491 8.8% 194 Oct-13 1,179 12% 1,511 6% 0.78 2,249 1.91 39 97.8% 479,100 8.6% 457,000 5.1% 521,296 5.3% 195 Nov-13 1,042 18% 1,081 9% 0.96 1,886 1.81 39 97.6% 480,600 9.0% 462,750 9.1% 526,696 7.4% 196 Dec-13 674 3% 548 2% 1.23 1,333 1.98 44 97.8% 482,300 9.3% 462,125 10.0% 525,790 5.0% 197 2013 14,445 7% 19,906 0% 0.73 2,292 1.92 36 97.8% 466,850 7.5% 452,500 7.0% 522,686 7.8% 190 Jan-14 857 10% 1,400 -8% 0.61 1,442 1.68 40 98.0% 485,500 9.5% 462,000 6.8% 527,799 6.9% 198 Feb-14 1,081 3% 1,557 -4% 0.69 1,652 1.53 29 98.6% 493,100 9.8% 480,000 9.1% 553,454 5.4% 201 Mar-14 1,506 15% 1,964 -2% 0.77 1,785 1.19 26 98.7% 501,200 10.2% 492,750 9.5% 557,976 7.6% 204 Apr-14 1,538 8% 2,258 6% 0.68 2,248 1.46 25 98.8% 508,000 10.3% 487,750 8.4% 549,798 7.3% 207 May-14 1,775 13% 2,580 8% 0.69 2,673 1.51 25 98.8% 516,100 11.0% 497,000 8.2% 560,965 6.4% 210 Jun-14 1,550 5% 2,283 19% 0.68 2,896 1.87 27 98.4% 521,300 11.4% 493,500 8.1% 566,233 5.6% 213 Jul-14 1,365 -2% 1,864 6% 0.73 2,837 2.08 32 98.2% 523,200 11.0% 488,000 8.3% 559,352 4.8% 213 Aug-14 1,278 -5% 1,793 5% 0.71 2,791 2.18 33 98.0% 523,000 10.5% 480,000 6.1% 548,516 5.1% 213 Sep-14 1,224 2% 1,869 9% 0.65 2,734 2.23 35 97.9% 523,200 10.2% 495,000 8.8% 573,897 10.9% 213 Oct-14 1,293 10% 1,629 8% 0.79 2,543 1.97 36 97.8% 525,000 9.6% 494,500 8.2% 560,561 7.5% 214 Nov-14 1,034 -1% 1,125 4% 0.92 2,159 2.09 38 98.0% 524,700 9.2% 484,393 4.7% 564,407 7.2% 214 Dec-14 603 -11% 756 38% 0.80 1,787 2.96 41 97.5% 523,000 8.4% 475,000 2.8% 550,908 4.8% 213 2014 15,104 5% 21,078 6% 0.72 2,296 1.90 31 98.3% 513,942 10.1% 487,500 7.7% 557,300 6.6% 210
- 7. DETACHED CITY OF CALGARY Sales Y/Y% New Listings Y/Y% S/NL Ratio Inventory Months of Supply DOM SP/LP Benchmark Price Y/Y% Median Price Y/Y% Average Price Y/Y% Index Jan-15 533 -38% 1,834 31% 0.29 2,578 4.84 37 97.6% 525,000 8.1% 481,000 4.1% 525,826 -0.4% 214 Feb-15 739 -32% 1,671 7% 0.44 2,976 4.03 34 97.6% 522,000 5.9% 470,000 -2.1% 526,686 -4.8% 213 Mar-15 1,079 -28% 1,774 -10% 0.61 3,026 2.80 37 97.1% 521,500 4.1% 475,000 -3.6% 545,575 -2.2% 213 Apr-15 1,150 -25% 1,770 -22% 0.65 3,044 2.65 38 97.3% 517,100 1.8% 479,200 -1.8% 545,043 -0.9% 211 May-15 1,362 -23% 1,875 -27% 0.73 2,923 2.15 38 97.6% 517,100 0.2% 485,000 -2.4% 541,951 -3.4% 211 Jun-15 1,331 -14% 1,830 -20% 0.73 2,789 2.10 37 97.7% 518,800 -0.5% 493,400 0.0% 554,022 -2.2% 212 Jul-15 1,220 -11% 1,731 -7% 0.70 2,752 2.26 37 97.6% 520,100 -0.6% 489,000 0.2% 541,693 -3.2% 212 Aug-15 994 -22% 1,643 -8% 0.60 2,833 2.85 37 97.5% 520,100 -0.6% 484,000 0.8% 536,722 -2.2% 212 Sep-15 906 -26% 1,768 -5% 0.51 3,029 3.34 37 97.6% 520,100 -0.6% 475,000 -4.0% 524,987 -8.5% 212 Oct-15 872 -33% 1,441 -12% 0.61 2,921 3.35 38 96.9% 518,300 -1.3% 470,250 -4.9% 519,371 -7.3% 211 Nov-15 798 -23% 1,183 5% 0.67 2,680 3.36 43 96.8% 514,400 -2.0% 465,000 -4.0% 524,211 -7.1% 210 Dec-15 533 -12% 791 5% 0.67 2,132 4.00 47 96.3% 512,500 -2.0% 455,000 -4.2% 533,704 -3.1% 209 2015 11,517 -24% 19,311 -8% 0.60 2,807 3.14 38 97.4% 518,917 1.0% 479,900 -1.6% 537,135 -3.6% 212 Jan-16 466 -13% 1,487 -19% 0.31 2,537 5.44 49 96.0% 507,800 -3.3% 458,750 -4.6% 526,408 0.1% 207 Feb-16 693 -6% 1,611 -4% 0.43 2,953 4.26 38 96.8% 503,600 -3.5% 467,500 -0.5% 541,979 2.9% 205 Mar-16 1,005 -7% 1,818 2% 0.55 3,093 3.08 41 96.9% 502,200 -3.7% 480,000 1.1% 538,481 -1.3% 205 Apr-16 1,136 -1% 1,820 3% 0.62 3,138 2.76 44 97.1% 500,900 -3.1% 483,750 0.9% 541,278 -0.7% 204 May-16 1,213 -11% 1,850 -1% 0.66 3,040 2.51 39 97.2% 501,700 -3.0% 489,000 0.8% 558,922 3.1% 205 Jun-16 1,282 -4% 1,748 -4% 0.73 2,938 2.29 41 97.2% 503,100 -3.0% 489,250 -0.8% 558,046 0.7% 205 Jul-16 1,109 -9% 1,487 -14% 0.75 2,743 2.47 43 97.2% 504,100 -3.1% 480,000 -1.8% 542,456 0.1% 206 Aug-16 983 -1% 1,528 -7% 0.64 2,728 2.78 41 97.2% 506,300 -2.7% 467,500 -3.4% 542,371 1.1% 206 Sep-16 943 4% 1,659 -6% 0.57 2,830 3.00 42 97.3% 505,800 -2.7% 490,000 3.2% 563,643 7.4% 206 Oct-16 1,031 18% 1,326 -8% 0.78 2,574 2.50 42 96.9% 505,100 -2.5% 464,000 -1.3% 529,378 1.9% 206 Nov-16 776 -3% 1,062 -10% 0.73 2,327 3.00 45 96.9% 501,700 -2.5% 485,000 4.3% 557,713 6.4% 205 Dec-16 569 7% 512 -35% 1.11 1,714 3.01 50 96.4% 501,900 -2.1% 480,000 5.5% 574,309 7.6% 205 2016 11,206 -3% 17,908 -7% 0.63 2,718 3.09 42 97.0% 503,683 -2.9% 479,000 -0.2% 548,095 2.0% 205 Jan-17 581 25% 1,228 -17% 0.47 1,848 3.18 47 97.2% 501,400 -1.3% 485,000 5.7% 545,857 3.7% 204 Feb-17 822 19% 1,293 -20% 0.64 1,995 2.43 42 97.3% 501,700 -0.4% 492,250 5.3% 557,661 2.9% 205 Mar-17 1,171 17% 1,796 -1% 0.65 2,324 1.98 38 97.4% 505,300 0.6% 490,000 2.1% 571,725 6.2% 206 Apr-17 1,192 5% 1,861 2% 0.64 2,543 2.13 32 97.8% 506,600 1.1% 502,250 3.8% 562,626 3.9% 207 May-17 1,374 13% 2,239 21% 0.61 2,966 2.16 31 97.8% 511,500 2.0% 510,000 4.3% 580,590 3.9% 209 Jun-17 1,381 8% 2,165 24% 0.64 3,227 2.34 32 98.0% 513,400 2.0% 513,000 4.9% 569,822 2.1% 209 Jul-17 1,011 -9% 1,688 14% 0.60 3,280 3.24 38 97.6% 515,600 2.3% 495,000 3.1% 553,430 2.0% 210 Aug-17 983 0% 1,674 10% 0.59 3,277 3.33 40 97.5% 514,700 1.7% 491,000 5.0% 552,007 1.8% 210 Sep-17 919 -3% 1,870 13% 0.49 3,494 3.80 42 97.4% 512,000 1.2% 482,500 -1.5% 556,463 -1.3% 209 Oct-17 907 -12% 1,484 12% 0.61 3,257 3.59 44 97.3% 509,500 0.9% 474,000 2.2% 544,998 3.0% 208 Nov-17 874 13% 1,122 6% 0.78 2,765 3.16 48 97.2% 507,800 1.2% 465,000 -4.1% 534,454 -4.2% 207 Dec-17 616 8% 675 32% 0.91 2,040 3.31 52 97.2% 502,600 0.1% 461,000 -4.0% 522,626 -9.0% 205 2017 11,831 6% 19,095 7% 0.62 2,751 2.89 39 97.5% 508,508 1.0% 490,000 2.3% 557,622 1.7% 207 Jan-18 584 1% 1,288 5% 0.45 2,200 3.77 55 97.2% 504,100 0.5% 474,000 -2.3% 545,711 0.0% 206 Feb-18 653 -21% 1,295 0% 0.50 2,459 3.77 45 97.3% 507,100 1.1% 497,000 1.0% 575,329 3.2% 207 Mar-18 844 -28% 1,870 4% 0.45 3,079 3.65 37 97.5% 507,800 0.5% 509,450 4.0% 568,654 -0.5% 207 Apr-18 906 -24% 2,005 8% 0.45 3,652 4.03 41 97.4% 509,300 0.5% 495,000 -1.4% 558,840 -0.7% 208 May-18 1,059 -23% 2,660 19% 0.40 4,504 4.25 40 97.3% 507,800 -0.7% 500,000 -2.0% 577,253 -0.6% 207 Jun-18 1,209 -12% 2,304 6% 0.52 4,816 3.98 41 97.0% 507,100 -1.2% 496,500 -3.2% 573,729 0.7% 207 Jul-18 968 -4% 1,731 3% 0.56 4,592 4.74 49 96.6% 504,600 -2.1% 485,000 -2.0% 560,720 1.3% 206 Aug-18 928 -6% 1,820 9% 0.51 4,444 4.79 51 96.6% 500,900 -2.7% 485,000 -1.2% 563,704 2.1% 204 Sep-18 788 -14% 1,784 -5% 0.44 4,354 5.53 52 96.7% 497,000 -2.9% 470,500 -2.5% 539,455 -3.1% 203 Oct-18 829 -9% 1,388 -6% 0.60 3,985 4.81 57 96.4% 494,100 -3.0% 470,000 -0.8% 543,462 -0.3% 201 Nov-18 680 -22% 1,087 -3% 0.63 3,506 5.16 60 96.4% 491,400 -3.2% 455,500 -2.0% 532,883 -0.3% 200 Dec-18 496 -19% 574 -15% 0.86 2,598 5.24 66 96.2% 486,200 -3.3% 450,000 -2.4% 511,103 -2.2% 198 2018 9,944 -16% 19,806 4% 0.50 3,682 4.48 48 96.9% 501,450 -1.4% 484,000 -1.2% 557,419 0.0% 204 Jan-19 486 -17% 1,358 5% 0.36 2,844 5.85 67 96.0% 482,000 -4.4% 443,950 -6.3% 521,285 -4.5% 197 Feb-19 590 -10% 1,181 -9% 0.50 2,995 5.08 63 96.4% 480,600 -5.2% 459,950 -7.5% 541,144 -5.9% 196 Mar-19 816 -3% 1,700 -9% 0.48 3,397 4.16 57 96.6% 481,500 -5.2% 460,000 -9.7% 528,494 -7.1% 196 Apr-19 928 2% 1,787 -11% 0.52 3,698 3.98 49 96.8% 484,200 -4.9% 475,000 -4.0% 545,216 -2.4% 197 May-19 1,181 12% 2,017 -24% 0.59 3,921 3.32 50 96.7% 487,900 -3.9% 480,000 -4.0% 557,179 -3.5% 199 Jun-19 Jul-19 Aug-19 Sep-19 Oct-19 Nov-19 Dec-19 2019 4,001 -59% 8,043 -58% 0.50 3,371 4.48 55 96.6% 483,240 -3.6% 467,500 -3.4% 542,380 -2.7% 197
- 8. DETACHED CITY OF CALGARY -20% -15% -10% -5% 0% 5% 10% 15% - 1 2 3 4 5 6 MONTHS OF SUPPLY AND PRICE CHANGE Months of Supply trend (12 M) Benchmark price y/y % Change Source: CREB® 0 1,000 2,000 3,000 4,000 5,000 6,000 0% 10% 20% 30% 40% 50% 60% 70% 80% 90% SALES TO NEW LISTINGS RATIO AND INVENTORY Inventory Sales to New listings ratio trend (12 M) Inventory Trend (12 M) Source: CREB® 0 100,000 200,000 300,000 400,000 500,000 600,000 700,000 PRICE COMPARISON Average Median Benchmark Source: CREB® - 10 20 30 40 50 60 DAYS ON MARKET Days on market trend (12 M) Source: CREB® 465,000 470,000 475,000 480,000 485,000 490,000 495,000 500,000 505,000 510,000 0 1,000 2,000 3,000 4,000 5,000 6,000 May. '18 Jun. '18 Jul. '18 Aug. '18 Sep. '18 Oct. '18 Nov. '18 Dec. '18 Jan. '19 Feb. '19 Mar. '19 Apr. '19 May. '19 INVENTORY, SALES AND PRICE Inventory Sales Benchmark Price Source: CREB® 0 1 2 3 4 5 6 7 8 <$200,000 $200,000 - $299,999 $300,000 - $399,999 $400,000 - $499,999 $500,000 - $599,999 $600,000 - $699,999 $700,000 - 999,999 $1,000,000+ MONTHS OF SUPPLY BY PRICE RANGE May-16 May-17 May-18 May-19 Source: CREB® May
- 9. DETACHED CITY OF CALGARY - 200 400 600 800 1,000 1,200 1,400 1,600 Jan. Feb. Mar. Apr. May Jun. Jul. Aug. Sept. Oct. Nov. Dec. SALES COMPARISON 2019 2018 2017 2016 Source: CREB® 0 200 400 600 800 1,000 1,200 1,400 1,600 1,800 <$200,000 $200,000 - $299,999 $300,000 - $399,999 $400,000 - $499,999 $500,000 - $599,999 $600,000 - $699,999 $700,000 - 999,999 $1,000,000+ YTD SALES BY PRICE RANGE YTD-2016 YTD-2017 YTD-2018 YTD-2019 Source: CREB® YTD-MAY 0 500 1,000 1,500 2,000 2,500 3,000 <$200,000 $200,000 - $299,999 $300,000 - $399,999 $400,000 - $499,999 $500,000 - $599,999 $600,000 - $699,999 $700,000 - 999,999 $1,000,000+ YTD NEW LISTINGS BY PRICE RANGE YTD-2016 YTD-2017 YTD-2018 YTD-2019 Source: CREB® YTD-MAY 0 200 400 600 800 1,000 1,200 <$200,000 $200,000 - $299,999 $300,000 - $399,999 $400,000 - $499,999 $500,000 - $599,999 $600,000 - $699,999 $700,000 - 999,999 $1,000,000+ INVENTORY BY PRICE RANGE May-16 May-17 May-18 May-19 Source: CREB® May - 500 1,000 1,500 2,000 2,500 3,000 Jan. Feb. Mar. Apr. May Jun. Jul. Aug. Sept. Oct. Nov. Dec. NEW LISTINGS COMPARISON 2019 2018 2017 2016 Source: CREB® - 1,000 2,000 3,000 4,000 5,000 6,000 Jan. Feb. Mar. Apr. May Jun. Jul. Aug. Sept. Oct. Nov. Dec. INVENTORY COMPARISON 2019 2018 2017 2016 Source: CREB®
- 10. APARTMENT CITY OF CALGARY Sales Y/Y% New Listings Y/Y% S/NL Ratio Inventory Months of Supply DOM SP/LP Benchmark Price Y/Y% Median Price Y/Y% Average Price Y/Y% Index Jan-10 219 77% 611 5% 0.36 929 4.24 51 96.7% 245,700 0.7% 250,000 8.6% 266,270 6.1% 170 Feb-10 324 71% 707 31% 0.46 1,162 3.59 46 96.8% 248,600 3.9% 248,000 5.5% 261,056 2.7% 172 Mar-10 343 28% 852 49% 0.40 1,424 4.15 44 97.0% 249,800 5.4% 257,000 4.5% 272,307 1.5% 173 Apr-10 370 7% 820 41% 0.45 1,562 4.22 45 96.7% 250,200 6.6% 246,892 7.3% 270,068 4.2% 173 May-10 297 -22% 742 24% 0.40 1,661 5.59 45 97.0% 251,500 6.9% 266,000 9.8% 283,058 9.1% 174 Jun-10 272 -34% 656 17% 0.41 1,607 5.91 50 96.5% 249,800 5.3% 251,250 1.0% 280,246 4.5% 173 Jul-10 215 -47% 549 -4% 0.39 1,538 7.15 51 96.0% 249,200 5.0% 250,000 4.2% 271,904 3.4% 172 Aug-10 207 -43% 485 -5% 0.43 1,424 6.88 56 96.1% 246,400 2.8% 238,000 -3.8% 266,990 -0.4% 170 Sep-10 223 -32% 579 -1% 0.39 1,409 6.32 55 95.7% 245,700 2.2% 252,500 3.4% 275,530 1.5% 170 Oct-10 184 -50% 401 -25% 0.46 1,256 6.83 60 95.5% 245,000 1.4% 232,750 -5.4% 268,428 -1.5% 169 Nov-10 181 -46% 406 -9% 0.45 1,178 6.51 59 95.2% 241,100 -1.1% 226,000 -11.4% 256,756 -10.8% 167 Dec-10 196 -5% 230 -22% 0.85 885 4.52 65 95.9% 238,500 -2.7% 236,250 -7.7% 266,688 -4.3% 165 2010 3,031 -19% 7,038 10% 0.43 1,336 5.49 51 96.4% 246,792 3.0% 248,993 2.0% 270,479 1.1% 171 Jan-11 187 -15% 529 -13% 0.35 951 5.09 63 95.4% 237,800 -3.2% 235,000 -6.0% 285,464 7.2% 164 Feb-11 285 -12% 585 -17% 0.49 1,044 3.66 53 96.8% 239,100 -3.8% 245,000 -1.2% 279,277 7.0% 165 Mar-11 334 -3% 600 -30% 0.56 1,149 3.44 49 96.5% 241,000 -3.5% 236,250 -8.1% 260,358 -4.4% 167 Apr-11 313 -15% 570 -30% 0.55 1,204 3.85 52 96.8% 241,700 -3.4% 245,000 -0.8% 283,851 5.1% 167 May-11 294 -1% 615 -17% 0.48 1,266 4.31 52 96.4% 242,000 -3.8% 248,450 -6.6% 267,072 -5.6% 167 Jun-11 342 26% 581 -11% 0.59 1,238 3.62 52 96.7% 242,800 -2.8% 253,250 0.8% 275,531 -1.7% 168 Jul-11 251 17% 498 -9% 0.50 1,245 4.96 50 96.6% 241,700 -3.0% 258,500 3.4% 270,988 -0.3% 167 Aug-11 287 39% 517 7% 0.56 1,222 4.26 56 96.5% 239,800 -2.7% 237,000 -0.4% 263,203 -1.4% 166 Sep-11 237 6% 549 -5% 0.43 1,235 5.21 59 95.9% 240,800 -2.0% 235,000 -6.9% 274,760 -0.3% 167 Oct-11 216 17% 468 17% 0.46 1,213 5.62 60 95.9% 239,600 -2.2% 245,257 5.4% 274,265 2.2% 166 Nov-11 243 34% 343 -16% 0.71 1,067 4.39 56 96.2% 239,100 -0.8% 229,000 1.3% 255,158 -0.6% 165 Dec-11 186 -5% 200 -13% 0.93 815 4.38 67 95.8% 234,200 -1.8% 245,000 3.7% 268,769 0.8% 162 2011 3,175 5% 6,055 -14% 0.52 1,137 4.40 55 96.4% 239,967 -2.8% 242,000 -2.8% 271,320 0.3% 166 Jan-12 180 -4% 513 -3% 0.35 941 5.23 64 96.3% 232,000 -2.4% 220,000 -6.4% 247,255 -13.4% 160 Feb-12 250 -12% 515 -12% 0.49 1,033 4.13 51 97.0% 236,000 -1.3% 257,250 5.0% 289,495 3.7% 163 Mar-12 360 8% 650 8% 0.55 1,123 3.12 48 96.8% 237,300 -1.5% 250,000 5.8% 271,725 4.4% 164 Apr-12 357 14% 603 6% 0.59 1,145 3.21 50 96.9% 240,400 -0.5% 245,000 0.0% 269,196 -5.2% 166 May-12 395 34% 653 6% 0.60 1,204 3.05 50 97.1% 244,100 0.9% 253,000 1.8% 279,551 4.7% 169 Jun-12 345 1% 551 -5% 0.63 1,200 3.48 54 96.7% 245,900 1.3% 260,000 2.7% 302,597 9.8% 170 Jul-12 315 25% 476 -4% 0.66 1,170 3.71 54 96.7% 247,200 2.3% 247,000 -4.4% 285,107 5.2% 171 Aug-12 317 10% 470 -9% 0.67 1,057 3.33 52 97.2% 246,700 2.9% 255,000 7.6% 282,206 7.2% 171 Sep-12 278 17% 503 -8% 0.55 1,049 3.77 54 96.6% 246,400 2.3% 250,250 6.5% 285,830 4.0% 170 Oct-12 273 26% 421 -10% 0.65 995 3.64 55 96.5% 246,200 2.8% 250,000 1.9% 289,199 5.4% 170 Nov-12 259 7% 287 -16% 0.90 845 3.26 59 96.5% 246,000 2.9% 260,000 13.5% 308,732 21.0% 170 Dec-12 220 18% 147 -27% 1.50 583 2.65 67 96.4% 246,700 5.3% 260,000 6.1% 305,218 13.6% 171 2012 3,549 12% 5,789 -4% 0.61 1,029 3.55 54 96.8% 242,908 1.2% 251,500 3.9% 284,703 4.9% 168 Jan-13 206 14% 458 -11% 0.45 667 3.24 62 96.8% 249,200 7.4% 245,000 11.4% 279,562 13.1% 172 Feb-13 282 13% 455 -12% 0.62 715 2.54 44 97.2% 251,100 6.4% 258,250 0.4% 287,612 -0.7% 174 Mar-13 350 -3% 571 -12% 0.61 794 2.27 42 97.0% 255,300 7.6% 260,000 4.0% 303,395 11.7% 177 Apr-13 439 23% 634 5% 0.69 863 1.97 40 97.0% 259,600 8.0% 255,500 4.3% 291,307 8.2% 180 May-13 420 6% 642 -2% 0.65 931 2.22 35 97.7% 260,900 6.9% 259,950 2.7% 311,136 11.3% 180 Jun-13 361 5% 496 -10% 0.73 881 2.44 38 97.6% 262,400 6.7% 265,000 1.9% 301,947 -0.2% 181 Jul-13 404 28% 473 -1% 0.85 800 1.98 49 97.3% 263,500 6.6% 262,000 6.1% 301,331 5.7% 182 Aug-13 402 27% 453 -4% 0.89 711 1.77 43 97.5% 265,100 7.5% 260,000 2.0% 297,526 5.4% 183 Sep-13 325 17% 463 -8% 0.70 697 2.14 39 97.6% 268,300 8.9% 274,000 9.5% 299,014 4.6% 186 Oct-13 339 24% 451 7% 0.75 682 2.01 43 97.4% 272,800 10.8% 272,000 8.8% 309,309 7.0% 189 Nov-13 305 18% 357 24% 0.85 610 2.00 43 97.2% 274,800 11.7% 270,000 3.8% 306,940 -0.6% 190 Dec-13 223 1% 213 45% 1.05 475 2.13 51 97.3% 276,400 12.0% 254,000 -2.3% 296,314 -2.9% 191 2013 4,056 14% 5,666 -2% 0.72 736 2.23 43 97.3% 263,283 8.4% 261,000 3.8% 299,685 5.3% 182 Jan-14 263 28% 490 7% 0.54 558 2.12 43 97.7% 277,000 11.2% 277,000 13.1% 314,971 12.7% 192 Feb-14 360 28% 579 27% 0.62 670 1.86 33 98.0% 279,300 11.2% 289,950 12.3% 327,288 13.8% 193 Mar-14 453 29% 671 18% 0.68 781 1.72 31 98.3% 282,500 10.7% 286,000 10.0% 310,733 2.4% 195 Apr-14 454 3% 692 9% 0.66 933 2.06 34 98.4% 286,800 10.5% 282,750 10.7% 319,780 9.8% 198 May-14 515 23% 817 27% 0.63 1,106 2.15 33 98.1% 292,000 11.9% 284,000 9.3% 315,845 1.5% 202 Jun-14 480 33% 719 45% 0.67 1,128 2.35 38 98.3% 296,200 12.9% 282,500 6.6% 351,661 16.5% 205 Jul-14 447 11% 664 40% 0.67 1,134 2.54 40 97.5% 294,900 11.9% 284,000 8.4% 322,481 7.0% 204 Aug-14 456 13% 654 44% 0.70 1,116 2.45 40 97.7% 297,500 12.2% 287,750 10.7% 329,704 10.8% 206 Sep-14 435 34% 691 49% 0.63 1,135 2.61 39 97.8% 300,100 11.9% 293,500 7.1% 325,325 8.8% 208 Oct-14 387 14% 622 38% 0.62 1,141 2.95 40 97.7% 300,400 10.1% 283,000 4.0% 322,515 4.3% 208 Nov-14 324 6% 470 32% 0.69 1,038 3.20 42 97.5% 299,800 9.1% 290,000 7.4% 321,906 4.9% 207 Dec-14 222 0% 303 42% 0.73 851 3.83 46 97.2% 298,800 8.1% 288,900 13.7% 318,652 7.5% 207 2014 4,796 18% 7,372 30% 0.65 966 2.49 38 97.9% 292,108 10.9% 285,000 9.2% 324,004 8.1% 202
- 11. APARTMENT CITY OF CALGARY Sales Y/Y% New Listings Y/Y% S/NL Ratio Inventory Months of Supply DOM SP/LP Benchmark Price Y/Y% Median Price Y/Y% Average Price Y/Y% Index Jan-15 154 -41% 744 52% 0.21 1,197 7.77 55 96.8% 299,400 8.1% 268,875 -2.9% 305,473 -3.0% 207 Feb-15 215 -40% 593 2% 0.36 1,338 6.22 40 97.2% 297,500 6.5% 267,500 -7.7% 307,444 -6.1% 206 Mar-15 302 -33% 671 0% 0.45 1,426 4.72 43 97.0% 294,800 4.4% 271,500 -5.1% 306,007 -1.5% 204 Apr-15 351 -23% 607 -12% 0.58 1,366 3.89 45 96.9% 291,400 1.6% 274,500 -2.9% 301,606 -5.7% 202 May-15 359 -30% 613 -25% 0.59 1,309 3.65 48 97.0% 291,700 -0.1% 280,500 -1.2% 327,497 3.7% 202 Jun-15 398 -17% 610 -15% 0.65 1,211 3.04 48 97.2% 292,900 -1.1% 274,500 -2.8% 321,632 -8.5% 203 Jul-15 324 -28% 581 -13% 0.56 1,243 3.84 47 97.1% 292,600 -0.8% 284,500 0.2% 311,631 -3.4% 202 Aug-15 281 -38% 514 -21% 0.55 1,226 4.36 47 96.9% 292,900 -1.5% 266,000 -7.6% 295,627 -10.3% 203 Sep-15 257 -41% 655 -5% 0.39 1,292 5.03 49 96.6% 290,700 -3.1% 265,000 -9.7% 295,954 -9.0% 201 Oct-15 237 -39% 587 -6% 0.40 1,365 5.76 50 96.8% 289,100 -3.8% 286,000 1.1% 318,210 -1.3% 200 Nov-15 194 -40% 488 4% 0.40 1,352 6.97 50 96.5% 288,200 -3.9% 272,250 -6.1% 299,837 -6.9% 199 Dec-15 152 -32% 343 13% 0.44 1,119 7.36 56 96.1% 284,200 -4.9% 287,000 -0.7% 305,041 -4.3% 197 2015 3,224 -33% 7,006 -5% 0.46 1,287 5.22 48 96.9% 292,117 0.0% 274,000 -3.9% 309,259 -4.6% 202 Jan-16 129 -16% 598 -20% 0.22 1,252 9.71 59 95.8% 280,600 -6.3% 251,000 -6.6% 280,088 -8.3% 194 Feb-16 168 -22% 636 7% 0.26 1,389 8.27 50 96.4% 282,300 -5.1% 268,000 0.2% 307,461 0.0% 195 Mar-16 257 -15% 679 1% 0.38 1,529 5.95 48 96.4% 279,100 -5.3% 272,000 0.2% 298,072 -2.6% 193 Apr-16 272 -23% 666 10% 0.41 1,583 5.82 54 96.2% 277,100 -4.9% 278,250 1.4% 302,417 0.3% 192 May-16 276 -23% 685 12% 0.40 1,610 5.83 49 96.5% 275,400 -5.6% 280,000 -0.2% 312,753 -4.5% 190 Jun-16 310 -22% 604 -1% 0.51 1,544 4.98 71 96.3% 275,700 -5.9% 267,500 -2.6% 309,631 -3.7% 191 Jul-16 254 -22% 618 6% 0.41 1,557 6.13 57 97.1% 274,400 -6.2% 269,950 -5.1% 352,098 13.0% 190 Aug-16 267 -5% 616 20% 0.43 1,577 5.91 60 96.2% 271,900 -7.2% 271,500 2.1% 316,842 7.2% 188 Sep-16 200 -22% 636 -3% 0.31 1,651 8.26 56 96.2% 271,300 -6.7% 280,000 5.7% 303,202 2.4% 188 Oct-16 250 5% 508 -13% 0.49 1,542 6.17 54 96.3% 270,500 -6.4% 250,000 -12.6% 288,396 -9.4% 187 Nov-16 195 1% 455 -7% 0.43 1,432 7.34 58 95.5% 268,400 -6.9% 255,000 -6.3% 297,710 -0.7% 186 Dec-16 146 -4% 240 -30% 0.61 1,109 7.60 71 95.5% 265,500 -6.6% 249,500 -13.1% 302,355 -0.9% 184 2016 2,724 -16% 6,941 -1% 0.39 1,481 6.83 57 96.3% 274,350 -6.1% 269,202 -1.8% 307,606 -0.5% 190 Jan-17 151 17% 623 4% 0.24 1,266 8.38 68 96.0% 264,100 -5.9% 258,500 3.0% 282,429 0.8% 183 Feb-17 235 40% 583 -8% 0.40 1,390 5.91 66 96.2% 263,500 -6.7% 275,000 2.6% 314,498 2.3% 182 Mar-17 297 16% 726 7% 0.41 1,578 5.31 56 96.4% 265,100 -5.0% 251,500 -7.5% 280,130 -6.0% 183 Apr-17 283 4% 691 4% 0.41 1,653 5.84 49 96.8% 264,400 -4.6% 267,000 -4.0% 303,361 0.3% 183 May-17 282 2% 768 12% 0.37 1,781 6.32 55 96.5% 266,400 -3.3% 270,000 -3.6% 296,999 -5.0% 184 Jun-17 284 -8% 729 21% 0.39 1,871 6.59 55 96.5% 265,100 -3.8% 274,000 2.4% 323,341 4.4% 183 Jul-17 254 0% 614 -1% 0.41 1,813 7.14 59 96.8% 265,700 -3.2% 257,750 -4.5% 286,643 -18.6% 184 Aug-17 248 -7% 644 5% 0.39 1,767 7.13 60 96.5% 262,600 -3.4% 255,000 -6.1% 285,254 -10.0% 182 Sep-17 209 4% 629 -1% 0.33 1,774 8.49 56 96.7% 263,400 -2.9% 247,500 -11.6% 283,796 -6.4% 182 Oct-17 234 -6% 501 -1% 0.47 1,640 7.01 67 95.6% 261,100 -3.5% 256,000 2.4% 290,016 0.6% 181 Nov-17 224 15% 446 -2% 0.50 1,495 6.67 66 95.8% 258,700 -3.6% 251,000 -1.6% 277,269 -6.9% 179 Dec-17 170 16% 261 9% 0.65 1,183 6.96 81 96.0% 257,400 -3.1% 250,000 0.2% 271,340 -10.3% 178 2017 2,871 5% 7,215 4% 0.40 1,601 6.81 60 96.4% 263,125 -4.1% 260,000 -3.4% 292,633 -4.9% 182 Jan-18 145 -4% 588 -6% 0.25 1,290 8.90 76 96.4% 256,000 -3.1% 255,000 -1.4% 298,942 5.8% 177 Feb-18 197 -16% 544 -7% 0.36 1,436 7.29 68 95.9% 255,300 -3.1% 270,000 -1.8% 325,905 3.6% 177 Mar-18 219 -26% 721 -1% 0.30 1,695 7.74 64 96.6% 256,000 -3.4% 252,500 0.4% 300,005 7.1% 177 Apr-18 261 -8% 725 5% 0.36 1,853 7.10 59 96.0% 255,800 -3.3% 255,000 -4.5% 286,118 -5.7% 177 May-18 282 0% 776 1% 0.36 1,924 6.82 59 96.3% 255,600 -4.1% 250,000 -7.4% 289,715 -2.5% 177 Jun-18 292 3% 659 -10% 0.44 1,877 6.43 59 95.6% 258,300 -2.6% 260,500 -4.9% 290,344 -10.2% 179 Jul-18 254 0% 541 -12% 0.47 1,781 7.01 62 96.4% 258,200 -2.8% 245,000 -4.9% 280,879 -2.0% 179 Aug-18 242 -2% 546 -15% 0.44 1,668 6.89 71 96.2% 257,000 -2.1% 258,000 1.2% 294,787 3.3% 178 Sep-18 212 1% 560 -11% 0.38 1,624 7.66 66 96.1% 256,400 -2.7% 252,250 1.9% 300,967 6.1% 177 Oct-18 213 -9% 473 -6% 0.45 1,508 7.08 69 95.7% 256,600 -1.7% 255,000 -0.4% 286,192 -1.3% 177 Nov-18 239 7% 345 -23% 0.69 1,325 5.54 65 95.4% 252,400 -2.4% 242,000 -3.6% 275,078 -0.8% 175 Dec-18 105 -38% 213 -18% 0.49 1,030 9.81 74 95.2% 251,200 -2.4% 240,000 -4.0% 283,916 4.6% 174 2018 2,661 -7% 6,691 -7% 0.40 1,584 7.36 65 96.0% 255,733 -2.8% 252,500 -2.9% 292,149 -0.2% 177 Jan-19 125 -14% 515 -12% 0.24 1,178 9.42 80 94.9% 251,100 -1.9% 225,000 -11.8% 271,209 -9.3% 174 Feb-19 150 -24% 449 -17% 0.33 1,301 8.67 71 94.7% 250,800 -1.8% 250,000 -7.4% 285,468 -12.4% 173 Mar-19 189 -14% 578 -20% 0.33 1,496 7.92 74 96.0% 249,600 -2.5% 249,000 -1.4% 294,108 -2.0% 173 Apr-19 251 -4% 564 -22% 0.45 1,550 6.18 68 95.8% 249,800 -2.3% 230,000 -9.8% 263,009 -8.1% 173 May-19 315 12% 625 -19% 0.50 1,653 5.25 70 96.1% 248,200 -2.9% 242,000 -3.2% 268,028 -7.5% 172 Jun-19 Jul-19 Aug-19 Sep-19 Oct-19 Nov-19 Dec-19 2019 1,030 -60% 2,731 -58% 0.38 1,436 7.49 71 95.7% 249,900 -2.3% 240,000 -5.0% 274,019 -6.2% 173
- 12. APARTMENT CITY OF CALGARY -20% -15% -10% -5% 0% 5% 10% 15% - 1 2 3 4 5 6 7 8 MONTHS OF SUPPLY AND PRICE CHANGE Months of Supply trend (12 M) Benchmark price y/y % Change Source: CREB® 0 500 1,000 1,500 2,000 2,500 0% 10% 20% 30% 40% 50% 60% 70% 80% 90% SALES TO NEW LISTINGS RATIO AND INVENTORY Inventory Sales to New listings ratio trend (12 M) Inventory Trend (12 M) Source: CREB® 0 50,000 100,000 150,000 200,000 250,000 300,000 350,000 400,000 PRICE COMPARISON Average Median Benchmark Source: CREB® - 10 20 30 40 50 60 70 80 DAYS ON MARKET Days on market trend (12 M) Source: CREB® 242,000 244,000 246,000 248,000 250,000 252,000 254,000 256,000 258,000 260,000 0 500 1,000 1,500 2,000 2,500 May. '18 Jun. '18 Jul. '18 Aug. '18 Sep. '18 Oct. '18 Nov. '18 Dec. '18 Jan. '19 Feb. '19 Mar. '19 Apr. '19 May. '19 INVENTORY, SALES AND PRICE Inventory Sales Benchmark Price Source: CREB® 0 5 10 15 20 25 30 35 <$200,000 $200,000 - $299,999 $300,000 - $399,999 $400,000 - $499,999 $500,000 - $599,999 $600,000 - $699,999 $700,000 - 999,999 $1,000,000+ MONTHS OF SUPPLY BY PRICE RANGE May-16 May-17 May-18 May-19 Source: CREB® May
- 13. APARTMENT CITY OF CALGARY - 50 100 150 200 250 300 350 Jan. Feb. Mar. Apr. May Jun. Jul. Aug. Sept. Oct. Nov. Dec. SALES COMPARISON 2019 2018 2017 2016 Source: CREB® 0 100 200 300 400 500 600 <$200,000 $200,000 - $299,999 $300,000 - $399,999 $400,000 - $499,999 $500,000 - $599,999 $600,000 - $699,999 $700,000 - 999,999 $1,000,000+ YTD SALES BY PRICE RANGE YTD-2016 YTD-2017 YTD-2018 YTD-2019 Source: CREB® YTD-MAY 0 200 400 600 800 1,000 1,200 1,400 1,600 1,800 <$200,000 $200,000 - $299,999 $300,000 - $399,999 $400,000 - $499,999 $500,000 - $599,999 $600,000 - $699,999 $700,000 - 999,999 $1,000,000+ YTD NEW LISTINGS BY PRICE RANGE YTD-2016 YTD-2017 YTD-2018 YTD-2019 Source: CREB® YTD-MAY 0 100 200 300 400 500 600 700 800 900 <$200,000 $200,000 - $299,999 $300,000 - $399,999 $400,000 - $499,999 $500,000 - $599,999 $600,000 - $699,999 $700,000 - 999,999 $1,000,000+ INVENTORY BY PRICE RANGE May-16 May-17 May-18 May-19 Source: CREB® May - 100 200 300 400 500 600 700 800 900 Jan. Feb. Mar. Apr. May Jun. Jul. Aug. Sept. Oct. Nov. Dec. NEW LISTINGS COMPARISON 2019 2018 2017 2016 Source: CREB® - 500 1,000 1,500 2,000 2,500 Jan. Feb. Mar. Apr. May Jun. Jul. Aug. Sept. Oct. Nov. Dec. INVENTORY COMPARISON 2019 2018 2017 2016 Source: CREB®
- 14. SEMI DETACHED CITY OF CALGARY Sales Y/Y% New Listings Y/Y% S/NL Ratio Inventory Months of Supply DOM SP/LP Benchmark Price Y/Y% Median Price Y/Y% Average Price Y/Y% Index Share of Sales Condo Jan-10 87 58% 218 -4% 0.40 292 3.36 49 97.5% 344,700 4.3% 300,000 -4.3% 359,561 -3.0% 174 16% Feb-10 112 81% 216 5% 0.52 339 3.03 39 97.4% 349,600 7.4% 327,500 9.2% 390,153 5.4% 177 21% Mar-10 153 55% 302 53% 0.51 419 2.74 37 97.6% 354,400 9.8% 315,500 8.3% 388,293 12.3% 179 15% Apr-10 147 18% 297 34% 0.49 479 3.26 37 97.3% 357,300 11.4% 308,000 -15.5% 388,188 -6.2% 181 12% May-10 136 -3% 294 22% 0.46 527 3.88 42 97.2% 361,700 12.2% 321,750 10.9% 418,793 12.6% 183 10% Jun-10 118 -31% 285 14% 0.41 587 4.97 45 96.8% 370,200 13.2% 340,000 -6.3% 443,848 6.9% 187 10% Jul-10 75 -57% 189 -12% 0.40 547 7.29 43 96.5% 367,000 11.4% 295,000 -4.8% 349,257 -7.3% 186 13% Aug-10 96 -38% 211 3% 0.45 513 5.34 46 96.5% 359,100 7.8% 316,250 -8.3% 385,222 -6.8% 182 14% Sep-10 84 -40% 217 10% 0.39 493 5.87 54 96.7% 355,000 5.9% 347,000 6.2% 414,968 4.7% 179 12% Oct-10 87 -34% 199 -10% 0.44 492 5.66 52 96.3% 348,800 3.2% 370,000 26.1% 423,922 13.9% 176 16% Nov-10 93 -25% 157 15% 0.59 444 4.77 56 97.0% 351,200 3.0% 368,000 16.5% 444,829 14.8% 178 11% Dec-10 83 -15% 85 0% 0.98 312 3.76 60 96.4% 352,800 2.9% 340,000 6.4% 439,785 10.9% 178 18% 2010 1,271 -14% 2,670 11% 0.48 454 4.49 45 97.0% 355,983 7.6% 320,800 1.5% 404,065 3.9% 180 14% Jan-11 87 0% 232 6% 0.38 344 3.95 67 96.3% 350,400 1.7% 315,000 5.0% 397,644 10.6% 177 16% Feb-11 130 16% 229 6% 0.57 401 3.08 49 97.3% 344,900 -1.3% 341,000 4.1% 397,634 1.9% 174 12% Mar-11 122 -20% 262 -13% 0.47 462 3.79 42 97.1% 350,000 -1.2% 325,500 3.2% 387,795 -0.1% 177 13% Apr-11 121 -18% 260 -12% 0.47 505 4.17 40 97.4% 352,600 -1.3% 348,000 13.0% 424,015 9.2% 178 16% May-11 133 -2% 280 -5% 0.48 538 4.05 37 97.8% 358,500 -0.9% 350,000 8.8% 409,582 -2.2% 181 16% Jun-11 141 19% 250 -12% 0.56 552 3.91 47 97.6% 359,300 -2.9% 328,500 -3.4% 405,754 -8.6% 182 21% Jul-11 100 33% 220 16% 0.45 541 5.41 54 97.3% 355,200 -3.2% 330,000 11.9% 410,073 17.4% 180 7% Aug-11 126 31% 245 16% 0.51 528 4.19 51 96.7% 352,800 -1.8% 320,000 1.2% 423,838 10.0% 178 14% Sep-11 145 73% 288 33% 0.50 549 3.79 53 96.6% 355,600 0.2% 320,000 -7.8% 382,558 -7.8% 180 18% Oct-11 115 32% 206 4% 0.56 512 4.45 53 97.0% 352,000 0.9% 350,000 -5.4% 410,590 -3.1% 178 8% Nov-11 111 19% 142 -10% 0.78 447 4.03 56 97.4% 347,500 -1.1% 320,900 -12.8% 409,319 -8.0% 176 13% Dec-11 93 12% 113 33% 0.82 363 3.90 59 97.1% 355,000 0.6% 339,500 -0.1% 422,611 -3.9% 179 6% 2011 1,424 12% 2,727 2% 0.52 479 4.06 50 97.2% 352,817 -0.9% 333,250 3.9% 406,199 0.5% 178 14% Jan-12 83 -5% 190 -18% 0.44 384 4.63 68 96.9% 354,600 1.2% 312,000 -1.0% 401,711 1.0% 179 10% Feb-12 154 18% 250 9% 0.62 410 2.66 57 97.8% 355,000 2.9% 350,500 2.8% 449,734 13.1% 179 10% Mar-12 175 43% 231 -12% 0.76 397 2.27 42 97.8% 355,600 1.6% 328,000 0.8% 427,946 10.4% 180 14% Apr-12 158 31% 239 -8% 0.66 397 2.51 41 97.9% 356,200 1.0% 351,000 0.9% 442,904 4.5% 180 14% May-12 163 23% 286 2% 0.57 450 2.76 46 98.1% 358,100 -0.1% 431,000 23.1% 486,549 18.8% 181 15% Jun-12 182 29% 308 23% 0.59 472 2.59 40 97.8% 358,700 -0.2% 343,500 4.6% 449,961 10.9% 181 13% Jul-12 152 52% 201 -9% 0.76 442 2.91 45 97.7% 361,700 1.8% 338,250 2.5% 426,075 3.9% 183 14% Aug-12 132 5% 226 -8% 0.58 434 3.29 45 97.6% 360,900 2.3% 342,000 6.9% 415,751 -1.9% 182 19% Sep-12 126 -13% 221 -23% 0.57 406 3.22 39 97.6% 360,300 1.3% 327,946 2.5% 403,162 5.4% 182 10% Oct-12 127 10% 202 -2% 0.63 396 3.12 47 97.7% 358,900 2.0% 372,500 6.4% 463,586 12.9% 181 17% Nov-12 133 20% 169 19% 0.79 336 2.53 43 97.6% 360,700 3.8% 353,000 10.0% 461,608 12.8% 182 11% Dec-12 88 -5% 90 -20% 0.98 257 2.92 50 97.5% 356,600 0.5% 366,143 7.8% 453,597 7.3% 180 7% 2012 1,673 17% 2,613 -4% 0.64 398 2.95 46 97.7% 358,108 1.5% 345,000 3.5% 441,899 8.8% 181 13% Jan-13 102 23% 220 16% 0.46 286 2.80 48 98.1% 360,300 1.6% 451,000 44.6% 499,330 24.3% 182 12% Feb-13 157 2% 261 4% 0.60 330 2.10 37 97.7% 361,700 1.9% 378,500 8.0% 477,076 6.1% 183 10% Mar-13 183 5% 257 11% 0.71 359 1.96 32 98.2% 365,500 2.8% 474,000 44.5% 520,978 21.7% 185 11% Apr-13 189 20% 300 26% 0.63 394 2.08 39 98.2% 368,600 3.5% 411,500 17.2% 490,790 10.8% 186 12% May-13 206 26% 295 3% 0.70 409 1.99 30 98.1% 372,400 4.0% 345,500 -19.8% 447,749 -8.0% 188 14% Jun-13 177 -3% 260 -16% 0.68 387 2.19 38 98.3% 373,400 4.1% 367,500 7.0% 445,728 -0.9% 189 17% Jul-13 197 30% 224 11% 0.88 338 1.72 38 98.0% 374,000 3.4% 384,000 13.5% 464,218 9.0% 189 11% Aug-13 174 32% 259 15% 0.67 347 1.99 35 98.4% 376,100 4.2% 385,000 12.6% 466,586 12.2% 190 11% Sep-13 156 24% 275 24% 0.57 379 2.43 35 97.8% 380,500 5.6% 377,000 15.0% 475,716 18.0% 192 12% Oct-13 166 31% 248 23% 0.67 371 2.23 40 98.0% 384,100 7.0% 375,000 0.7% 476,832 2.9% 194 13% Nov-13 163 23% 172 2% 0.95 317 1.94 41 97.8% 385,600 6.9% 370,000 4.8% 446,362 -3.3% 195 10% Dec-13 115 31% 101 12% 1.14 240 2.09 54 97.6% 386,800 8.5% 462,000 26.2% 529,197 16.7% 196 17% 2013 1,985 19% 2,872 10% 0.69 346 2.13 38 98.0% 374,083 4.5% 385,000 11.6% 475,909 7.7% 189 12% Jan-14 130 27% 216 -2% 0.60 268 2.06 42 98.4% 387,800 7.6% 393,550 -12.7% 483,606 -3.1% 196 15% Feb-14 173 10% 244 -7% 0.71 289 1.67 34 98.9% 393,000 8.7% 458,000 21.0% 539,757 13.1% 199 17% Mar-14 200 9% 252 -2% 0.79 299 1.50 34 98.4% 400,500 9.6% 428,500 -9.6% 537,786 3.2% 202 10% Apr-14 204 8% 344 15% 0.59 353 1.73 30 98.9% 405,800 10.1% 411,200 -0.1% 501,113 2.1% 205 13% May-14 280 36% 394 34% 0.71 426 1.52 28 98.8% 409,600 10.0% 406,700 17.7% 505,206 12.8% 207 13% Jun-14 226 28% 342 32% 0.66 472 2.09 28 98.7% 413,300 10.7% 421,002 14.6% 537,004 20.5% 209 10% Jul-14 199 1% 304 36% 0.65 486 2.44 33 98.4% 417,300 11.6% 399,900 4.1% 495,669 6.8% 211 13% Aug-14 212 22% 277 7% 0.77 461 2.17 36 98.6% 415,500 10.5% 412,000 7.0% 520,129 11.5% 210 13% Sep-14 182 17% 290 5% 0.63 444 2.44 37 98.4% 414,700 9.0% 405,250 7.5% 516,739 8.6% 210 7% Oct-14 174 5% 274 10% 0.64 449 2.58 41 98.4% 413,300 7.6% 412,000 9.9% 517,443 8.5% 209 11% Nov-14 159 -2% 219 27% 0.73 422 2.65 36 98.3% 414,100 7.4% 419,998 13.5% 518,125 16.1% 209 17% Dec-14 104 -10% 137 36% 0.76 359 3.45 46 97.8% 413,500 6.9% 400,000 -13.4% 515,301 -2.6% 209 12% 2014 2,243 13% 3,293 15% 0.68 394 2.19 34 98.6% 408,200 9.1% 412,500 7.1% 516,189 8.5% 206 12%
- 15. SEMI DETACHED CITY OF CALGARY Sales Y/Y% New Listings Y/Y% S/NL Ratio Inventory Months of Supply DOM SP/LP Benchmark Price Y/Y% Median Price Y/Y% Average Price Y/Y% Index Share of Sales Condo Jan-15 81 -38% 302 40% 0.27 471 5.81 41 98.0% 416,100 7.3% 382,000 -2.9% 483,077 -0.1% 210 23% Feb-15 95 -45% 275 13% 0.35 544 5.73 35 97.9% 414,300 5.4% 417,500 -8.8% 503,722 -6.7% 209 14% Mar-15 160 -20% 308 22% 0.52 572 3.58 41 97.4% 411,800 2.8% 403,750 -5.8% 510,352 -5.1% 208 12% Apr-15 202 -1% 267 -22% 0.76 502 2.49 39 97.6% 409,000 0.8% 396,750 -3.5% 499,705 -0.3% 207 12% May-15 192 -31% 300 -24% 0.64 488 2.54 45 98.0% 408,600 -0.2% 417,500 2.7% 513,979 1.7% 207 13% Jun-15 184 -19% 294 -14% 0.63 491 2.67 43 98.1% 412,400 -0.2% 410,750 -2.4% 520,993 -3.0% 208 17% Jul-15 191 -4% 283 -7% 0.67 492 2.58 44 97.9% 414,300 -0.7% 414,000 3.5% 510,395 3.0% 209 14% Aug-15 139 -34% 245 -12% 0.57 505 3.63 41 97.5% 413,900 -0.4% 415,207 0.8% 492,179 -5.4% 209 19% Sep-15 103 -43% 268 -8% 0.38 553 5.37 40 97.7% 413,500 -0.3% 432,500 6.7% 510,515 -1.2% 209 11% Oct-15 128 -26% 293 7% 0.44 586 4.58 41 97.3% 412,400 -0.2% 392,250 -4.8% 476,423 -7.9% 208 13% Nov-15 108 -32% 200 -9% 0.54 546 5.06 47 97.0% 409,600 -1.1% 378,000 -10.0% 481,182 -7.1% 207 14% Dec-15 74 -29% 142 4% 0.52 448 6.05 53 96.5% 407,800 -1.4% 394,500 -1.4% 496,127 -3.7% 206 20% 2015 1,657 -26% 3,177 -4% 0.52 517 4.17 42 97.6% 411,975 0.9% 405,000 -1.8% 502,276 -2.7% 208 14% Jan-16 71 -12% 268 -11% 0.26 501 7.06 44 96.5% 404,800 -2.7% 377,000 -1.3% 478,679 -0.9% 205 17% Feb-16 110 16% 283 3% 0.39 552 5.02 47 97.0% 401,700 -3.0% 403,500 -3.4% 492,823 -2.2% 203 19% Mar-16 144 -10% 289 -6% 0.50 579 4.02 37 97.2% 398,900 -3.1% 390,000 -3.4% 465,481 -8.8% 202 17% Apr-16 174 -14% 306 15% 0.57 586 3.37 50 96.9% 398,100 -2.7% 410,000 3.3% 490,701 -1.8% 201 9% May-16 190 -1% 296 -1% 0.64 544 2.86 41 97.2% 397,300 -2.8% 429,000 2.8% 506,419 -1.5% 201 15% Jun-16 185 1% 290 -1% 0.64 532 2.88 46 97.0% 400,500 -2.9% 393,000 -4.3% 490,257 -5.9% 202 17% Jul-16 180 -6% 261 -8% 0.69 520 2.89 45 97.4% 400,500 -3.3% 386,808 -6.6% 497,568 -2.5% 202 18% Aug-16 138 -1% 237 -3% 0.58 502 3.64 47 97.5% 402,700 -2.7% 391,000 -5.8% 482,981 -1.9% 204 15% Sep-16 155 50% 268 0% 0.58 508 3.28 50 97.0% 403,100 -2.5% 405,000 -6.4% 476,760 -6.6% 204 20% Oct-16 166 30% 223 -24% 0.74 478 2.88 41 97.4% 403,100 -2.3% 375,000 -4.4% 469,476 -1.5% 204 13% Nov-16 112 4% 193 -4% 0.58 455 4.06 60 96.9% 401,100 -2.1% 427,500 13.1% 502,513 4.4% 203 20% Dec-16 95 28% 103 -27% 0.92 367 3.86 60 96.6% 402,700 -1.3% 405,000 2.7% 510,914 3.0% 204 15% 2016 1,720 4% 3,017 -5% 0.57 510 3.82 47 97.1% 401,208 -2.6% 395,000 -2.5% 488,597 -2.7% 203 16% Jan-17 83 17% 198 -26% 0.42 375 4.52 61 96.5% 403,100 -0.4% 375,000 -0.5% 482,059 0.7% 204 12% Feb-17 126 15% 236 -17% 0.53 435 3.45 53 97.1% 403,300 0.4% 386,858 -4.1% 477,825 -3.0% 204 14% Mar-17 198 38% 301 4% 0.66 454 2.29 40 97.6% 406,800 2.0% 396,500 1.7% 495,407 6.4% 206 15% Apr-17 204 17% 269 -12% 0.76 455 2.23 46 97.6% 408,000 2.5% 436,750 6.5% 522,403 6.5% 206 16% May-17 188 -1% 332 12% 0.57 517 2.75 42 98.1% 410,400 3.3% 405,250 -5.5% 495,805 -2.1% 207 16% Jun-17 191 3% 340 17% 0.56 559 2.93 40 97.6% 413,300 3.2% 400,000 1.8% 513,114 4.7% 209 16% Jul-17 146 -19% 277 6% 0.53 586 4.01 44 97.4% 416,300 3.9% 393,500 1.7% 502,275 0.9% 210 15% Aug-17 177 28% 279 18% 0.63 579 3.27 42 97.5% 415,100 3.1% 396,000 1.3% 477,421 -1.2% 210 20% Sep-17 144 -7% 320 19% 0.45 612 4.25 44 97.5% 414,700 2.9% 423,000 4.4% 505,210 6.0% 210 23% Oct-17 142 -14% 247 11% 0.57 607 4.27 52 97.5% 414,300 2.8% 390,000 4.0% 492,518 4.9% 209 21% Nov-17 125 12% 192 -1% 0.65 548 4.38 54 97.2% 413,100 3.0% 397,000 -7.1% 510,560 1.6% 209 15% Dec-17 95 0% 129 25% 0.74 432 4.55 59 97.2% 411,800 2.3% 405,500 0.1% 492,219 -3.7% 208 17% 2017 1,819 6% 3,120 3% 0.58 513 3.58 46 97.5% 410,850 2.4% 405,000 2.5% 498,735 2.1% 208 17% Jan-18 99 19% 234 18% 0.42 447 4.52 62 97.4% 411,200 2.0% 376,500 0.4% 460,514 -4.5% 208 17% Feb-18 106 -16% 246 4% 0.43 533 5.03 48 97.8% 414,100 2.7% 402,815 4.1% 509,176 6.6% 209 18% Mar-18 143 -28% 387 29% 0.37 674 4.71 45 97.6% 414,100 1.8% 445,000 12.2% 551,874 11.4% 209 12% Apr-18 155 -24% 348 29% 0.45 756 4.88 52 97.3% 415,500 1.8% 421,000 -3.6% 507,585 -2.8% 210 17% May-18 156 -17% 416 25% 0.38 861 5.52 52 97.4% 414,300 1.0% 402,844 -0.6% 484,474 -2.3% 209 15% Jun-18 183 -4% 410 21% 0.45 919 5.02 47 97.6% 413,300 0.0% 408,180 2.0% 496,522 -3.2% 209 18% Jul-18 150 3% 299 8% 0.50 901 6.01 48 97.0% 411,000 -1.3% 395,750 0.6% 491,368 -2.2% 208 11% Aug-18 142 -20% 323 16% 0.44 890 6.27 56 97.1% 410,200 -1.2% 413,750 4.5% 484,917 1.6% 207 21% Sep-18 121 -16% 327 2% 0.37 852 7.04 55 97.3% 406,200 -2.0% 371,500 -12.2% 448,723 -11.2% 205 15% Oct-18 125 -12% 279 13% 0.45 816 6.53 60 96.9% 402,100 -2.9% 397,500 1.9% 477,262 -3.1% 203 17% Nov-18 108 -14% 203 6% 0.53 752 6.96 78 97.3% 399,300 -3.3% 355,000 -10.6% 437,269 -14.4% 202 17% Dec-18 87 -8% 110 -15% 0.79 570 6.55 79 96.8% 396,100 -3.8% 363,500 -10.4% 467,019 -5.1% 200 10% 2018 1,575 -13% 3,582 15% 0.44 748 5.75 55 97.3% 408,950 -0.5% 400,000 -1.2% 487,601 -2.2% 207 16% Jan-19 84 -15% 308 32% 0.27 649 7.73 67 95.3% 392,000 -4.7% 395,250 5.0% 498,689 8.3% 198 18% Feb-19 103 -3% 253 3% 0.41 689 6.69 59 96.7% 391,200 -5.5% 385,000 -4.4% 465,963 -8.5% 198 7% Mar-19 148 3% 314 -19% 0.47 759 5.13 66 96.8% 390,000 -5.8% 389,000 -12.6% 478,728 -13.3% 197 13% Apr-19 167 8% 316 -9% 0.53 770 4.61 63 96.9% 396,100 -4.7% 385,000 -8.6% 473,561 -6.7% 200 19% May-19 203 30% 338 -19% 0.60 793 3.91 61 96.6% 397,700 -4.0% 385,000 -4.4% 476,034 -1.7% 201 15% Jun-19 Jul-19 Aug-19 Sep-19 Oct-19 Nov-19 Dec-19 2019 705 -54% 1,529 -56% 0.46 732 5.61 64 96.6% 393,400 -3.8% 385,250 -3.7% 476,685 -2.2% 199 15%
- 16. SEMI DETACHED CITY OF CALGARY -20% -15% -10% -5% 0% 5% 10% 15% - 1 2 3 4 5 6 7 MONTHS OF SUPPLY AND PRICE CHANGE Months of Supply trend (12 M) Benchmark price y/y % Change Source: CREB® 0 100 200 300 400 500 600 700 800 900 1,000 0% 10% 20% 30% 40% 50% 60% 70% 80% SALES TO NEW LISTINGS RATIO AND INVENTORY Inventory Sales to New listings ratio trend (12 M) Inventory Trend (12 M) Source: CREB® 100,000 150,000 200,000 250,000 300,000 350,000 400,000 450,000 500,000 550,000 600,000 PRICE COMPARISON Average Median Benchmark Source: CREB® - 10 20 30 40 50 60 70 DAYS ON MARKET Days on market trend (12 M) Source: CREB® 375,000 380,000 385,000 390,000 395,000 400,000 405,000 410,000 415,000 420,000 0 100 200 300 400 500 600 700 800 900 1,000 May. '18 Jun. '18 Jul. '18 Aug. '18 Sep. '18 Oct. '18 Nov. '18 Dec. '18 Jan. '19 Feb. '19 Mar. '19 Apr. '19 May. '19 INVENTORY, SALES AND PRICE Inventory Sales Benchmark Price Source: CREB® 0 2 4 6 8 10 12 14 16 18 <$200,000 $200,000 - $299,999 $300,000 - $399,999 $400,000 - $499,999 $500,000 - $599,999 $600,000 - $699,999 $700,000 - 999,999 $1,000,000+ MONTHS OF SUPPLY BY PRICE RANGE May-16 May-17 May-18 May-19 Source: CREB® May
- 17. SEMI DETACHED CITY OF CALGARY - 50 100 150 200 250 Jan. Feb. Mar. Apr. May Jun. Jul. Aug. Sept. Oct. Nov. Dec. SEMI-DETACHED SALES COMPARISON 2019 2018 2017 2016 Source: CREB® 0 50 100 150 200 250 300 <$200,000 $200,000 - $299,999 $300,000 - $399,999 $400,000 - $499,999 $500,000 - $599,999 $600,000 - $699,999 $700,000 - 999,999 $1,000,000+ YTD SALES BY PRICE RANGE YTD-2016 YTD-2017 YTD-2018 YTD-2019 Source: CREB® YTD-MAY 0 50 100 150 200 250 300 350 400 450 500 <$200,000 $200,000 - $299,999 $300,000 - $399,999 $400,000 - $499,999 $500,000 - $599,999 $600,000 - $699,999 $700,000 - 999,999 $1,000,000+ YTD NEW LISTINGS BY PRICE RANGE YTD-2016 YTD-2017 YTD-2018 YTD-2019 Source: CREB® YTD-MAY 0 50 100 150 200 250 300 <$200,000 $200,000 - $299,999 $300,000 - $399,999 $400,000 - $499,999 $500,000 - $599,999 $600,000 - $699,999 $700,000 - 999,999 $1,000,000+ INVENTORY BY PRICE RANGE May-16 May-17 May-18 May-19 Source: CREB® May - 50 100 150 200 250 300 350 400 450 Jan. Feb. Mar. Apr. May Jun. Jul. Aug. Sept. Oct. Nov. Dec. SEMI-DETACHED NEW LISTINGS COMPARISON 2019 2018 2017 2016 Source: CREB® - 100 200 300 400 500 600 700 800 900 1,000 Jan. Feb. Mar. Apr. May Jun. Jul. Aug. Sept. Oct. Nov. Dec. SEMI-DETACHED INVENTORY COMPARISON 2019 2018 2017 2016 Source: CREB®
- 18. ROW CITY OF CALGARY Sales Y/Y% New Listings Y/Y% S/NL Ratio Inventory Months of Supply DOM SP/LP Benchmark Price Y/Y% Median Price Y/Y% Average Price Y/Y% Index Share of Sales Condo Jan-10 144 57% 314 -8% 0.46 429 2.98 50 97.3% 280,100 -1.1% 282,500 7.7% 305,472 11.9% 175 98% Feb-10 189 31% 384 15% 0.49 540 2.86 38 97.5% 283,000 1.3% 295,000 12.3% 306,935 8.8% 177 99% Mar-10 240 34% 501 59% 0.48 654 2.73 33 97.8% 286,300 5.1% 295,000 9.4% 315,562 5.3% 179 99% Apr-10 255 20% 496 42% 0.51 771 3.02 35 97.4% 290,200 9.1% 293,000 2.8% 309,168 2.0% 182 98% May-10 209 -18% 460 21% 0.45 874 4.18 42 97.4% 292,500 10.0% 295,000 11.1% 319,644 8.9% 183 98% Jun-10 167 -45% 403 13% 0.41 905 5.42 43 96.9% 292,900 10.2% 288,000 4.0% 305,577 0.5% 183 97% Jul-10 177 -36% 318 -4% 0.56 854 4.82 51 96.2% 291,100 8.9% 285,000 1.2% 305,053 -1.4% 182 97% Aug-10 141 -45% 296 -3% 0.48 794 5.63 52 96.6% 288,400 7.1% 280,000 0.2% 305,008 1.0% 181 100% Sep-10 134 -42% 326 -2% 0.41 766 5.72 60 96.6% 287,100 6.0% 273,875 -5.2% 285,324 -7.9% 180 99% Oct-10 109 -51% 296 -1% 0.37 757 6.94 57 96.4% 280,700 2.9% 266,000 -8.3% 305,080 -2.7% 176 97% Nov-10 121 -26% 208 -13% 0.58 681 5.63 56 96.2% 278,000 1.1% 292,500 6.4% 310,059 4.6% 174 98% Dec-10 108 -8% 132 -6% 0.82 499 4.62 59 96.2% 277,400 0.0% 279,750 3.6% 289,808 0.5% 174 99% 2010 1,994 -19% 4,134 11% 0.48 710 4.55 46 97.0% 285,642 5.0% 287,000 4.0% 306,777 2.0% 179 98% Jan-11 105 -27% 308 -2% 0.34 555 5.29 56 96.8% 272,700 -2.6% 265,000 -6.2% 275,944 -9.7% 171 96% Feb-11 165 -13% 350 -9% 0.47 641 3.88 54 97.3% 274,000 -3.2% 288,000 -2.4% 304,649 -0.7% 172 100% Mar-11 231 -4% 367 -27% 0.63 657 2.84 51 97.0% 274,000 -4.3% 279,000 -5.4% 301,686 -4.4% 172 99% Apr-11 203 -20% 371 -25% 0.55 706 3.48 57 96.6% 273,100 -5.9% 275,000 -6.1% 292,832 -5.3% 171 99% May-11 189 -10% 371 -19% 0.51 748 3.96 47 97.3% 273,700 -6.4% 280,500 -4.9% 305,389 -4.5% 171 99% Jun-11 209 25% 347 -14% 0.60 730 3.49 55 96.8% 275,300 -6.0% 285,000 -1.0% 322,921 5.7% 172 100% Jul-11 199 12% 308 -3% 0.65 710 3.57 52 97.3% 277,000 -4.8% 276,500 -3.0% 302,996 -0.7% 173 98% Aug-11 163 16% 326 10% 0.50 706 4.33 51 97.0% 275,800 -4.4% 278,000 -0.7% 312,719 2.5% 173 99% Sep-11 163 22% 317 -3% 0.51 715 4.39 52 96.9% 275,500 -4.0% 270,000 -1.4% 323,427 13.4% 172 100% Oct-11 142 30% 261 -12% 0.54 658 4.63 52 96.9% 276,300 -1.6% 273,500 2.8% 288,965 -5.3% 173 99% Nov-11 135 12% 213 2% 0.63 582 4.31 58 97.0% 274,200 -1.4% 288,800 -1.3% 297,815 -3.9% 172 98% Dec-11 114 6% 113 -14% 1.01 440 3.86 60 96.9% 271,000 -2.3% 273,800 -2.1% 286,182 -1.3% 170 100% 2011 2,018 1% 3,652 -12% 0.55 654 4.00 53 97.0% 274,383 -3.9% 278,000 -3.1% 302,991 -1.2% 172 99% Jan-12 119 13% 285 -7% 0.42 468 3.93 61 96.8% 268,400 -1.6% 263,000 -0.8% 284,204 3.0% 168 96% Feb-12 186 13% 335 -4% 0.56 545 2.93 52 97.3% 268,600 -2.0% 279,500 -3.0% 304,585 0.0% 168 99% Mar-12 212 -8% 336 -8% 0.63 560 2.64 48 97.2% 268,600 -2.0% 278,000 -0.4% 308,690 2.3% 168 98% Apr-12 240 18% 337 -9% 0.71 584 2.43 49 97.4% 271,000 -0.8% 295,000 7.3% 313,748 7.1% 170 100% May-12 260 38% 408 10% 0.64 648 2.49 38 97.7% 272,300 -0.5% 284,250 1.3% 317,231 3.9% 170 99% Jun-12 227 9% 361 4% 0.63 655 2.89 47 97.2% 274,500 -0.3% 280,000 -1.8% 312,776 -3.1% 172 98% Jul-12 218 10% 268 -13% 0.81 586 2.69 46 97.5% 275,000 -0.7% 284,500 2.9% 298,740 -1.4% 172 99% Aug-12 214 31% 281 -14% 0.76 549 2.57 51 97.6% 274,500 -0.5% 281,250 1.2% 302,154 -3.4% 172 100% Sep-12 193 18% 260 -18% 0.74 505 2.62 52 97.5% 276,700 0.4% 287,825 6.6% 325,396 0.6% 173 99% Oct-12 198 39% 251 -4% 0.79 469 2.37 52 97.3% 277,200 0.3% 284,000 3.8% 310,787 7.6% 174 99% Nov-12 177 31% 176 -17% 1.01 403 2.28 50 97.5% 277,000 1.0% 288,444 -0.1% 308,904 3.7% 173 100% Dec-12 113 -1% 101 -11% 1.12 284 2.51 51 96.9% 276,100 1.9% 257,500 -6.0% 302,195 5.6% 173 99% 2012 2,357 17% 3,399 -7% 0.69 521 2.70 49 97.4% 273,325 -0.4% 282,000 1.4% 308,716 1.9% 171 99% Jan-13 133 12% 278 -2% 0.48 334 2.51 52 97.2% 278,500 3.8% 279,900 6.4% 315,589 11.0% 174 98% Feb-13 207 11% 318 -5% 0.65 383 1.85 37 97.7% 279,800 4.2% 302,000 8.1% 326,213 7.1% 175 97% Mar-13 259 22% 340 1% 0.76 407 1.57 37 98.2% 283,300 5.5% 291,500 4.9% 333,183 7.9% 177 98% Apr-13 305 27% 401 19% 0.76 454 1.49 36 98.1% 287,300 6.0% 295,000 0.0% 323,562 3.1% 180 99% May-13 326 25% 375 -8% 0.87 446 1.37 33 98.0% 289,500 6.3% 309,950 9.0% 335,171 5.7% 181 99% Jun-13 284 25% 310 -14% 0.92 404 1.42 38 97.8% 292,400 6.5% 298,000 6.4% 318,863 1.9% 183 98% Jul-13 269 23% 267 0% 1.01 360 1.34 38 97.8% 292,700 6.4% 295,000 3.7% 322,578 8.0% 183 98% Aug-13 258 21% 340 21% 0.76 373 1.45 33 98.2% 294,500 7.3% 305,500 8.6% 326,702 8.1% 184 99% Sep-13 228 18% 324 25% 0.70 383 1.68 29 98.0% 296,900 7.3% 299,500 4.1% 321,751 -1.1% 186 98% Oct-13 251 27% 297 18% 0.85 376 1.50 41 98.1% 298,600 7.7% 315,000 10.9% 344,403 10.8% 187 100% Nov-13 209 18% 211 20% 0.99 322 1.54 36 98.0% 300,500 8.5% 308,000 6.8% 338,669 9.6% 188 99% Dec-13 157 39% 106 5% 1.48 210 1.34 46 97.9% 302,000 9.4% 310,000 20.4% 323,179 6.9% 189 99% 2013 2,886 22% 3,567 5% 0.81 371 1.59 37 98.0% 291,333 6.6% 300,000 6.4% 328,029 6.3% 182 98% Jan-14 181 36% 276 -1% 0.66 232 1.28 38 98.2% 304,400 9.3% 317,500 13.4% 349,005 10.6% 191 99% Feb-14 229 11% 324 2% 0.71 288 1.26 27 99.0% 306,900 9.7% 332,545 10.1% 347,544 6.5% 192 100% Mar-14 312 20% 421 24% 0.74 342 1.10 25 99.1% 308,400 8.9% 320,000 9.8% 341,117 2.4% 193 100% Apr-14 330 8% 444 11% 0.74 403 1.22 25 99.0% 314,100 9.3% 318,000 7.8% 339,059 4.8% 197 98% May-14 369 13% 523 39% 0.71 482 1.31 28 98.7% 318,300 9.9% 328,888 6.1% 348,827 4.1% 199 99% Jun-14 401 41% 456 47% 0.88 468 1.17 27 98.5% 321,300 9.9% 320,000 7.4% 343,872 7.8% 201 99% Jul-14 306 14% 375 40% 0.82 464 1.52 32 98.3% 322,300 10.1% 326,875 10.8% 355,011 10.1% 202 100% Aug-14 304 18% 407 20% 0.75 473 1.56 33 98.4% 325,000 10.4% 333,350 9.1% 357,415 9.4% 203 99% Sep-14 301 32% 392 21% 0.77 492 1.63 32 98.5% 327,200 10.2% 327,000 9.2% 347,610 8.0% 205 98% Oct-14 280 12% 389 31% 0.72 513 1.83 35 98.3% 329,100 10.2% 328,250 4.2% 360,371 4.6% 206 98% Nov-14 252 21% 262 24% 0.96 438 1.74 36 98.2% 328,300 9.3% 329,950 7.1% 354,548 4.7% 206 98% Dec-14 144 -8% 167 58% 0.86 382 2.65 44 97.7% 328,200 8.7% 320,000 3.2% 345,721 7.0% 205 97% 2014 3,409 18% 4,436 24% 0.77 415 1.52 31 98.5% 319,458 9.7% 325,000 8.3% 348,970 6.4% 200 99%
- 19. ROW CITY OF CALGARY Sales Y/Y% New Listings Y/Y% S/NL Ratio Inventory Months of Supply DOM SP/LP Benchmark Price Y/Y% Median Price Y/Y% Average Price Y/Y% Index Share of Sales Condo Jan-15 109 -40% 389 41% 0.28 546 5.01 42 97.9% 329,500 8.2% 322,000 1.4% 344,487 -1.3% 206 98% Feb-15 158 -31% 396 22% 0.40 673 4.26 33 97.6% 329,500 7.4% 315,000 -5.3% 329,699 -5.1% 206 99% Mar-15 236 -24% 376 -11% 0.63 680 2.88 38 97.5% 329,100 6.7% 325,000 1.6% 334,675 -1.9% 206 99% Apr-15 260 -21% 420 -5% 0.62 725 2.79 42 97.3% 325,900 3.8% 322,250 1.3% 339,103 0.0% 204 97% May-15 273 -26% 380 -27% 0.72 673 2.47 41 97.6% 326,400 2.5% 323,000 -1.8% 337,481 -3.3% 204 96% Jun-15 270 -33% 386 -15% 0.70 646 2.39 44 97.5% 326,400 1.6% 320,000 0.0% 349,772 1.7% 204 96% Jul-15 255 -17% 392 5% 0.65 647 2.54 44 97.5% 324,500 0.7% 323,000 -1.2% 348,003 -2.0% 203 93% Aug-15 228 -25% 340 -16% 0.67 650 2.85 46 97.6% 324,000 -0.3% 330,000 -1.0% 346,289 -3.1% 203 96% Sep-15 183 -39% 404 3% 0.45 724 3.96 42 97.5% 324,500 -0.8% 317,500 -2.9% 329,559 -5.2% 203 95% Oct-15 184 -34% 370 -5% 0.50 749 4.07 41 97.6% 324,000 -1.5% 312,000 -5.0% 332,095 -7.8% 203 97% Nov-15 162 -36% 309 18% 0.52 742 4.58 49 97.1% 323,500 -1.5% 319,200 -3.3% 331,533 -6.5% 203 94% Dec-15 120 -17% 215 29% 0.56 640 5.33 47 97.2% 321,600 -2.0% 313,000 -2.2% 326,227 -5.6% 201 96% 2015 2,438 -28% 4,377 -1% 0.56 675 3.59 42 97.5% 325,742 2.0% 320,000 -1.5% 338,527 -3.0% 204 96% Jan-16 99 -9% 389 0% 0.25 733 7.40 51 96.8% 320,000 -2.9% 315,000 -2.2% 344,407 0.0% 200 93% Feb-16 159 1% 377 -5% 0.42 789 4.96 52 97.3% 316,800 -3.9% 315,000 0.0% 340,232 3.2% 198 96% Mar-16 184 -22% 439 17% 0.42 901 4.90 49 97.1% 313,500 -4.7% 309,200 -4.9% 327,900 -2.0% 196 91% Apr-16 185 -29% 425 1% 0.44 944 5.10 47 96.9% 310,900 -4.6% 310,000 -3.8% 325,976 -3.9% 195 96% May-16 241 -12% 486 28% 0.50 983 4.08 50 97.5% 310,300 -4.9% 321,500 -0.5% 347,743 3.0% 194 95% Jun-16 252 -7% 456 18% 0.55 987 3.92 51 97.1% 306,600 -6.1% 310,000 -3.1% 329,034 -5.9% 192 92% Jul-16 200 -22% 317 -19% 0.63 888 4.44 55 97.0% 306,000 -5.7% 303,250 -6.1% 328,610 -5.6% 192 96% Aug-16 182 -20% 385 13% 0.47 872 4.79 55 97.0% 306,100 -5.5% 310,000 -6.1% 330,122 -4.7% 192 93% Sep-16 181 -1% 413 2% 0.44 892 4.93 52 97.0% 305,500 -5.9% 310,000 -2.4% 325,974 -1.1% 191 92% Oct-16 200 9% 304 -18% 0.66 837 4.19 56 97.0% 303,700 -6.3% 300,000 -3.8% 319,252 -3.9% 190 95% Nov-16 143 -12% 275 -11% 0.52 773 5.41 58 97.4% 303,100 -6.3% 310,000 -2.9% 331,669 0.0% 190 97% Dec-16 119 -1% 137 -36% 0.87 576 4.84 58 96.8% 303,300 -5.7% 317,900 1.6% 336,862 3.3% 190 96% 2016 2,145 -12% 4,403 1% 0.49 848 4.91 53 97.1% 308,817 -5.2% 310,000 -3.1% 331,807 -2.0% 193 94% Jan-17 128 29% 334 -14% 0.38 621 4.85 62 96.8% 302,800 -5.4% 303,500 -3.7% 320,783 -6.9% 190 97% Feb-17 151 -5% 347 -8% 0.44 682 4.52 48 97.0% 301,800 -4.7% 311,000 -1.3% 323,565 -4.9% 189 94% Mar-17 224 22% 417 -5% 0.54 768 3.43 52 97.1% 300,200 -4.2% 302,750 -2.1% 344,526 5.1% 188 96% Apr-17 221 19% 474 12% 0.47 867 3.92 57 97.3% 302,000 -2.9% 309,000 -0.3% 350,371 7.5% 189 95% May-17 271 12% 525 8% 0.52 949 3.50 45 97.3% 303,700 -2.1% 310,000 -3.6% 338,564 -2.6% 190 95% Jun-17 280 11% 519 14% 0.54 1,012 3.61 47 97.4% 305,800 -0.3% 310,000 0.0% 332,645 1.1% 191 95% Jul-17 213 6% 399 26% 0.53 1,017 4.77 49 97.3% 306,900 0.3% 307,000 1.2% 331,390 0.8% 192 94% Aug-17 187 3% 407 6% 0.46 996 5.33 56 96.8% 307,200 0.4% 305,500 -1.5% 347,520 5.3% 192 94% Sep-17 188 4% 444 8% 0.42 1,002 5.33 52 97.2% 306,800 0.4% 319,000 2.9% 344,187 5.6% 192 94% Oct-17 184 -8% 376 24% 0.49 975 5.30 54 97.1% 305,300 0.5% 312,000 4.0% 352,464 10.4% 191 93% Nov-17 187 31% 301 9% 0.62 875 4.68 55 96.8% 303,300 0.1% 290,000 -6.5% 316,117 -4.7% 190 95% Dec-17 127 7% 156 14% 0.81 667 5.25 60 96.9% 299,900 -1.1% 295,000 -7.2% 329,857 -2.1% 188 94% 2017 2,361 10% 4,699 7% 0.50 869 4.54 52 97.1% 303,808 -1.6% 308,000 -0.6% 336,956 1.6% 190 95% Jan-18 131 2% 346 4% 0.38 703 5.37 69 96.5% 296,900 -1.9% 295,000 -2.8% 314,512 -2.0% 186 92% Feb-18 133 -12% 318 -8% 0.42 779 5.86 62 97.1% 295,700 -2.0% 300,000 -3.5% 323,453 0.0% 185 91% Mar-18 163 -27% 467 12% 0.35 941 5.77 61 97.3% 298,000 -0.7% 300,000 -0.9% 328,860 -4.5% 187 96% Apr-18 192 -13% 486 3% 0.40 1,073 5.59 54 97.3% 300,400 -0.5% 308,950 0.0% 334,402 -4.6% 188 92% May-18 228 -16% 514 -2% 0.44 1,169 5.13 50 97.2% 303,600 0.0% 308,450 -0.5% 337,798 -0.2% 190 96% Jun-18 211 -25% 496 -4% 0.43 1,218 5.77 54 97.0% 302,600 -1.0% 293,500 -5.3% 317,123 -4.7% 189 94% Jul-18 175 -18% 390 -2% 0.45 1,199 6.85 59 96.9% 300,700 -2.0% 292,500 -4.7% 305,903 -7.7% 188 94% Aug-18 179 -4% 368 -10% 0.49 1,137 6.35 60 97.0% 296,900 -3.4% 300,000 -1.8% 323,800 -6.8% 186 92% Sep-18 146 -22% 415 -7% 0.35 1,131 7.75 62 96.2% 294,300 -4.1% 299,000 -6.3% 323,639 -6.0% 184 93% Oct-18 153 -17% 297 -21% 0.52 1,029 6.73 64 96.5% 293,500 -3.9% 289,900 -7.1% 308,489 -12.5% 184 90% Nov-18 145 -22% 279 -7% 0.52 951 6.56 64 96.5% 293,000 -3.4% 289,000 -0.3% 306,841 -2.9% 183 88% Dec-18 106 -17% 147 -6% 0.72 718 6.77 71 96.6% 288,600 -3.8% 295,250 0.1% 307,143 -6.9% 181 90% 2018 1,962 -17% 4,523 -4% 0.43 1,004 6.21 60 96.9% 297,017 -2.2% 297,750 -3.3% 320,567 -4.9% 186 93% Jan-19 107 -18% 391 13% 0.27 825 7.71 85 96.7% 284,400 -4.2% 284,000 -3.7% 302,691 -3.8% 178 92% Feb-19 131 -2% 324 2% 0.40 914 6.98 64 96.3% 284,700 -3.7% 281,000 -6.3% 292,931 -9.4% 178 85% Mar-19 174 7% 386 -17% 0.45 959 5.51 65 96.4% 285,000 -4.4% 295,075 -1.6% 305,854 -7.0% 178 90% Apr-19 199 4% 458 -6% 0.43 1,059 5.32 61 96.8% 285,200 -5.1% 284,900 -7.8% 305,481 -8.6% 179 91% May-19 222 -3% 438 -15% 0.51 1,100 4.95 61 96.9% 286,500 -5.6% 284,950 -7.6% 311,733 -7.7% 179 94% Jun-19 Jul-19 Aug-19 Sep-19 Oct-19 Nov-19 Dec-19 2019 833 -56% 1,997 -55% 0.42 971 6.10 66 96.6% 285,160 -4.0% 285,000 -4.3% 305,509 -4.7% 178 91%
- 20. ROW CITY OF CALGARY -20% -15% -10% -5% 0% 5% 10% 15% - 1 2 3 4 5 6 7 MONTHS OF SUPPLY AND PRICE CHANGE Months of Supply trend (12 M) Benchmark price y/y % Change Source: CREB® 0 200 400 600 800 1,000 1,200 1,400 0% 10% 20% 30% 40% 50% 60% 70% 80% 90% 100% SALES TO NEW LISTINGS RATIO AND INVENTORY Inventory Sales to New listings ratio trend (12 M) Inventory Trend (12 M) Source: CREB® 100,000 150,000 200,000 250,000 300,000 350,000 400,000 PRICE COMPARISON Average Median Benchmark Source: CREB® - 10 20 30 40 50 60 70 DAYS ON MARKET Days on market trend (12 M) Source: CREB® 270,000 275,000 280,000 285,000 290,000 295,000 300,000 305,000 310,000 0 200 400 600 800 1,000 1,200 1,400 May. '18 Jun. '18 Jul. '18 Aug. '18 Sep. '18 Oct. '18 Nov. '18 Dec. '18 Jan. '19 Feb. '19 Mar. '19 Apr. '19 May. '19 INVENTORY, SALES AND PRICE Inventory Sales Benchmark Price Source: CREB® 0 2 4 6 8 10 12 14 16 18 20 <$200,000 $200,000 - $299,999 $300,000 - $399,999 $400,000 - $499,999 $500,000 - $599,999 $600,000 - $699,999 $700,000 - 999,999 $1,000,000+ MONTHS OF SUPPLY BY PRICE RANGE May-16 May-17 May-18 May-19 Source: CREB® May
- 21. ROW CITY OF CALGARY - 50 100 150 200 250 300 Jan. Feb. Mar. Apr. May Jun. Jul. Aug. Sept. Oct. Nov. Dec. ROW SALES COMPARISON 2019 2018 2017 2016 Source: CREB® 0 50 100 150 200 250 300 350 400 450 <$200,000 $200,000 - $299,999 $300,000 - $399,999 $400,000 - $499,999 $500,000 - $599,999 $600,000 - $699,999 $700,000 - 999,999 $1,000,000+ YTD SALES BY PRICE RANGE YTD-2016 YTD-2017 YTD-2018 YTD-2019 Source: CREB® YTD-MAY 0 100 200 300 400 500 600 700 800 900 1,000 <$200,000 $200,000 - $299,999 $300,000 - $399,999 $400,000 - $499,999 $500,000 - $599,999 $600,000 - $699,999 $700,000 - 999,999 $1,000,000+ YTD NEW LISTINGS BY PRICE RANGE YTD-2016 YTD-2017 YTD-2018 YTD-2019 Source: CREB® YTD-MAY 0 50 100 150 200 250 300 350 400 450 <$200,000 $200,000 - $299,999 $300,000 - $399,999 $400,000 - $499,999 $500,000 - $599,999 $600,000 - $699,999 $700,000 - 999,999 $1,000,000+ INVENTORY BY PRICE RANGE May-16 May-17 May-18 May-19 Source: CREB® May - 100 200 300 400 500 600 Jan. Feb. Mar. Apr. May Jun. Jul. Aug. Sept. Oct. Nov. Dec. ROW NEW LISTINGS COMPARISON 2019 2018 2017 2016 Source: CREB® - 200 400 600 800 1,000 1,200 1,400 Jan. Feb. Mar. Apr. May Jun. Jul. Aug. Sept. Oct. Nov. Dec. ROW INVENTORY COMPARISON 2019 2018 2017 2016 Source: CREB®
- 22. BENCHMARK PROPERTIES CITY OF CALGARY Detached Attached One Storey Two Storey Total Semi- Detached Row Total Gross Living Area (Above Ground) 1175 1631 1407 Gross Living Area (Above Ground) 1187 1150 1162 Lot Size 5500 4525 4897 Lot Size 3013 0 - Above Ground Bedrooms 3 3 3 Above Ground Bedrooms 3 2 3 Year Built 1972 1998 1992 Year Built 1989 1992 1991 Below Ground Bedrooms 1 0 0 Below Ground Bedrooms 0 0 0 Full Bathrooms 2 2 2 Full Bathrooms 2 1 2 Half Bathrooms 0 1 1 Half Bathrooms 1 1 1 Finished Basement - - - Finished Basement - - - MAY-2019 Benchmark Price 450,100 522,200 487,900 MAY-2019 Benchmark Price 397,700 286,500 316,800 MAY-2019 Index value 194 202 199 MAY-2019 Index value 201 179 187 Share of detached 34% 66% 100% Share of attached 34% 55% 89% Share of total residential 21% 41% 62% Share of total residential 7% 11% 18% Apartment Total Residential Total Total Gross Living Area (Above Ground) 897 Gross Living Area (Above Ground) 1256 Above Ground Bedrooms 2 Lot Size - Year Built 1999 Above Ground Bedrooms 3 Covered Parking Spaces 1 Year Built 1993 Full Bathrooms 1 Below Ground Bedrooms 0 Half Bathrooms 0 Full Bathrooms 2 MAY-2019 Benchmark Price 248,200 Half Bathrooms 1 MAY-2019 Index value 172 MAY-2019 Benchmark Price 424,600 Share of total residential 16% MAY-2019 Index value 193 Finished Basement - DEFINITIONS Detached -A unit that is not attached to any other unit Attached - A unit that is attached to another unit by at least one common wall Apartment - An attached unit that has connecting enclosed hallways Total Residential - Includes detached, attached and apartment style properties Exclusions - Data does not include activity related to rental, land or leased properties Months of Supply - Active Listings (Inventory) / sales Average DOM - Average Days on Market for Sold properties Y/Y% - Year over year percentage change S/NL Ratio - Total number of sales / Total number of new listings SP/LP Ratio - Total dollar volume of sales / Total dollar volume of new listings Benchmark Price MLS® Home Price Index at a point in time with price levels in a base (reference) period. 100,000 150,000 200,000 250,000 300,000 350,000 400,000 450,000 500,000 550,000 600,000 BENCHMARK PRICE COMPARISON Detached One Storey Detached Two Storey Detached Apartment Semi Row Source: CREB®