SlideShare ist ein Scribd-Unternehmen logo
1 von 22
Downloaden Sie, um offline zu lesen
MONTHLY SUMMARY STATISTICS
Export this Sheet to Excel*
ACADIA (215)
Property Type Sales New Listings
Sales to New
Listings Ratio
Inventory
Months of
Inventory
Benchmark
Price
Y/Y Price
Change
M/M Price
Change
Detached 14 12 116.67% 23 1.64 432,000 -5.68% 1.79%
Apartment 0 2 0.00% 14 - 177,200 0.85% 2.96%
Semi Detached 0 1 0.00% 1 - -
Row 1 2 50.00% 2 2.00 213,500 -1.39% 2.64%
Total 15 17 88.24% 40 2.67 335,800 -4.76% 2.16%
CREB®
May 2019
0
5
10
15
20
25
May.
'07
May.
'08
May.
'09
May.
'10
May.
'11
May.
'12
May.
'13
May.
'14
May.
'15
May.
'16
May.
'17
May.
'18
May.
'19
SALES
Detached Apartment Semi Row Source: CREB®
May
0
1
2
3
4
5
6
7
8
9
INVENTORY BY PRICE RANGE
Detached Apartment Semi-Detached Row
Source: CREB®
MAY 2019
0
1
2
3
4
5
6
7
8
SALES BY PRICE RANGE
Detached Apartment Semi-Detached Row
Source: CREB®
MAY 2019
0
10
20
30
40
50
60
May.
'07
May.
'08
May.
'09
May.
'10
May.
'11
May.
'12
May.
'13
May.
'14
May.
'15
May.
'16
May.
'17
May.
'18
May.
'19
INVENTORY
Detached Apartment Semi Row Source: CREB®
May
TOTAL RESIDENTIAL
ACADIA (215)
Sales Y/Y%
New
Listings
Y/Y%
S/NL
Ratio
Inventory
Months of
Supply
DOM SP/LP
Benchmark
Price
Y/Y% Median Price Y/Y% Average Price Y/Y% Index
Jan-10 7 -13% 12 -8% 0.58 19 2.71 30 98.5% 310,800 5.9% 339,900 7.6% 305,843 1.3% 165
Feb-10 13 63% 13 -32% 1.00 15 1.15 35 97.1% 307,600 4.6% 344,500 23.7% 318,604 15.4% 163
Mar-10 8 -20% 25 0% 0.32 27 3.38 40 97.9% 311,000 7.3% 377,500 18.0% 332,063 8.3% 165
Apr-10 11 -31% 28 87% 0.39 43 3.91 31 97.2% 316,200 7.5% 355,000 6.9% 350,295 10.2% 168
May-10 9 -53% 27 50% 0.33 51 5.67 38 97.0% 317,700 7.0% 315,000 -3.1% 317,700 2.7% 169
Jun-10 8 -58% 24 20% 0.33 52 6.50 38 97.2% 319,400 5.7% 281,250 -21.4% 270,188 -19.1% 170
Jul-10 7 -36% 21 5% 0.33 49 7.00 46 96.8% 314,300 2.4% 335,000 -2.0% 346,393 1.7% 167
Aug-10 12 -14% 20 5% 0.60 42 3.50 42 97.8% 309,400 -0.2% 351,000 6.4% 330,729 5.8% 164
Sep-10 16 -20% 16 7% 1.00 36 2.25 40 96.1% 306,100 -1.1% 317,500 -3.2% 303,344 -2.1% 163
Oct-10 4 -43% 16 -11% 0.25 39 9.75 28 96.5% 303,800 -1.2% 269,400 -26.7% 278,075 -17.5% 161
Nov-10 8 -47% 14 27% 0.57 39 4.88 59 96.7% 303,200 -1.6% 365,750 8.9% 322,656 0.0% 161
Dec-10 8 60% 12 33% 0.67 24 3.00 56 94.3% 316,400 2.3% 317,500 -16.0% 303,563 -9.8% 168
2010 111 -27% 228 13% 0.49 36 4.47 40 96.9% 311,325 3.1% 339,900 2.3% 316,958 0.0% 165
Jan-11 12 71% 22 83% 0.55 28 2.33 31 96.9% 308,100 -0.9% 314,100 -7.6% 315,867 3.3% 164
Feb-11 8 -38% 15 15% 0.53 32 4.00 29 96.9% 313,400 1.9% 326,375 -5.3% 326,294 2.4% 166
Mar-11 11 38% 12 -52% 0.92 30 2.73 35 97.0% 312,100 0.4% 370,000 -2.0% 340,500 2.5% 166
Apr-11 9 -18% 19 -32% 0.47 30 3.33 35 98.1% 316,600 0.1% 354,600 -0.1% 350,372 0.0% 168
May-11 19 111% 26 -4% 0.73 31 1.63 38 98.1% 314,900 -0.9% 336,000 6.7% 314,195 -1.1% 167
Jun-11 12 50% 22 -8% 0.55 36 3.00 44 96.4% 318,100 -0.4% 341,750 21.5% 322,096 19.2% 169
Jul-11 11 57% 16 -24% 0.69 36 3.27 35 97.6% 322,400 2.6% 339,000 1.2% 309,382 -10.7% 171
Aug-11 14 17% 15 -25% 0.93 35 2.50 60 97.4% 320,000 3.4% 341,500 -2.7% 333,407 0.8% 170
Sep-11 6 -63% 16 0% 0.38 34 5.67 54 96.1% 322,100 5.2% 333,000 4.9% 313,750 3.4% 171
Oct-11 7 75% 15 -6% 0.47 33 4.71 43 98.7% 319,100 5.0% 321,000 19.2% 328,771 18.2% 169
Nov-11 9 13% 9 -36% 1.00 25 2.78 62 95.6% 317,200 4.6% 318,000 -13.1% 303,444 -6.0% 168
Dec-11 6 -25% 4 -67% 1.50 18 3.00 47 97.5% 302,900 -4.3% 306,250 -3.5% 282,000 -7.1% 161
2011 124 12% 191 -16% 0.65 31 3.25 42 97.2% 315,575 1.4% 332,750 -2.1% 321,067 1.3% 168
Jan-12 6 -50% 14 -36% 0.43 21 3.50 38 96.7% 301,900 -2.0% 372,500 18.6% 318,417 0.8% 160
Feb-12 8 0% 9 -40% 0.89 21 2.63 105 95.8% 306,600 -2.2% 364,375 11.6% 366,338 12.3% 163
Mar-12 12 9% 21 75% 0.57 26 2.17 30 96.4% 305,900 -2.0% 328,000 -11.4% 323,125 -5.1% 162
Apr-12 17 89% 14 -26% 1.21 16 0.94 23 98.1% 311,100 -1.7% 353,000 -0.5% 328,471 -6.3% 165
May-12 10 -47% 20 -23% 0.50 22 2.20 20 98.8% 315,700 0.3% 343,500 2.2% 340,610 8.4% 168
Jun-12 12 0% 24 9% 0.50 30 2.50 34 97.4% 319,400 0.4% 374,750 9.7% 375,417 16.6% 170
Jul-12 20 82% 18 13% 1.11 24 1.20 30 98.0% 327,000 1.4% 320,000 -5.6% 321,695 4.0% 174
Aug-12 22 57% 23 53% 0.96 25 1.14 32 97.4% 321,100 0.3% 325,000 -4.8% 321,045 -3.7% 171
Sep-12 15 150% 17 6% 0.88 22 1.47 41 97.0% 313,200 -2.8% 331,000 -0.6% 315,500 0.6% 166
Oct-12 9 29% 13 -13% 0.69 19 2.11 22 97.3% 310,200 -2.8% 375,000 16.8% 355,833 8.2% 165
Nov-12 11 22% 10 11% 1.10 15 1.36 70 96.2% 312,300 -1.5% 316,500 -0.5% 313,668 3.4% 166
Dec-12 8 33% 5 25% 1.60 8 1.00 53 96.6% 311,700 2.9% 361,250 18.0% 334,563 18.6% 166
2012 150 21% 188 -2% 0.80 21 1.85 38 97.3% 313,008 -0.8% 339,975 2.2% 331,817 3.3% 166
Jan-13 3 -50% 10 -29% 0.30 13 4.33 48 99.9% 312,300 3.4% 350,000 -6.0% 392,700 23.3% 166
Feb-13 11 38% 15 67% 0.73 14 1.27 28 96.3% 315,900 3.0% 240,000 -34.1% 286,973 -21.7% 168
Mar-13 15 25% 20 -5% 0.75 18 1.20 25 98.6% 318,900 4.2% 371,000 13.1% 332,693 3.0% 169
Apr-13 14 -18% 16 14% 0.88 18 1.29 17 99.4% 327,700 5.3% 373,500 5.8% 339,325 3.3% 174
May-13 16 60% 17 -15% 0.94 17 1.06 45 97.8% 330,500 4.7% 376,250 9.5% 335,525 -1.5% 176
Jun-13 18 50% 18 -25% 1.00 17 0.94 27 98.4% 333,600 4.4% 378,500 1.0% 359,511 -4.2% 177
Jul-13 22 10% 19 6% 1.16 10 0.45 32 98.0% 334,500 2.3% 252,500 -21.1% 289,245 -10.1% 178
Aug-13 10 -55% 21 -9% 0.48 17 1.70 36 97.5% 331,100 3.1% 394,000 21.2% 360,792 12.4% 176
Sep-13 19 27% 14 -18% 1.36 9 0.47 27 97.9% 331,700 5.9% 360,000 8.8% 320,458 1.6% 176
Oct-13 14 56% 18 38% 0.78 9 0.64 22 98.6% 333,400 7.5% 384,500 2.5% 339,393 -4.6% 177
Nov-13 17 55% 11 10% 1.55 6 0.35 23 98.4% 335,600 7.5% 405,000 28.0% 372,547 18.8% 178
Dec-13 3 -63% 6 20% 0.50 8 2.67 32 98.2% 337,500 8.3% 318,000 -12.0% 302,667 -9.5% 179
2013 162 8% 185 -2% 0.88 13 1.37 29 98.2% 328,558 5.0% 375,250 10.4% 333,137 0.4% 174
Jan-14 10 233% 9 -10% 1.11 5 0.50 28 98.5% 336,600 7.8% 363,250 3.8% 335,712 -14.5% 179
Feb-14 5 -55% 10 -33% 0.50 9 1.80 11 99.0% 340,700 7.9% 330,000 37.5% 336,600 17.3% 181
Mar-14 13 -13% 11 -45% 1.18 7 0.54 29 98.1% 344,500 8.0% 345,900 -6.8% 340,723 2.4% 183
Apr-14 13 -7% 19 19% 0.68 13 1.00 16 99.7% 354,100 8.1% 440,000 17.8% 392,800 15.8% 188
May-14 21 31% 22 29% 0.95 9 0.43 24 99.9% 358,400 8.4% 455,000 20.9% 422,839 26.0% 190
Jun-14 14 -22% 16 -11% 0.88 11 0.79 18 99.1% 360,300 8.0% 311,000 -17.8% 315,779 -12.2% 191
Jul-14 11 -50% 18 -5% 0.61 18 1.64 25 98.7% 361,100 8.0% 412,000 63.2% 409,364 41.5% 192
Aug-14 11 10% 18 -14% 0.61 21 1.91 28 98.7% 359,400 8.5% 420,000 6.6% 398,536 10.5% 191
Sep-14 19 0% 16 14% 1.19 13 0.68 29 98.3% 364,100 9.8% 325,000 -9.7% 323,156 0.8% 193
Oct-14 15 7% 23 28% 0.65 18 1.20 30 98.0% 362,800 8.8% 460,000 19.6% 417,093 22.9% 193
Nov-14 12 -29% 18 64% 0.67 22 1.83 35 97.5% 363,900 8.4% 401,000 -1.0% 353,408 -5.1% 193
Dec-14 9 200% 7 17% 1.29 18 2.00 32 96.4% 366,500 8.6% 238,000 -25.2% 293,222 -3.1% 195
2014 153 -6% 187 1% 0.82 14 1.19 26 98.6% 356,033 8.4% 400,000 6.6% 366,272 9.9% 189
TOTAL RESIDENTIAL
ACADIA (215)
Sales Y/Y%
New
Listings
Y/Y%
S/NL
Ratio
Inventory
Months of
Supply
DOM SP/LP
Benchmark
Price
Y/Y% Median Price Y/Y% Average Price Y/Y% Index
Jan-15 4 -60% 28 211% 0.14 34 8.50 13 99.3% 369,000 9.6% 462,450 27.3% 446,225 32.9% 196
Feb-15 18 260% 17 70% 1.06 28 1.56 26 97.6% 365,000 7.1% 394,250 19.5% 367,758 9.3% 194
Mar-15 14 8% 17 55% 0.82 21 1.50 40 97.1% 361,200 4.8% 411,500 19.0% 363,964 6.8% 192
Apr-15 20 54% 23 21% 0.87 26 1.30 31 97.8% 362,400 2.3% 403,000 -8.4% 391,355 -0.4% 192
May-15 13 -38% 20 -9% 0.65 24 1.85 23 98.2% 354,700 -1.0% 399,400 -12.2% 387,504 -8.4% 188
Jun-15 16 14% 15 -6% 1.07 19 1.19 33 98.2% 353,900 -1.8% 414,050 33.1% 431,009 36.5% 188
Jul-15 9 -18% 16 -11% 0.56 23 2.56 36 97.1% 353,100 -2.2% 356,000 -13.6% 348,944 -14.8% 188
Aug-15 11 0% 13 -28% 0.85 19 1.73 38 97.4% 351,400 -2.2% 325,000 -22.6% 336,645 -15.5% 187
Sep-15 13 -32% 15 -6% 0.87 15 1.15 45 97.0% 350,900 -3.6% 335,000 3.1% 350,731 8.5% 186
Oct-15 10 -33% 16 -30% 0.63 19 1.90 21 97.5% 349,200 -3.7% 407,500 -11.4% 371,500 -10.9% 185
Nov-15 10 -17% 8 -56% 1.25 15 1.50 39 95.6% 343,400 -5.6% 326,250 -18.6% 321,600 -9.0% 182
Dec-15 7 -22% 7 0% 1.00 13 1.86 28 96.8% 339,800 -7.3% 377,000 58.4% 358,500 22.3% 180
2015 145 -5% 195 4% 0.74 21 2.22 32 97.5% 354,500 -0.4% 393,000 -1.7% 373,134 1.9% 188
Jan-16 3 -25% 17 -39% 0.18 23 7.67 16 98.1% 339,400 -8.0% 403,000 -12.9% 410,167 -8.1% 180
Feb-16 8 -56% 11 -35% 0.73 25 3.13 57 95.8% 345,000 -5.5% 391,000 -0.8% 398,000 8.2% 183
Mar-16 10 -29% 13 -24% 0.77 24 2.40 26 98.2% 343,500 -4.9% 404,500 -1.7% 344,050 -5.5% 182
Apr-16 14 -30% 20 -13% 0.70 27 1.93 44 97.7% 348,800 -3.8% 403,000 0.0% 375,493 -4.1% 185
May-16 9 -31% 16 -20% 0.56 25 2.78 32 98.6% 352,400 -0.6% 390,100 -2.3% 375,122 -3.2% 187
Jun-16 11 -31% 15 0% 0.73 20 1.82 36 98.9% 348,400 -1.6% 322,500 -22.1% 339,645 -21.2% 185
Jul-16 10 11% 10 -38% 1.00 14 1.40 31 97.7% 346,600 -1.8% 412,075 15.8% 391,365 12.2% 184
Aug-16 6 -45% 13 0% 0.46 21 3.50 56 96.2% 339,600 -3.4% 432,000 32.9% 459,000 36.3% 180
Sep-16 8 -38% 12 -20% 0.67 24 3.00 34 97.6% 346,600 -1.2% 394,250 17.7% 366,438 4.5% 184
Oct-16 8 -20% 16 0% 0.50 28 3.50 66 97.5% 352,000 0.8% 484,250 18.8% 438,563 18.1% 187
Nov-16 12 20% 19 138% 0.63 29 2.42 27 98.0% 345,800 0.7% 397,500 21.8% 384,292 19.5% 184
Dec-16 4 -43% 4 -43% 1.00 17 4.25 83 96.4% 342,000 0.6% 323,000 -14.3% 331,125 -7.6% 182
2016 103 -29% 166 -15% 0.62 23 3.15 40 97.6% 345,842 -2.4% 407,000 3.6% 381,240 2.2% 184
Jan-17 8 167% 16 -6% 0.50 20 2.50 55 97.0% 341,100 0.5% 336,000 -16.6% 353,625 -13.8% 181
Feb-17 10 25% 16 45% 0.63 21 2.10 24 97.6% 340,900 -1.2% 356,500 -8.8% 347,150 -12.8% 181
Mar-17 9 -10% 21 62% 0.43 30 3.33 28 97.7% 341,700 -0.5% 358,000 -11.5% 351,422 2.1% 181
Apr-17 12 -14% 17 -15% 0.71 31 2.58 55 97.7% 353,000 1.2% 411,750 2.2% 375,125 -0.1% 187
May-17 18 100% 24 50% 0.75 32 1.78 28 97.7% 356,700 1.2% 445,000 14.1% 388,278 3.5% 189
Jun-17 12 9% 26 73% 0.46 45 3.75 35 98.2% 357,700 2.7% 405,000 25.6% 369,708 8.9% 190
Jul-17 14 40% 20 100% 0.70 37 2.64 28 98.2% 360,500 4.0% 426,850 3.6% 432,050 10.4% 191
Aug-17 13 117% 18 38% 0.72 38 2.92 68 97.2% 360,300 6.1% 365,000 -15.5% 359,531 -21.7% 191
Sep-17 7 -13% 21 75% 0.33 45 6.43 39 96.7% 362,900 4.7% 405,000 2.7% 444,857 21.4% 193
Oct-17 17 113% 11 -31% 1.55 32 1.88 40 96.1% 355,800 1.1% 367,000 -24.2% 322,621 -26.4% 189
Nov-17 9 -25% 13 -32% 0.69 29 3.22 59 97.5% 346,900 0.3% 392,000 -1.4% 374,578 -2.5% 184
Dec-17 9 125% 14 250% 0.64 27 3.00 80 97.9% 343,400 0.4% 419,000 29.7% 396,378 19.7% 182
2017 138 34% 217 31% 0.64 32 3.01 43 97.5% 351,742 1.7% 395,000 -2.9% 374,276 -1.8% 187
Jan-18 7 -13% 13 -19% 0.54 26 3.71 54 96.4% 346,900 1.7% 410,000 22.0% 402,214 13.7% 184
Feb-18 5 -50% 14 -13% 0.36 33 6.60 45 93.4% 350,300 2.8% 255,000 -28.5% 277,000 -20.2% 186
Mar-18 9 0% 21 0% 0.43 40 4.44 68 97.7% 359,000 5.1% 430,000 20.1% 428,778 22.0% 191
Apr-18 13 8% 25 47% 0.52 48 3.69 20 97.6% 356,900 1.1% 470,000 14.1% 454,262 21.1% 190
May-18 14 -22% 29 21% 0.48 52 3.71 39 97.9% 352,600 -1.1% 395,500 -11.1% 359,143 -7.5% 187
Jun-18 12 0% 19 -27% 0.63 48 4.00 35 96.1% 353,000 -1.3% 406,500 0.4% 354,771 -4.0% 187
Jul-18 13 -7% 29 45% 0.45 54 4.15 55 97.2% 353,000 -2.1% 375,000 -12.1% 342,762 -20.7% 187
Aug-18 14 8% 21 17% 0.67 52 3.71 48 96.1% 345,800 -4.0% 347,250 -4.9% 334,536 -7.0% 184
Sep-18 15 114% 22 5% 0.68 42 2.80 58 97.1% 352,200 -2.9% 407,000 0.5% 400,636 -9.9% 187
Oct-18 11 -35% 14 27% 0.79 39 3.55 75 96.0% 343,400 -3.5% 315,000 -14.2% 343,755 6.6% 182
Nov-18 8 -11% 6 -54% 1.33 30 3.75 79 97.2% 337,300 -2.8% 383,700 -2.1% 358,175 -4.4% 179
Dec-18 5 -44% 7 -50% 0.71 20 4.00 50 96.2% 324,100 -5.6% 362,500 -13.5% 351,790 -11.2% 172
2018 126 -9% 220 1% 0.57 40 4.01 51 96.8% 347,875 -1.1% 396,250 0.3% 371,466 -0.8% 185
Jan-19 5 -29% 21 62% 0.24 29 5.80 86 96.6% 326,000 -6.0% 425,000 3.7% 393,100 -2.3% 173
Feb-19 9 80% 15 7% 0.60 30 3.33 60 96.3% 323,400 -7.7% 396,000 55.3% 393,000 41.9% 172
Mar-19 8 -11% 25 19% 0.32 42 5.25 27 96.1% 327,500 -8.8% 379,250 -11.8% 359,375 -16.2% 174
Apr-19 12 -8% 23 -8% 0.52 50 4.17 30 96.8% 328,700 -7.9% 392,500 -16.5% 382,894 -15.7% 175
May-19 15 7% 17 -41% 0.88 40 2.67 43 97.2% 335,800 -4.8% 465,900 17.8% 466,840 30.0% 178
Jun-19
Jul-19
Aug-19
Sep-19
Oct-19
Nov-19
Dec-19
2019 49 -61% 101 -54% 0.49 38 4.24 45 96.7% 328,280 -5.6% 410,000 3.5% 407,650 9.7% 174
TOTAL RESIDENTIAL
ACADIA (215)
-20%
-15%
-10%
-5%
0%
5%
10%
15%
-
1
2
3
4
5
MONTHS OF SUPPLY AND PRICE CHANGE
Months of supply trend (12 M) Benchmark price y/y% change
Source: CREB®
0
10
20
30
40
50
60
0%
20%
40%
60%
80%
100%
120%
SALES TO NEW LISTINGS RATIO AND INVENTORY
Inventory Sales to New listings ratio trend (12 M) Inventory trend (12 M)
Source: CREB®
0
100,000
200,000
300,000
400,000
500,000
600,000
PRICE COMPARISON
Average Median Benchmark Source: CREB®
-
10
20
30
40
50
60
DAYS ON MARKET
Days on market trend (12 M)
Source: CREB®
305,000
310,000
315,000
320,000
325,000
330,000
335,000
340,000
345,000
350,000
355,000
360,000
0
10
20
30
40
50
60
May.
'18
Jun.
'18
Jul.
'18
Aug.
'18
Sep.
'18
Oct.
'18
Nov.
'18
Dec.
'18
Jan.
'19
Feb.
'19
Mar.
'19
Apr.
'19
May.
'19
INVENTORY, SALES AND PRICE
Inventory Sales Benchmark Price Source: CREB®
0
1
2
3
4
5
6
7
8
9
<$200,000 $200,000 -
$299,999
$300,000 -
$399,999
$400,000 -
$499,999
$500,000 -
$599,999
$600,000 -
$699,999
$700,000 -
999,999
$1,000,000+
MONTHS OF SUPPLY BY PRICE RANGE
May-16 May-17 May-18 May-19 Source: CREB®
May
TOTAL RESIDENTIAL
ACADIA (215)
-
2
4
6
8
10
12
14
16
18
20
Jan. Feb. Mar. Apr. May Jun. Jul. Aug. Sept. Oct. Nov. Dec.
SALES COMPARISON
2019 2018 2017 2016
Source: CREB®
0
5
10
15
20
25
<$200,000 $200,000 -
$299,999
$300,000 -
$399,999
$400,000 -
$499,999
$500,000 -
$599,999
$600,000 -
$699,999
$700,000 -
999,999
$1,000,000+
YTD SALES BY PRICE RANGE
YTD-2016 YTD-2017 YTD-2018 YTD-2019
Source: CREB®
YTD-MAY
0
5
10
15
20
25
30
35
40
<$200,000 $200,000 -
$299,999
$300,000 -
$399,999
$400,000 -
$499,999
$500,000 -
$599,999
$600,000 -
$699,999
$700,000 -
999,999
$1,000,000+
YTD NEW LISTINGS BY PRICE RANGE
YTD-2016 YTD-2017 YTD-2018 YTD-2019
Source: CREB®
YTD-MAY
0
2
4
6
8
10
12
14
16
18
<$200,000 $200,000 -
$299,999
$300,000 -
$399,999
$400,000 -
$499,999
$500,000 -
$599,999
$600,000 -
$699,999
$700,000 -
999,999
$1,000,000+
INVENTORY BY PRICE RANGE
May-16 May-17 May-18 May-19
Source: CREB®
May
-
5
10
15
20
25
30
35
Jan. Feb. Mar. Apr. May Jun. Jul. Aug. Sept. Oct. Nov. Dec.
NEW LISTINGS COMPARISON
2019 2018 2017 2016 Source: CREB®
-
10
20
30
40
50
60
Jan. Feb. Mar. Apr. May Jun. Jul. Aug. Sept. Oct. Nov. Dec.
INVENTORY COMPARISON
2019 2018 2017 2016 Source: CREB®
DETACHED
ACADIA (215)
Sales Y/Y%
New
Listings
Y/Y%
S/NL
Ratio
Inventory
Months of
Supply
DOM SP/LP
Benchmark
Price
Y/Y% Median Price Y/Y% Average Price Y/Y% Index
Jan-10 4 -33% 3 -70% 1.33 7 1.75 43 98.5% 375,100 10.9% 354,000 8.6% 358,225 8.6% 159
Feb-10 7 75% 7 -30% 1.00 5 0.71 28 97.9% 368,200 6.5% 360,000 2.1% 360,500 2.6% 156
Mar-10 5 -38% 14 -26% 0.36 12 2.40 21 98.4% 376,000 10.6% 390,000 16.4% 394,400 16.9% 159
Apr-10 8 -33% 16 100% 0.50 19 2.38 31 97.3% 380,500 9.3% 371,250 9.0% 376,781 6.3% 161
May-10 4 -67% 16 78% 0.25 25 6.25 34 96.3% 383,800 7.4% 362,250 8.1% 367,575 2.9% 163
Jun-10 4 -71% 18 38% 0.22 32 8.00 21 97.5% 386,600 5.7% 345,000 -5.0% 348,250 -7.4% 164
Jul-10 6 -14% 11 -8% 0.55 31 5.17 40 96.7% 377,700 1.6% 352,000 -3.6% 375,042 -0.8% 160
Aug-10 8 0% 12 -8% 0.67 26 3.25 55 97.8% 371,500 -1.3% 377,500 -1.9% 390,063 2.3% 157
Sep-10 9 -36% 10 25% 0.90 22 2.44 40 96.5% 368,200 -2.1% 357,000 1.9% 352,889 0.2% 156
Oct-10 2 -60% 10 -9% 0.20 24 12.00 24 95.6% 366,300 -0.9% 334,400 -12.0% 334,400 -13.2% 155
Nov-10 6 -33% 9 50% 0.67 26 4.33 69 96.8% 367,000 -1.5% 370,750 -5.5% 363,542 -8.1% 155
Dec-10 4 0% 6 -14% 0.67 14 3.50 59 95.6% 390,900 5.4% 377,500 -1.2% 371,250 0.4% 166
2010 67 -35% 132 5% 0.51 20 4.35 40 97.2% 375,983 4.1% 369,000 2.5% 368,474 1.2% 159
Jan-11 11 175% 18 500% 0.61 18 1.64 31 96.9% 377,400 0.6% 315,000 -11.0% 330,491 -7.7% 160
Feb-11 6 -14% 13 86% 0.46 21 3.50 22 96.9% 388,300 5.5% 335,375 -6.8% 336,725 -6.6% 164
Mar-11 10 100% 9 -36% 1.11 17 1.70 28 97.0% 388,300 3.3% 372,000 -4.6% 360,250 -8.7% 164
Apr-11 8 0% 11 -31% 0.73 14 1.75 28 98.3% 393,700 3.5% 373,175 0.5% 365,419 -3.0% 167
May-11 15 275% 17 6% 0.88 14 0.93 31 98.5% 392,800 2.3% 360,000 -0.6% 349,801 -4.8% 166
Jun-11 7 75% 11 -39% 0.64 15 2.14 36 96.9% 397,000 2.7% 370,000 7.2% 369,522 6.1% 168
Jul-11 6 0% 11 0% 0.55 18 3.00 22 98.0% 404,100 7.0% 348,750 -0.9% 347,000 -7.5% 171
Aug-11 11 38% 12 0% 0.92 20 1.82 48 97.6% 398,700 7.3% 379,000 0.4% 375,000 -3.9% 169
Sep-11 4 -56% 9 -10% 0.44 20 5.00 52 96.1% 402,900 9.4% 368,750 3.3% 379,375 7.5% 171
Oct-11 5 150% 9 -10% 0.56 20 4.00 43 98.7% 398,500 8.8% 338,000 1.1% 361,980 8.2% 169
Nov-11 8 33% 6 -33% 1.33 15 1.88 63 95.4% 394,200 7.4% 319,500 -13.8% 316,375 -13.0% 167
Dec-11 3 -25% 1 -83% 3.00 10 3.33 43 97.8% 366,300 -6.3% 390,000 3.3% 381,500 2.8% 155
2011 94 40% 127 -4% 0.74 17 2.56 36 97.4% 391,850 4.2% 346,500 -6.1% 353,459 -4.1% 166
Jan-12 4 -64% 6 -67% 0.67 10 2.50 25 97.5% 368,000 -2.5% 391,500 24.3% 387,750 17.3% 156
Feb-12 8 33% 5 -62% 1.60 7 0.88 105 95.8% 376,500 -3.0% 364,375 8.6% 366,338 8.8% 159
Mar-12 6 -40% 12 33% 0.50 12 2.00 27 98.0% 377,000 -2.9% 371,000 -0.3% 381,167 5.8% 160
Apr-12 13 63% 10 -9% 1.30 8 0.62 17 98.7% 383,800 -2.5% 373,000 0.0% 368,423 0.8% 163
May-12 6 -60% 12 -29% 0.50 10 1.67 12 99.2% 389,000 -1.0% 392,550 9.0% 405,850 16.0% 165
Jun-12 9 29% 15 36% 0.60 16 1.78 36 97.8% 394,900 -0.5% 395,000 6.8% 401,389 8.6% 167
Jul-12 10 67% 11 0% 0.91 14 1.40 17 98.4% 408,900 1.2% 385,000 10.4% 379,400 9.3% 173
Aug-12 13 18% 15 25% 0.87 16 1.23 28 97.6% 399,900 0.3% 380,000 0.3% 377,615 0.7% 169
Sep-12 10 150% 12 33% 0.83 16 1.60 45 97.1% 388,300 -3.6% 345,000 -6.4% 352,100 -7.2% 164
Oct-12 8 60% 8 -11% 1.00 9 1.13 23 97.1% 380,500 -4.5% 375,000 10.9% 365,063 0.9% 161
Nov-12 6 -25% 8 33% 0.75 8 1.33 70 96.3% 386,200 -2.0% 394,000 23.3% 387,333 22.4% 164
Dec-12 6 100% 3 200% 2.00 4 0.67 43 96.5% 386,200 5.4% 376,250 -3.5% 382,083 0.2% 164
2012 99 5% 117 -8% 0.85 11 1.40 36 97.6% 386,600 -1.3% 378,000 9.1% 377,442 6.8% 164
Jan-13 3 -25% 4 -33% 0.75 4 1.33 48 99.9% 386,900 5.1% 350,000 -10.6% 392,700 1.3% 164
Feb-13 5 -38% 6 20% 0.83 5 1.00 28 96.3% 392,100 4.1% 390,000 7.0% 395,550 8.0% 166
Mar-13 9 50% 12 0% 0.75 7 0.78 29 98.7% 394,900 4.7% 404,000 8.9% 411,656 8.0% 167
Apr-13 10 -23% 10 0% 1.00 7 0.70 13 99.6% 407,400 6.1% 405,450 8.7% 406,405 10.3% 173
May-13 9 50% 10 -17% 0.90 8 0.89 42 98.1% 409,300 5.2% 388,000 -1.2% 398,378 -1.8% 173
Jun-13 12 33% 10 -33% 1.20 7 0.58 23 98.8% 413,300 4.7% 401,000 1.5% 419,475 4.5% 175
Jul-13 9 -10% 13 18% 0.69 8 0.89 22 98.7% 415,700 1.7% 410,000 6.5% 418,489 10.3% 176
Aug-13 7 -46% 12 -20% 0.58 11 1.57 19 97.5% 409,600 2.4% 423,000 11.3% 429,486 13.7% 173
Sep-13 10 0% 6 -50% 1.67 3 0.30 28 98.1% 410,500 5.7% 411,250 19.2% 410,150 16.5% 174
Oct-13 8 0% 13 63% 0.62 4 0.50 18 98.9% 414,800 9.0% 418,750 11.7% 426,500 16.8% 176
Nov-13 14 133% 7 -13% 2.00 1 0.07 23 98.6% 419,500 8.6% 410,000 4.1% 412,843 6.6% 178
Dec-13 1 -83% 2 -33% 0.50 2 2.00 15 98.8% 420,900 9.0% 405,000 7.6% 405,000 6.0% 178
2013 97 -2% 105 -10% 0.92 6 0.88 25 98.5% 407,908 5.5% 407,000 7.7% 412,526 9.3% 173
Jan-14 5 67% 4 0% 1.25 1 0.20 31 98.4% 417,600 7.9% 417,500 19.3% 424,900 8.2% 177
Feb-14 2 -60% 4 -33% 0.50 2 1.00 6 99.2% 421,400 7.5% 435,750 11.7% 435,750 10.2% 178
Mar-14 5 -44% 7 -42% 0.71 3 0.60 23 98.9% 421,400 6.7% 440,000 8.9% 439,200 6.7% 178
Apr-14 10 0% 14 40% 0.71 8 0.80 13 99.9% 436,200 7.1% 448,750 10.7% 440,450 8.4% 185
May-14 16 78% 14 40% 1.14 3 0.19 18 100.2% 441,000 7.7% 467,250 20.4% 465,163 16.8% 187
Jun-14 4 -67% 8 -20% 0.50 7 1.75 14 99.9% 444,800 7.6% 414,700 3.4% 436,600 4.1% 188
Jul-14 8 -11% 11 -15% 0.73 11 1.38 23 98.9% 444,500 6.9% 445,500 8.7% 466,375 11.4% 188
Aug-14 9 29% 9 -25% 1.00 10 1.11 28 98.8% 440,300 7.5% 424,900 0.4% 437,989 2.0% 186
Sep-14 5 -50% 7 17% 0.71 7 1.40 28 99.1% 448,800 9.3% 472,000 14.8% 460,534 12.3% 190
Oct-14 10 25% 12 -8% 0.83 8 0.80 26 98.1% 447,800 8.0% 473,500 13.1% 479,450 12.4% 190
Nov-14 7 -50% 7 0% 1.00 7 1.00 35 97.5% 443,600 5.7% 427,000 4.1% 437,000 5.9% 188
Dec-14 3 200% 4 100% 0.75 9 3.00 29 96.3% 447,800 6.4% 425,000 4.9% 424,667 4.9% 190
2014 84 -13% 101 -4% 0.83 6 1.10 23 99.0% 437,933 7.4% 449,500 10.4% 451,055 9.3% 185
DETACHED
ACADIA (215)
Sales Y/Y%
New
Listings
Y/Y%
S/NL
Ratio
Inventory
Months of
Supply
DOM SP/LP
Benchmark
Price
Y/Y% Median Price Y/Y% Average Price Y/Y% Index
Jan-15 3 -40% 16 300% 0.19 19 6.33 12 99.7% 455,600 9.1% 475,000 13.8% 481,633 13.4% 193
Feb-15 11 450% 13 225% 0.85 16 1.45 15 97.7% 449,000 6.5% 440,000 1.0% 437,023 0.3% 190
Mar-15 9 80% 11 57% 0.82 11 1.22 40 97.4% 441,700 4.8% 439,000 -0.2% 438,833 -0.1% 187
Apr-15 15 50% 12 -14% 1.25 10 0.67 33 97.8% 443,300 1.6% 436,000 -2.8% 436,300 -0.9% 188
May-15 10 -38% 15 7% 0.67 11 1.10 24 98.2% 431,300 -2.2% 427,375 -8.5% 436,005 -6.3% 183
Jun-15 14 250% 7 -13% 2.00 5 0.36 35 98.3% 431,100 -3.1% 419,050 1.0% 450,510 3.2% 183
Jul-15 5 -38% 8 -27% 0.63 7 1.40 23 96.6% 432,700 -2.7% 419,000 -5.9% 430,400 -7.7% 183
Aug-15 5 -44% 6 -33% 0.83 8 1.60 26 97.7% 428,000 -2.8% 440,000 3.6% 439,500 0.3% 181
Sep-15 5 0% 8 14% 0.63 7 1.40 43 96.9% 427,700 -4.7% 425,000 -10.0% 438,000 -4.9% 181
Oct-15 7 -30% 9 -25% 0.78 9 1.29 21 97.4% 425,100 -5.1% 416,000 -12.1% 422,143 -12.0% 180
Nov-15 3 -57% 3 -57% 1.00 7 2.33 31 96.4% 414,800 -6.5% 415,500 -2.7% 427,167 -2.3% 176
Dec-15 5 67% 5 25% 1.00 5 1.00 21 97.3% 408,100 -8.9% 380,000 -10.6% 391,900 -7.7% 173
2015 92 10% 113 12% 0.81 10 1.68 28 97.7% 432,367 -1.3% 425,000 -5.5% 436,400 -3.2% 183
Jan-16 3 0% 10 -38% 0.30 11 3.67 16 98.1% 412,200 -9.5% 403,000 -15.2% 410,167 -14.8% 175
Feb-16 7 -36% 6 -54% 1.17 11 1.57 50 95.6% 424,000 -5.6% 393,000 -10.7% 410,429 -6.1% 180
Mar-16 5 -44% 8 -27% 0.63 12 2.40 15 98.5% 424,700 -3.8% 447,000 1.8% 435,200 -0.8% 180
Apr-16 10 -33% 12 0% 0.83 13 1.30 41 98.0% 435,500 -1.8% 420,500 -3.6% 423,200 -3.0% 184
May-16 7 -30% 10 -33% 0.70 10 1.43 19 98.6% 442,400 2.6% 415,000 -2.9% 423,443 -2.9% 187
Jun-16 5 -64% 9 29% 0.56 10 2.00 29 100.7% 436,200 1.2% 438,000 4.5% 436,300 -3.2% 185
Jul-16 8 60% 6 -25% 1.33 6 0.75 29 97.8% 433,200 0.1% 429,250 2.4% 438,206 1.8% 183
Aug-16 6 20% 5 -17% 1.20 6 1.00 56 96.2% 424,200 -0.9% 432,000 -1.8% 459,000 4.4% 180
Sep-16 5 0% 7 -13% 0.71 9 1.80 18 98.1% 433,900 1.4% 477,500 12.4% 469,900 7.3% 184
Oct-16 6 -14% 8 -11% 0.75 10 1.67 66 97.8% 446,400 5.0% 490,000 17.8% 482,417 14.3% 189
Nov-16 9 200% 10 233% 0.90 8 0.89 23 98.1% 439,600 6.0% 430,000 3.5% 426,278 -0.2% 186
Dec-16 2 -60% 1 -80% 2.00 3 1.50 75 96.8% 437,700 7.3% 427,750 12.6% 427,750 9.1% 185
2016 73 -21% 92 -19% 0.79 9 1.66 35 97.8% 432,500 0.0% 429,000 0.9% 436,339 0.0% 183
Jan-17 4 33% 5 -50% 0.80 5 1.25 43 97.9% 437,200 6.1% 445,500 10.5% 483,000 17.8% 185
Feb-17 6 -14% 7 17% 0.86 4 0.67 16 98.3% 436,000 2.8% 475,250 20.9% 448,083 9.2% 185
Mar-17 4 -20% 9 13% 0.44 10 2.50 34 96.7% 437,000 2.9% 434,000 -2.9% 447,200 2.8% 185
Apr-17 6 -40% 10 -17% 0.60 11 1.83 56 97.8% 454,400 4.3% 469,500 11.7% 489,000 15.5% 192
May-17 13 86% 13 30% 1.00 13 1.00 27 97.6% 459,900 4.0% 450,000 8.4% 460,500 8.8% 195
Jun-17 8 60% 16 78% 0.50 20 2.50 21 98.7% 463,600 6.3% 441,250 0.7% 450,875 3.3% 196
Jul-17 11 38% 10 67% 1.10 14 1.27 22 98.2% 467,400 7.9% 455,000 6.0% 467,655 6.7% 198
Aug-17 6 0% 10 100% 0.60 16 2.67 66 97.4% 464,600 9.5% 443,500 2.7% 460,317 0.3% 197
Sep-17 4 -20% 11 57% 0.36 22 5.50 44 96.6% 468,400 8.0% 522,250 9.4% 531,000 13.0% 198
Oct-17 10 67% 9 13% 1.11 16 1.60 37 97.2% 460,300 3.1% 394,000 -19.6% 421,000 -12.7% 195
Nov-17 6 -33% 5 -50% 1.20 12 2.00 54 98.1% 447,800 1.9% 417,500 -2.9% 429,833 0.8% 190
Dec-17 7 250% 10 900% 0.70 12 1.71 59 98.2% 442,600 1.1% 430,000 0.5% 437,200 2.2% 187
2017 85 16% 115 25% 0.74 13 2.04 37 97.8% 453,267 4.8% 445,000 3.7% 456,662 4.7% 192
Jan-18 5 25% 5 0% 1.00 11 2.20 59 96.5% 453,000 3.6% 425,500 -4.5% 493,600 2.2% 192
Feb-18 1 -83% 9 29% 0.11 17 17.00 33 95.2% 457,700 5.0% 400,000 -15.8% 400,000 -10.7% 194
Mar-18 7 75% 16 78% 0.44 22 3.14 27 98.1% 470,500 7.7% 443,000 2.1% 491,929 10.0% 199
Apr-18 12 100% 19 90% 0.63 28 2.33 20 97.6% 465,500 2.4% 477,500 1.7% 474,450 -3.0% 197
May-18 8 -38% 16 23% 0.50 29 3.63 25 98.4% 458,000 -0.4% 416,750 -7.4% 444,438 -3.5% 194
Jun-18 9 13% 14 -13% 0.64 26 2.89 35 96.3% 459,200 -0.9% 420,000 -4.8% 420,583 -6.7% 194
Jul-18 7 -36% 19 90% 0.37 32 4.57 58 97.4% 462,200 -1.1% 431,000 -5.3% 466,286 -0.3% 196
Aug-18 7 17% 13 30% 0.54 30 4.29 23 96.2% 446,900 -3.8% 423,000 -4.6% 431,643 -6.2% 189
Sep-18 9 125% 18 64% 0.50 29 3.22 27 97.3% 456,300 -2.6% 552,500 5.8% 531,349 0.1% 193
Oct-18 4 -60% 11 22% 0.36 31 7.75 22 96.5% 442,600 -3.8% 438,750 11.4% 460,625 9.4% 187
Nov-18 5 -17% 3 -40% 1.67 23 4.60 50 97.8% 438,100 -2.2% 400,000 -4.2% 469,480 9.2% 186
Dec-18 3 -57% 6 -40% 0.50 16 5.33 37 96.1% 413,800 -6.5% 395,050 -8.1% 409,683 -6.3% 175
2018 77 -9% 149 30% 0.52 25 5.08 33 97.2% 451,983 -0.3% 431,000 -3.1% 465,354 1.9% 191
Jan-19 4 -20% 15 200% 0.27 20 5.00 104 96.4% 419,500 -7.4% 432,500 1.6% 446,875 -9.5% 178
Feb-19 5 400% 11 22% 0.45 23 4.60 77 96.4% 414,800 -9.4% 460,000 15.0% 497,600 24.4% 176
Mar-19 6 -14% 18 13% 0.33 30 5.00 24 95.9% 420,400 -10.6% 395,000 -10.8% 403,167 -18.0% 178
Apr-19 10 -17% 18 -5% 0.56 35 3.50 29 96.7% 424,400 -8.8% 399,500 -16.3% 412,323 -13.1% 180
May-19 14 75% 12 -25% 1.17 23 1.64 43 97.3% 432,000 -5.7% 471,700 13.2% 482,686 8.6% 183
Jun-19
Jul-19
Aug-19
Sep-19
Oct-19
Nov-19
Dec-19
2019 39 -49% 74 -50% 0.53 26 3.95 47 96.7% 422,220 -6.6% 435,500 1.0% 450,649 -3.2% 179
DETACHED
ACADIA (215)
-20%
-15%
-10%
-5%
0%
5%
10%
15%
-
1
2
3
4
5
6
MONTHS OF SUPPLY AND PRICE CHANGE
Months of Supply trend (12 M) Benchmark price y/y % Change
Source: CREB®
0
5
10
15
20
25
30
35
40
0%
20%
40%
60%
80%
100%
120%
SALES TO NEW LISTINGS RATIO AND INVENTORY
Inventory Sales to New listings ratio trend (12 M) Inventory Trend (12 M)
Source: CREB®
0
100,000
200,000
300,000
400,000
500,000
600,000
PRICE COMPARISON
Average Median Benchmark Source: CREB®
-
5
10
15
20
25
30
35
40
45
50
DAYS ON MARKET
Days on market trend (12 M)
Source: CREB®
380,000
390,000
400,000
410,000
420,000
430,000
440,000
450,000
460,000
470,000
0
5
10
15
20
25
30
35
40
May.
'18
Jun.
'18
Jul.
'18
Aug.
'18
Sep.
'18
Oct.
'18
Nov.
'18
Dec.
'18
Jan.
'19
Feb.
'19
Mar.
'19
Apr.
'19
May.
'19
INVENTORY, SALES AND PRICE
Inventory Sales Benchmark Price Source: CREB®
0
1
2
3
4
5
6
7
<$200,000 $200,000 -
$299,999
$300,000 -
$399,999
$400,000 -
$499,999
$500,000 -
$599,999
$600,000 -
$699,999
$700,000 -
999,999
$1,000,000+
MONTHS OF SUPPLY BY PRICE RANGE
May-16 May-17 May-18 May-19 Source: CREB®
May
DETACHED
ACADIA (215)
-
2
4
6
8
10
12
14
16
Jan. Feb. Mar. Apr. May Jun. Jul. Aug. Sept. Oct. Nov. Dec.
SALES COMPARISON
2019 2018 2017 2016
Source: CREB®
0
5
10
15
20
25
<$200,000 $200,000 -
$299,999
$300,000 -
$399,999
$400,000 -
$499,999
$500,000 -
$599,999
$600,000 -
$699,999
$700,000 -
999,999
$1,000,000+
YTD SALES BY PRICE RANGE
YTD-2016 YTD-2017 YTD-2018 YTD-2019
Source: CREB®
YTD-MAY
0
5
10
15
20
25
30
35
40
<$200,000 $200,000 -
$299,999
$300,000 -
$399,999
$400,000 -
$499,999
$500,000 -
$599,999
$600,000 -
$699,999
$700,000 -
999,999
$1,000,000+
YTD NEW LISTINGS BY PRICE RANGE
YTD-2016 YTD-2017 YTD-2018 YTD-2019
Source: CREB®
YTD-MAY
0
2
4
6
8
10
12
14
16
18
<$200,000 $200,000 -
$299,999
$300,000 -
$399,999
$400,000 -
$499,999
$500,000 -
$599,999
$600,000 -
$699,999
$700,000 -
999,999
$1,000,000+
INVENTORY BY PRICE RANGE
May-16 May-17 May-18 May-19
Source: CREB®
May
-
2
4
6
8
10
12
14
16
18
20
Jan. Feb. Mar. Apr. May Jun. Jul. Aug. Sept. Oct. Nov. Dec.
NEW LISTINGS COMPARISON
2019 2018 2017 2016 Source: CREB®
-
5
10
15
20
25
30
35
40
Jan. Feb. Mar. Apr. May Jun. Jul. Aug. Sept. Oct. Nov. Dec.
INVENTORY COMPARISON
2019 2018 2017 2016 Source: CREB®
APARTMENT
ACADIA (215)
Sales Y/Y%
New
Listings
Y/Y%
S/NL
Ratio
Inventory
Months of
Supply
DOM SP/LP
Benchmark
Price
Y/Y% Median Price Y/Y% Average Price Y/Y% Index
Jan-10 1 6 200% 0.17 7 7.00 12 98.7% 190,800 2.8% 183,000 183,000 177
Feb-10 3 50% 4 -33% 0.75 7 2.33 42 95.2% 193,300 7.4% 306,000 66.3% 297,667 61.8% 180
Mar-10 2 100% 7 75% 0.29 11 5.50 31 96.9% 194,400 9.2% 237,250 58.2% 237,250 58.2% 181
Apr-10 1 0% 12 200% 0.08 21 21.00 22 97.2% 196,300 7.9% 320,500 83.1% 320,500 83.1% 183
May-10 3 -25% 8 33% 0.38 23 7.67 47 97.9% 195,700 9.5% 290,000 43.9% 270,333 22.3% 182
Jun-10 3 50% 1 -75% 3.00 15 5.00 67 97.1% 193,500 6.0% 179,500 -3.8% 181,000 -2.9% 180
Jul-10 1 -50% 5 0% 0.20 10 10.00 85 97.8% 190,800 1.5% 174,500 -41.1% 174,500 -41.1% 177
Aug-10 1 -75% 4 0% 0.25 9 9.00 23 96.9% 189,200 0.1% 147,750 -26.9% 147,750 -29.7% 176
Sep-10 5 0% 4 0% 1.25 8 1.60 51 95.5% 186,700 -0.4% 180,000 -2.7% 239,500 15.9% 174
Oct-10 - 2 -50% 10 181,100 -4.3% 168
Nov-10 1 -67% 3 200% 0.33 8 8.00 43 96.7% 178,400 -3.7% 145,000 -18.5% 145,000 -29.0% 166
Dec-10 3 5 400% 0.60 7 2.33 68 90.1% 174,900 -8.5% 174,000 221,333 163
2010 24 0% 61 36% 0.39 11 7.22 49 95.7% 188,758 2.2% 185,500 -0.3% 231,406 10.4% 176
Jan-11 1 0% 3 -50% 0.33 8 8.00 39 96.9% 171,600 -10.1% 155,000 -15.3% 155,000 -15.3% 160
Feb-11 - 2 -50% 10 175,000 -9.5% 163
Mar-11 1 -50% 3 -57% 0.33 12 12.00 97 95.5% 171,600 -11.7% 143,000 -39.7% 143,000 -39.7% 160
Apr-11 1 0% 5 -58% 0.20 13 13.00 93 95.9% 178,000 -9.3% 230,000 -28.2% 230,000 -28.2% 166
May-11 3 0% 8 0% 0.38 14 4.67 69 95.2% 176,200 -10.0% 158,000 -45.5% 171,233 -36.7% 164
Jun-11 5 67% 9 800% 0.56 17 3.40 54 95.4% 179,900 -7.0% 300,000 67.1% 255,700 41.3% 167
Jul-11 3 200% 2 -60% 1.50 14 4.67 63 97.2% 179,600 -5.9% 231,500 32.7% 265,500 52.1% 167
Aug-11 3 200% - 8 2.67 102 95.6% 182,400 -3.6% 144,700 -2.1% 180,900 22.4% 170
Sep-11 1 -80% 5 25% 0.20 7 7.00 97 95.9% 182,300 -2.4% 115,000 -36.1% 115,000 -52.0% 170
Oct-11 1 5 150% 0.20 8 8.00 59 99.5% 180,300 -0.4% 278,500 278,500 168
Nov-11 1 0% - 4 4.00 53 97.6% 181,100 1.5% 200,000 37.9% 200,000 37.9% 168
Dec-11 2 -33% 1 -80% 2.00 2 1.00 60 95.0% 187,200 7.0% 140,000 -19.5% 140,000 -36.7% 174
2011 22 -8% 43 -30% 0.51 10 6.22 70 96.1% 178,767 -5.3% 166,500 -10.2% 206,041 -11.0% 166
Jan-12 2 100% 5 67% 0.40 4 2.00 62 93.4% 183,600 7.0% 179,750 16.0% 179,750 16.0% 171
Feb-12 - 2 0% 6 183,800 5.0% 171
Mar-12 2 100% 4 33% 0.50 7 3.50 34 88.6% 181,900 6.0% 264,000 84.6% 264,000 84.6% 169
Apr-12 3 200% 2 -60% 1.50 5 1.67 47 93.2% 184,300 3.5% 140,000 -39.1% 184,833 -19.6% 171
May-12 - 1 -88% 5 187,500 6.4% 174
Jun-12 1 -80% 4 -56% 0.25 7 7.00 53 97.8% 187,900 4.4% 322,500 7.5% 322,500 26.1% 175
Jul-12 6 100% 4 100% 1.50 5 0.83 42 97.3% 185,000 3.0% 278,000 20.1% 259,333 -2.3% 172
Aug-12 4 33% 5 0.80 5 1.25 10 97.7% 183,200 0.4% 253,500 75.2% 243,750 34.7% 170
Sep-12 2 100% 4 -20% 0.50 4 2.00 39 95.6% 179,700 -1.4% 246,000 113.9% 246,000 113.9% 167
Oct-12 1 0% 3 -40% 0.33 7 7.00 12 100.0% 183,500 1.8% 282,000 1.3% 282,000 1.3% 171
Nov-12 2 100% 2 1.00 7 3.50 53 96.8% 181,500 0.2% 219,750 9.9% 219,750 9.9% 169
Dec-12 2 0% 1 0% 2.00 3 1.50 83 97.4% 179,600 -4.1% 192,000 37.1% 192,000 37.1% 167
2012 25 14% 37 -14% 0.68 5 3.03 42 95.8% 183,458 2.6% 250,000 50.2% 235,720 14.4% 171
Jan-13 - 2 -60% 4 178,700 -2.7% 166
Feb-13 3 5 150% 0.60 5 1.67 29 96.2% 181,300 -1.4% 179,000 176,333 169
Mar-13 4 100% 8 100% 0.50 8 2.00 15 98.7% 184,000 1.2% 187,250 -29.1% 211,375 -19.9% 171
Apr-13 4 33% 5 150% 0.80 9 2.25 27 98.4% 187,600 1.8% 172,300 23.1% 171,625 -7.1% 174
May-13 7 4 300% 1.75 4 0.57 48 97.2% 193,100 3.0% 231,500 254,714 180
Jun-13 3 200% 4 0% 0.75 4 1.33 46 97.0% 193,900 3.2% 172,000 -46.7% 255,000 -20.9% 180
Jul-13 7 17% 4 0% 1.75 2 0.29 41 96.9% 191,300 3.4% 162,000 -41.7% 172,571 -33.5% 178
Aug-13 1 -75% 6 20% 0.17 5 5.00 16 97.2% 189,100 3.2% 170,000 -32.9% 170,000 -30.3% 176
Sep-13 6 200% 4 0% 1.50 3 0.50 25 97.6% 186,800 4.0% 172,750 -29.8% 205,866 -16.3% 174
Oct-13 4 300% 3 0% 1.33 2 0.50 35 97.0% 187,500 2.2% 157,500 -44.1% 194,875 -30.9% 174
Nov-13 2 0% 4 100% 0.50 3 1.50 16 95.0% 186,100 2.5% 166,250 -24.3% 166,250 -24.3% 173
Dec-13 2 0% 2 100% 1.00 4 2.00 40 97.7% 186,900 4.1% 251,500 31.0% 251,500 31.0% 174
2013 43 72% 51 38% 0.84 4 1.60 33 97.3% 187,192 2.0% 170,000 -32.0% 205,516 -12.8% 174
Jan-14 4 5 150% 0.80 3 0.75 25 99.3% 189,900 6.3% 252,961 255,656 177
Feb-14 3 0% 4 -20% 0.75 5 1.67 14 98.7% 195,400 7.8% 326,000 82.1% 270,500 53.4% 182
Mar-14 5 25% 2 -75% 2.50 2 0.40 39 96.6% 202,800 10.2% 268,000 43.1% 268,100 26.8% 189
Apr-14 1 -75% 1 -80% 1.00 2 2.00 40 95.5% 204,000 8.7% 210,000 21.9% 210,000 22.4% 190
May-14 1 -86% 2 -50% 0.50 1 1.00 29 97.5% 206,300 6.8% 190,000 -17.9% 190,000 -25.4% 192
Jun-14 3 0% 3 -25% 1.00 2 0.67 20 96.7% 204,300 5.4% 160,000 -7.0% 204,667 -19.7% 190
Jul-14 2 -71% 5 25% 0.40 3 1.50 25 98.7% 207,800 8.6% 227,000 40.1% 227,000 31.5% 193
Aug-14 1 0% 4 -33% 0.25 5 5.00 23 96.4% 206,800 9.4% 217,000 27.6% 217,000 27.6% 192
Sep-14 8 33% 5 25% 1.60 3 0.38 29 97.6% 207,500 11.1% 221,250 28.1% 257,125 24.9% 193
Oct-14 3 -25% 6 100% 0.50 5 1.67 40 98.5% 206,000 9.9% 260,000 65.1% 296,633 52.2% 192
Nov-14 1 -50% 5 25% 0.20 8 8.00 45 96.1% 213,700 14.8% 148,900 -10.4% 148,900 -10.4% 199
Dec-14 2 0% 1 -50% 2.00 4 2.00 24 95.2% 214,600 14.8% 173,000 -31.2% 173,000 -31.2% 200
2014 34 -21% 43 -16% 0.79 4 2.09 29 97.6% 204,925 9.5% 220,750 29.9% 244,159 18.8% 191
APARTMENT
ACADIA (215)
Sales Y/Y%
New
Listings
Y/Y%
S/NL
Ratio
Inventory
Months of
Supply
DOM SP/LP
Benchmark
Price
Y/Y% Median Price Y/Y% Average Price Y/Y% Index
Jan-15 - 8 60% 11 213,500 12.4% 199
Feb-15 4 33% 1 -75% 4.00 7 1.75 34 98.6% 210,000 7.5% 183,000 -43.9% 227,875 -15.8% 195
Mar-15 3 -40% 4 100% 0.75 5 1.67 56 94.0% 210,800 3.9% 167,000 -37.7% 181,667 -32.2% 196
Apr-15 4 300% 5 400% 0.80 6 1.50 28 97.5% 210,900 3.4% 199,000 -5.2% 226,500 7.9% 196
May-15 1 0% 3 50% 0.33 7 7.00 11 98.5% 208,100 0.9% 160,500 -15.5% 160,500 -15.5% 194
Jun-15 1 -67% 5 67% 0.20 7 7.00 12 97.9% 209,000 2.3% 318,000 98.8% 318,000 55.4% 194
Jul-15 2 0% 3 -40% 0.67 9 4.50 49 97.2% 207,000 -0.4% 192,000 -15.4% 192,000 -15.4% 193
Aug-15 2 100% 2 -50% 1.00 4 2.00 32 97.2% 204,100 -1.3% 180,800 -16.7% 180,800 -16.7% 190
Sep-15 2 -75% 4 -20% 0.50 4 2.00 68 97.6% 200,600 -3.3% 243,500 10.1% 243,500 -5.3% 187
Oct-15 1 -67% 2 -67% 0.50 4 4.00 28 97.0% 199,300 -3.3% 189,000 -27.3% 189,000 -36.3% 185
Nov-15 3 200% 1 -80% 3.00 3 1.00 47 92.0% 200,100 -6.4% 250,000 67.9% 223,667 50.2% 186
Dec-15 - - 3 198,300 -7.6% 184
2015 23 -32% 38 -12% 0.61 6 3.24 39 96.5% 205,975 0.5% 189,000 -14.4% 214,504 -12.1% 192
Jan-16 - 5 -38% 6 196,600 -7.9% 183
Feb-16 - 3 200% 9 194,900 -7.2% 181
Mar-16 5 67% 4 0% 1.25 8 1.60 37 97.6% 193,400 -8.3% 205,000 22.8% 252,900 39.2% 180
Apr-16 4 0% 4 -20% 1.00 7 1.75 53 96.5% 195,700 -7.2% 249,000 25.1% 256,225 13.1% 182
May-16 1 0% 3 0% 0.33 7 7.00 113 98.5% 194,100 -6.7% 186,000 15.9% 186,000 15.9% 181
Jun-16 2 100% 3 -40% 0.67 7 3.50 44 96.4% 195,700 -6.4% 231,300 -27.3% 231,300 -27.3% 182
Jul-16 2 0% 4 33% 0.50 6 3.00 36 96.3% 196,500 -5.1% 204,000 6.3% 204,000 6.3% 183
Aug-16 - 6 200% 11 191,100 -6.4% 178
Sep-16 2 0% 3 -25% 0.67 10 5.00 74 95.5% 192,600 -4.0% 169,500 -30.4% 169,500 -30.4% 179
Oct-16 1 0% 4 100% 0.25 12 12.00 85 96.4% 191,400 -4.0% 395,000 109.0% 395,000 109.0% 178
Nov-16 2 -33% 4 300% 0.50 12 6.00 46 98.1% 186,700 -6.7% 255,000 2.0% 255,000 14.0% 174
Dec-16 - 1 8 178,200 -10.1% 166
2016 19 -17% 44 16% 0.43 9 4.98 52 96.9% 192,242 -6.7% 200,000 5.8% 241,579 12.6% 179
Jan-17 2 5 0% 0.40 8 4.00 53 96.8% 176,500 -10.2% 212,500 212,500 164
Feb-17 3 6 100% 0.50 9 3.00 43 94.3% 175,600 -9.9% 207,500 193,333 163
Mar-17 2 -60% 7 75% 0.29 13 6.50 15 97.4% 179,900 -7.0% 223,000 8.8% 223,000 -11.8% 167
Apr-17 4 0% 6 50% 0.67 13 3.25 45 97.3% 186,500 -4.7% 257,500 3.4% 275,500 7.5% 173
May-17 3 200% 8 167% 0.38 14 4.67 26 97.9% 184,700 -4.8% 160,000 -14.0% 156,333 -15.9% 172
Jun-17 2 0% 6 100% 0.33 17 8.50 54 96.8% 182,300 -6.8% 149,000 -35.6% 149,000 -35.6% 170
Jul-17 3 50% 7 75% 0.43 16 5.33 48 98.0% 181,700 -7.5% 366,000 79.4% 301,500 47.8% 169
Aug-17 4 5 -17% 0.80 15 3.75 86 97.5% 181,900 -4.8% 262,500 272,750 169
Sep-17 3 50% 7 133% 0.43 15 5.00 33 97.2% 181,500 -5.8% 332,500 96.2% 330,000 94.7% 169
Oct-17 5 400% 2 -50% 2.50 12 2.40 47 95.4% 179,900 -6.0% 165,500 -58.1% 179,613 -54.5% 167
Nov-17 - 6 50% 14 172,800 -7.4% 161
Dec-17 2 3 200% 0.67 12 6.00 153 96.1% 170,800 -4.2% 253,500 253,500 159
2017 33 74% 68 55% 0.49 13 4.76 53 96.8% 179,508 -6.6% 197,000 -1.5% 233,653 -3.3% 167
Jan-18 2 0% 7 40% 0.29 11 5.50 42 95.3% 169,400 -4.0% 173,750 -18.2% 173,750 -18.2% 158
Feb-18 1 -67% 4 -33% 0.25 15 15.00 81 92.8% 169,700 -3.4% 255,000 22.9% 255,000 31.9% 158
Mar-18 1 -50% 2 -71% 0.50 14 14.00 313 94.5% 173,800 -3.4% 208,000 -6.7% 208,000 -6.7% 162
Apr-18 - 4 -33% 15 176,400 -5.4% 164
May-18 3 0% 8 0% 0.38 17 5.67 89 96.4% 175,700 -4.9% 234,000 46.2% 255,500 63.4% 163
Jun-18 2 0% 4 -33% 0.50 17 8.50 30 93.9% 181,000 -0.7% 131,000 -12.1% 131,000 -12.1% 168
Jul-18 3 0% 4 -43% 0.75 15 5.00 55 95.0% 177,700 -2.2% 165,000 -54.9% 177,300 -41.2% 165
Aug-18 2 -50% 5 0% 0.40 16 8.00 191 97.3% 180,800 -0.6% 197,500 -24.8% 197,500 -27.6% 168
Sep-18 4 33% 3 -57% 1.33 9 2.25 97 97.1% 180,900 -0.3% 178,450 -46.3% 197,725 -40.1% 168
Oct-18 4 -20% 2 0% 2.00 5 1.25 81 96.1% 181,400 0.8% 277,000 67.4% 259,950 44.7% 169
Nov-18 2 1 -83% 2.00 3 1.50 144 94.5% 175,700 1.7% 145,000 145,000 163
Dec-18 1 -50% 1 -67% 1.00 2 2.00 106 94.1% 174,100 1.9% 320,000 26.2% 320,000 26.2% 162
2018 25 -24% 45 -34% 0.56 12 6.24 98 95.7% 176,383 -1.7% 202,000 2.5% 208,264 -10.9% 164
Jan-19 1 -50% 3 -57% 0.33 4 4.00 14 98.9% 175,800 3.8% 178,000 2.4% 178,000 2.4% 164
Feb-19 1 0% 3 -25% 0.33 5 5.00 21 97.3% 172,300 1.5% 267,000 4.7% 267,000 4.7% 160
Mar-19 - 4 100% 0.00 9 176,400 1.5% 164
Apr-19 - 4 0% 0.00 13 172,100 -2.4% 160
May-19 - 2 -75% 0.00 14 177,200 0.9% 165
Jun-19
Jul-19
Aug-19
Sep-19
Oct-19
Nov-19
Dec-19
2019 2 -92% 16 -64% 0.13 9 4.50 18 97.9% 174,760 -0.9% 222,500 10.1% 222,500 6.8% 163
APARTMENT
ACADIA (215)
-20%
-15%
-10%
-5%
0%
5%
10%
15%
20%
-
1
2
3
4
5
6
7
8
9
MONTHS OF SUPPLY AND PRICE CHANGE
Months of Supply trend (12 M) Benchmark price y/y % Change
Source: CREB®
0
5
10
15
20
25
0%
20%
40%
60%
80%
100%
120%
140%
SALES TO NEW LISTINGS RATIO AND INVENTORY
Inventory Sales to New listings ratio trend (12 M) Inventory Trend (12 M)
Source: CREB®
0
50,000
100,000
150,000
200,000
250,000
300,000
350,000
400,000
450,000
PRICE COMPARISON
Average Median Benchmark Source: CREB®
-
20
40
60
80
100
120
140
DAYS ON MARKET
Days on market trend (12 M)
Source: CREB®
166,000
168,000
170,000
172,000
174,000
176,000
178,000
180,000
182,000
184,000
0
2
4
6
8
10
12
14
16
18
May.
'18
Jun.
'18
Jul.
'18
Aug.
'18
Sep.
'18
Oct.
'18
Nov.
'18
Dec.
'18
Jan.
'19
Feb.
'19
Mar.
'19
Apr.
'19
May.
'19
INVENTORY, SALES AND PRICE
Inventory Sales Benchmark Price Source: CREB®
0
1
2
3
4
5
<$200,000 $200,000 -
$299,999
$300,000 -
$399,999
$400,000 -
$499,999
$500,000 -
$599,999
$600,000 -
$699,999
$700,000 -
999,999
$1,000,000+
MONTHS OF SUPPLY BY PRICE RANGE
May-16 May-17 May-18 May-19 Source: CREB®
May
APARTMENT
ACADIA (215)
-
1
2
3
4
5
6
Jan. Feb. Mar. Apr. May Jun. Jul. Aug. Sept. Oct. Nov. Dec.
SALES COMPARISON
2019 2018 2017 2016
Source: CREB®
0
1
2
3
4
5
6
7
8
<$200,000 $200,000 -
$299,999
$300,000 -
$399,999
$400,000 -
$499,999
$500,000 -
$599,999
$600,000 -
$699,999
$700,000 -
999,999
$1,000,000+
YTD SALES BY PRICE RANGE
YTD-2016 YTD-2017 YTD-2018 YTD-2019
Source: CREB®
YTD-MAY
0
5
10
15
20
25
<$200,000 $200,000 -
$299,999
$300,000 -
$399,999
$400,000 -
$499,999
$500,000 -
$599,999
$600,000 -
$699,999
$700,000 -
999,999
$1,000,000+
YTD NEW LISTINGS BY PRICE RANGE
YTD-2016 YTD-2017 YTD-2018 YTD-2019
Source: CREB®
YTD-MAY
0
1
2
3
4
5
6
7
8
9
10
11
12
13
14
<$200,000 $200,000 -
$299,999
$300,000 -
$399,999
$400,000 -
$499,999
$500,000 -
$599,999
$600,000 -
$699,999
$700,000 -
999,999
$1,000,000+
INVENTORY BY PRICE RANGE
May-16 May-17 May-18 May-19
Source: CREB®
May
-
1
2
3
4
5
6
7
8
9
Jan. Feb. Mar. Apr. May Jun. Jul. Aug. Sept. Oct. Nov. Dec.
NEW LISTINGS COMPARISON
2019 2018 2017 2016 Source: CREB®
-
2
4
6
8
10
12
14
16
18
Jan. Feb. Mar. Apr. May Jun. Jul. Aug. Sept. Oct. Nov. Dec.
INVENTORY COMPARISON
2019 2018 2017 2016 Source: CREB®
SEMI DETACHED
ACADIA (215)
Sales Y/Y%
New
Listings
Y/Y%
S/NL
Ratio
Inventory
Months of
Supply
DOM SP/LP
Benchmark
Price
Y/Y% Median Price Y/Y% Average Price Y/Y% Index
Share of
Sales
Condo
Jan-10 1 1 1.00 0 0.00 9 98.4% 295,000 295,000 0%
Feb-10 1 1 0% 1.00 0 0.00 3 98.4% 245,000 245,000 0%
Mar-10 - 1 0
Apr-10 - - 0
May-10 1 0% 1 0% 1.00 1 1.00 56 97.8% 313,000 19.5% 313,000 19.5% 0%
Jun-10 - - 1
Jul-10 - 1 1
Aug-10 1 - 1 1.00 20 96.2% 250,000 250,000 0%
Sep-10 1 1 1.00 0 0.00 18 94.3% 245,000 245,000 0%
Oct-10 - - 0
Nov-10 - - 0
Dec-10 - - 0
2010 5 25% 6 0% 0.83 0 0.40 21 97.1% 250,000 4.8% 269,600 14.1% 0%
Jan-11 - - 0
Feb-11 - - 0
Mar-11 - - 0
Apr-11 - 2 2
May-11 - - 2
Jun-11 - - 2
Jul-11 - - 1
Aug-11 - 1 2
Sep-11 - - 1
Oct-11 - - 0
Nov-11 - 1 1
Dec-11 - 1 2
2011 - 5 -17% 1
Jan-12 - 2 4
Feb-12 - - 4
Mar-12 1 1 1.00 3 3.00 67 97.8% 313,000 313,000 0%
Apr-12 - - 2
May-12 1 3 0.33 3 3.00 15 97.6% 288,000 288,000 0%
Jun-12 1 5 0.20 3 3.00 19 93.5% 290,000 290,000 0%
Jul-12 3 - 1 0.33 32 97.8% 278,000 275,300 0%
Aug-12 3 1 0% 3.00 0 0.00 60 95.9% 251,000 252,000 33%
Sep-12 - - 0
Oct-12 - - 0
Nov-12 - - 0
Dec-12 - - 0
2012 9 12 140% 0.75 2 1.87 42 96.7% 288,000 274,767 11%
Jan-13 - - 0
Feb-13 - - 0
Mar-13 - - 0
Apr-13 - - 0
May-13 - 1 -67% 1
Jun-13 1 0% - 0 0.00 9 100.0% 229,000 -21.0% 229,000 -21.0% 0%
Jul-13 - - 0
Aug-13 - - 0
Sep-13 - 1 1
Oct-13 - - 1
Nov-13 - - 1
Dec-13 - - 0
2013 1 -89% 2 -83% 0.50 0 0.00 9 100.0% 229,000 -20.5% 229,000 -16.7% 0%
Jan-14 - - 0
Feb-14 - - 0
Mar-14 1 1 1.00 0 0.00 2 103.3% 345,900 345,900 0%
Apr-14 - 2 1
May-14 2 - 0 0.00 15 97.7% 320,500 320,500 0%
Jun-14 1 0% 1 1.00 0 0.00 12 103.5% 419,004 83.0% 419,004 83.0% 0%
Jul-14 - - 0
Aug-14 - 1 1
Sep-14 1 - 0 0.00 31 98.7% 380,000 380,000 0%
Oct-14 - - 0
Nov-14 - 1 1
Dec-14 - - 1
2014 5 400% 6 200% 0.83 0 0.00 15 100.3% 345,900 51.0% 357,181 56.0% 0%
SEMI DETACHED
ACADIA (215)
Sales Y/Y%
New
Listings
Y/Y%
S/NL
Ratio
Inventory
Months of
Supply
DOM SP/LP
Benchmark
Price
Y/Y% Median Price Y/Y% Average Price Y/Y% Index
Share of
Sales
Condo
Jan-15 1 1 1.00 1 1.00 17 97.4% 340,000 340,000 0%
Feb-15 1 - 0 0.00 89 94.7% 330,400 330,400 0%
Mar-15 - - 0
Apr-15 1 1 -50% 1.00 0 0.00 13 99.1% 376,600 376,600 0%
May-15 - 1 0
Jun-15 1 0% - 0 0.00 18 98.5% 271,000 -35.3% 271,000 -35.3% 0%
Jul-15 1 1 1.00 0 0.00 22 98.5% 322,000 322,000 0%
Aug-15 - 1 0% 1
Sep-15 2 100% 1 2.00 0 0.00 38 97.6% 348,750 -8.2% 348,750 -8.2% 0%
Oct-15 - 1 1
Nov-15 2 2 100% 1.00 1 0.50 24 96.7% 374,250 374,250 0%
Dec-15 - - 1
2015 9 80% 9 50% 1.00 0 0.21 31 97.4% 340,000 -1.7% 342,889 -4.0% 0%
Jan-16 - - 1
Feb-16 - - 1
Mar-16 - - 0
Apr-16 - 1 0% 1
May-16 - 1 0% 2
Jun-16 1 0% - 1 1.00 72 97.1% 267,000 -1.5% 267,000 -1.5% 0%
Jul-16 - - 0
Aug-16 - - 0
Sep-16 - - 0
Oct-16 - 1 0% 1
Nov-16 - 1 -50% 2
Dec-16 - 1 3
2016 1 -89% 5 -44% 0.20 1 1.00 72 97.1% 267,000 -21.5% 267,000 -22.1% 0%
Jan-17 1 1 1.00 2 2.00 88 96.0% 257,000 257,000 0%
Feb-17 - 1 1
Mar-17 2 3 0.67 1 0.50 15 101.3% 309,000 309,000 0%
Apr-17 - - 1
May-17 - 1 0% 1
Jun-17 1 0% 1 1.00 2 2.00 82 95.1% 303,500 13.7% 303,500 13.7% 0%
Jul-17 - - 1
Aug-17 1 - 0 0.00 95 98.6% 345,000 345,000 0%
Sep-17 - 2 2
Oct-17 1 - 1 1.00 19 87.2% 170,000 170,000 0%
Nov-17 1 - 0 0.00 53 96.8% 324,200 324,200 0%
Dec-17 - - 0
2017 7 600% 9 80% 0.78 1 0.92 52 97.2% 303,500 13.7% 288,243 8.0% 0%
Jan-18 - 1 0% 1
Feb-18 1 - 0 0.00 22 96.2% 375,000 375,000 0%
Mar-18 - 1 -67% 1
Apr-18 - - 1
May-18 - - 1
Jun-18 - - 1
Jul-18 - 1 1
Aug-18 2 100% 2 1.00 2 1.00 13 96.0% 263,500 -23.6% 263,500 -23.6% 0%
Sep-18 - - 1
Oct-18 2 100% - 0 0.00 140 96.6% 323,500 90.3% 323,500 90.3% 0%
Nov-18 - - 0
Dec-18 - - 0
2018 5 -29% 5 -44% 1.00 1 0.33 65 96.3% 322,000 6.1% 309,800 7.5% 0%
Jan-19 - 1 0% 0.00 1
Feb-19 1 0% - 0 0.00 26 96.9% 327,000 -12.8% 327,000 -12.8% 0%
Mar-19 - - 0
Apr-19 - - 0
May-19 - 1 0.00 1
Jun-19
Jul-19
Aug-19
Sep-19
Oct-19
Nov-19
Dec-19
2019 1 -80% 2 -60% 0.50 0 0.00 26 96.9% 327,000 1.6% 327,000 5.6% 0%
SEMI DETACHED
ACADIA (215)
-
1
2
3
4
MONTHS OF SUPPLY AND PRICE CHANGE
Months of Supply trend (12 M) Benchmark price y/y % Change
Source: CREB®
0
1
2
3
4
5
0%
20%
40%
60%
80%
100%
120%
140%
160%
SALES TO NEW LISTINGS RATIO AND INVENTORY
Inventory Sales to New listings ratio trend (12 M) Inventory Trend (12 M)
Source: CREB®
100,000
150,000
200,000
250,000
300,000
350,000
400,000
450,000
PRICE COMPARISON
Average Median Benchmark Source: CREB®
-
10
20
30
40
50
60
70
80
90
DAYS ON MARKET
Days on market trend (12 M)
Source: CREB®
0
0
0
1
1
1
1
0
1
2
3
May.
'18
Jun.
'18
Jul.
'18
Aug.
'18
Sep.
'18
Oct.
'18
Nov.
'18
Dec.
'18
Jan.
'19
Feb.
'19
Mar.
'19
Apr.
'19
May.
'19
INVENTORY, SALES AND PRICE
Inventory Sales Benchmark Price Source: CREB®
0
1
<$200,000 $200,000 -
$299,999
$300,000 -
$399,999
$400,000 -
$499,999
$500,000 -
$599,999
$600,000 -
$699,999
$700,000 -
999,999
$1,000,000+
MONTHS OF SUPPLY BY PRICE RANGE
May-16 May-17 May-18 May-19 Source: CREB®
May
SEMI DETACHED
ACADIA (215)
-
1
2
3
Jan. Feb. Mar. Apr. May Jun. Jul. Aug. Sept. Oct. Nov. Dec.
SEMI-DETACHED SALES COMPARISON
2019 2018 2017 2016
Source: CREB®
0
1
1
2
2
3
<$200,000 $200,000 -
$299,999
$300,000 -
$399,999
$400,000 -
$499,999
$500,000 -
$599,999
$600,000 -
$699,999
$700,000 -
999,999
$1,000,000+
YTD SALES BY PRICE RANGE
YTD-2016 YTD-2017 YTD-2018 YTD-2019
Source: CREB®
YTD-MAY
0
1
1
2
2
3
3
4
<$200,000 $200,000 -
$299,999
$300,000 -
$399,999
$400,000 -
$499,999
$500,000 -
$599,999
$600,000 -
$699,999
$700,000 -
999,999
$1,000,000+
YTD NEW LISTINGS BY PRICE RANGE
YTD-2016 YTD-2017 YTD-2018 YTD-2019
Source: CREB®
YTD-MAY
0
1
2
<$200,000 $200,000 -
$299,999
$300,000 -
$399,999
$400,000 -
$499,999
$500,000 -
$599,999
$600,000 -
$699,999
$700,000 -
999,999
$1,000,000+
INVENTORY BY PRICE RANGE
May-16 May-17 May-18 May-19
Source: CREB®
May
-
1
2
3
4
Jan. Feb. Mar. Apr. May Jun. Jul. Aug. Sept. Oct. Nov. Dec.
SEMI-DETACHED NEW LISTINGS COMPARISON
2019 2018 2017 2016 Source: CREB®
-
1
2
3
4
Jan. Feb. Mar. Apr. May Jun. Jul. Aug. Sept. Oct. Nov. Dec.
SEMI-DETACHED INVENTORY COMPARISON
2019 2018 2017 2016 Source: CREB®
ROW
ACADIA (215)
Sales Y/Y%
New
Listings
Y/Y%
S/NL
Ratio
Inventory
Months of
Supply
DOM SP/LP
Benchmark
Price
Y/Y% Median Price Y/Y% Average Price Y/Y% Index
Share of
Sales
Condo
Jan-10 1 -50% 2 100% 0.50 5 5.00 16 97.9% 222,200 -4.1% 230,000 5.3% 230,000 5.3% 178 100%
Feb-10 2 0% 1 -50% 2.00 3 1.50 67 96.1% 221,300 -2.3% 240,175 10.2% 240,175 10.2% 177 100%
Mar-10 1 0% 3 50% 0.33 4 4.00 149 95.5% 217,000 -2.4% 210,000 -2.8% 210,000 -2.8% 174 100%
Apr-10 2 -33% - 3 1.50 36 96.2% 228,800 4.0% 259,250 23.5% 259,250 18.3% 183 100%
May-10 1 -50% 2 0% 0.50 2 2.00 14 97.4% 227,600 5.0% 265,000 19.9% 265,000 19.9% 182 100%
Jun-10 1 -50% 5 67% 0.20 4 4.00 23 96.0% 231,300 6.6% 225,500 6.2% 225,500 6.2% 185 100%
Jul-10 - 4 33% 7 233,200 7.5% 186
Aug-10 2 0% 4 300% 0.50 6 3.00 13 99.6% 229,700 5.9% 225,250 -7.3% 225,250 -7.3% 184 100%
Sep-10 1 0% 1 -67% 1.00 6 6.00 11 96.0% 227,800 4.1% 235,000 0.0% 235,000 0.0% 182 100%
Oct-10 2 100% 4 100% 0.50 5 2.50 32 97.9% 229,100 3.1% 221,750 2.0% 221,750 2.0% 183 100%
Nov-10 1 -50% 2 -33% 0.50 5 5.00 18 96.3% 228,300 2.2% 255,000 7.1% 255,000 7.1% 183 100%
Dec-10 1 0% 1 0% 1.00 3 3.00 7 98.1% 233,300 3.3% 279,500 37.7% 279,500 37.7% 187 100%
2010 15 -29% 29 16% 0.52 4 3.41 35 97.1% 227,467 2.7% 230,000 5.7% 239,523 6.1% 182 100%
Jan-11 - 1 -50% 2 233,800 5.2% 187
Feb-11 2 0% - 1 0.50 50 96.8% 225,400 1.9% 295,000 22.8% 295,000 22.8% 180 100%
Mar-11 - - 1 224,300 3.4% 179
Apr-11 - 1 1 223,400 -2.4% 179
May-11 1 0% 1 -50% 1.00 1 1.00 41 95.5% 220,300 -3.2% 209,000 -21.1% 209,000 -21.1% 176 100%
Jun-11 - 2 -60% 2 220,100 -4.8% 176
Jul-11 2 3 -25% 0.67 3 1.50 33 96.3% 222,800 -4.5% 262,350 262,350 178 100%
Aug-11 - 2 -50% 5 221,200 -3.7% 177
Sep-11 1 0% 2 100% 0.50 6 6.00 19 96.3% 219,400 -3.7% 250,000 6.4% 250,000 6.4% 175 100%
Oct-11 1 -50% 1 -75% 1.00 5 5.00 27 97.3% 221,100 -3.5% 213,000 -3.9% 213,000 -3.9% 177 100%
Nov-11 - 2 0% 5 222,100 -2.7% 178
Dec-11 1 0% 1 0% 1.00 4 4.00 31 99.1% 220,800 -5.4% 267,500 -4.3% 267,500 -4.3% 177 100%
2011 8 -47% 16 -45% 0.50 3 3.00 35 96.8% 222,892 -2.0% 261,150 13.5% 256,775 7.2% 178 100%
Jan-12 - 1 0% 3 216,700 -7.3% 173
Feb-12 - 2 4 216,900 -3.8% 173
Mar-12 3 4 0.75 4 1.33 22 97.0% 212,800 -5.1% 279,000 249,833 170 100%
Apr-12 1 2 100% 0.50 1 1.00 31 98.0% 215,900 -3.4% 240,000 240,000 173 100%
May-12 3 200% 4 300% 0.75 4 1.33 37 97.8% 219,600 -0.3% 235,000 12.4% 227,667 8.9% 176 100%
Jun-12 1 - 4 4.00 13 96.6% 219,400 -0.3% 280,000 280,000 175 100%
Jul-12 1 -50% 3 0% 0.33 4 4.00 77 97.5% 223,600 0.4% 258,000 -1.7% 258,000 -1.7% 179 100%
Aug-12 2 2 0% 1.00 4 2.00 64 97.9% 221,700 0.2% 211,500 211,500 177 100%
Sep-12 3 200% 1 -50% 3.00 2 0.67 30 97.5% 220,800 0.6% 213,000 -14.8% 239,833 -4.1% 177 100%
Oct-12 - 2 100% 3 221,400 0.1% 177
Nov-12 3 - 0 0.00 82 95.5% 219,400 -1.2% 226,500 228,950 175 100%
Dec-12 - 1 0% 1 218,300 -1.1% 175
2012 17 113% 22 38% 0.77 3 1.79 45 97.1% 218,875 -1.8% 235,000 -10.0% 237,638 -7.5% 175 100%
Jan-13 - 4 300% 5 222,600 2.7% 178
Feb-13 3 4 100% 0.75 4 1.33 26 96.5% 220,300 1.6% 234,900 216,650 176 100%
Mar-13 2 -33% - 3 1.50 28 97.2% 223,900 5.2% 220,000 -21.1% 220,000 -11.9% 179 100%
Apr-13 - 1 -50% 2 227,200 5.2% 182
May-13 - 2 -50% 4 227,400 3.6% 182
Jun-13 2 100% 4 0.50 6 3.00 29 96.5% 231,300 5.4% 221,750 -20.8% 221,750 -20.8% 185 100%
Jul-13 6 500% 2 -33% 3.00 0 0.00 38 96.8% 230,200 3.0% 235,500 -8.7% 231,500 -10.3% 184 100%
Aug-13 2 0% 3 50% 0.67 1 0.50 107 97.2% 235,900 6.4% 215,760 2.0% 215,760 2.0% 189 100%
Sep-13 3 0% 3 200% 1.00 2 0.67 30 97.2% 238,600 8.1% 228,000 7.0% 250,667 4.5% 191 100%
Oct-13 2 2 0% 1.00 2 1.00 12 98.3% 234,600 6.0% 280,000 280,000 188 100%
Nov-13 1 -67% - 1 1.00 37 98.4% 235,400 7.3% 221,000 -2.4% 221,000 -3.5% 188 100%
Dec-13 - 2 100% 2 240,600 10.2% 192
2013 21 24% 27 23% 0.78 3 1.13 37 97.1% 230,667 5.4% 225,000 -4.3% 232,713 -2.1% 184 100%
Jan-14 1 - 1 1.00 30 95.0% 239,100 7.4% 210,000 210,000 191 100%
Feb-14 - 2 -50% 2 240,800 9.3% 193
Mar-14 2 0% 1 2.00 2 1.00 37 96.1% 245,100 9.5% 273,500 24.3% 273,500 24.3% 196 100%
Apr-14 2 2 100% 1.00 2 1.00 19 99.0% 251,500 10.7% 245,950 245,950 201 100%
May-14 2 6 200% 0.33 5 2.50 78 99.6% 256,500 12.8% 303,000 303,000 205 100%
Jun-14 6 200% 4 0% 1.50 2 0.33 20 98.2% 257,700 11.4% 255,250 15.1% 273,583 23.4% 206 100%
Jul-14 1 -83% 2 0% 0.50 4 4.00 38 97.0% 256,700 11.5% 318,000 35.0% 318,000 37.4% 205 100%
Aug-14 1 -50% 4 33% 0.25 5 5.00 35 100.0% 260,600 10.5% 225,000 4.3% 225,000 4.3% 208 100%
Sep-14 5 67% 4 33% 1.25 3 0.60 28 97.8% 259,000 8.5% 256,000 12.3% 280,060 11.7% 207 100%
Oct-14 2 0% 5 150% 0.40 5 2.50 35 96.2% 256,300 9.2% 286,000 2.1% 286,000 2.1% 205 100%
Nov-14 4 300% 5 0.80 6 1.50 32 97.5% 257,700 9.5% 249,250 12.8% 258,250 16.9% 206 100%
Dec-14 4 2 0% 2.00 4 1.00 39 96.9% 258,500 7.4% 235,750 254,750 207 100%
2014 30 43% 37 37% 0.81 3 1.86 33 97.6% 253,292 9.8% 255,000 13.3% 268,790 15.5% 202 100%
ROW
ACADIA (215)
Sales Y/Y%
New
Listings
Y/Y%
S/NL
Ratio
Inventory
Months of
Supply
DOM SP/LP
Benchmark
Price
Y/Y% Median Price Y/Y% Average Price Y/Y% Index
Share of
Sales
Condo
Jan-15 - 3 3 253,700 6.1% 203
Feb-15 2 3 50% 0.67 5 2.50 39 96.7% 256,200 6.4% 285,250 285,250 205 100%
Mar-15 2 0% 2 100% 1.00 5 2.50 14 97.7% 255,100 4.1% 300,500 9.9% 300,500 9.9% 204 100%
Apr-15 - 5 150% 10 256,500 2.0% 205
May-15 2 0% 1 -83% 2.00 6 3.00 20 98.5% 256,000 -0.2% 258,500 -14.7% 258,500 -14.7% 205 100%
Jun-15 - 3 -25% 7 251,800 -2.3% 201
Jul-15 1 0% 4 100% 0.25 7 7.00 89 100.0% 247,700 -3.5% 282,500 -11.2% 282,500 -11.2% 198 100%
Aug-15 4 300% 4 0% 1.00 6 1.50 55 96.8% 255,300 -2.0% 280,000 24.4% 286,000 27.1% 204 100%
Sep-15 4 -20% 2 -50% 2.00 4 1.00 39 96.6% 257,500 -0.6% 307,500 20.1% 296,250 5.8% 206 100%
Oct-15 2 0% 4 -20% 0.50 5 2.50 16 98.5% 256,800 0.2% 285,500 -0.2% 285,500 -0.2% 205 100%
Nov-15 2 -50% 2 -60% 1.00 4 2.00 57 97.2% 254,300 -1.3% 257,500 3.3% 257,500 -0.3% 203 100%
Dec-15 2 -50% 2 0% 1.00 4 2.00 44 95.1% 255,600 -1.1% 275,000 16.6% 275,000 7.9% 204 100%
2015 21 -30% 35 -5% 0.60 6 2.67 40 97.2% 254,708 0.6% 280,000 9.8% 282,667 5.2% 204 100%
Jan-16 - 2 -33% 5 247,400 -2.5% 198
Feb-16 1 -50% 2 -33% 0.50 4 4.00 100 97.9% 250,800 -2.1% 311,000 9.0% 311,000 9.0% 201 100%
Mar-16 - 1 -50% 4 243,800 -4.4% 195
Apr-16 - 3 -40% 6 238,900 -6.9% 191
May-16 1 -50% 2 100% 0.50 6 6.00 39 98.5% 242,200 -5.4% 226,000 -12.6% 226,000 -12.6% 194 100%
Jun-16 3 3 0% 1.00 2 0.67 33 96.6% 235,200 -6.6% 290,000 275,000 188 100%
Jul-16 - - 2 232,400 -6.2% 186
Aug-16 - 2 -50% 4 231,800 -9.2% 185
Sep-16 1 -75% 2 0% 0.50 5 5.00 31 95.3% 237,300 -7.8% 243,000 -21.0% 243,000 -18.0% 190 100%
Oct-16 1 -50% 3 -25% 0.33 5 5.00 45 95.3% 232,600 -9.4% 219,000 -23.3% 219,000 -23.3% 186 100%
Nov-16 1 -50% 4 100% 0.25 7 7.00 23 96.4% 226,800 -10.8% 265,000 2.9% 265,000 2.9% 181 100%
Dec-16 2 0% 1 -50% 2.00 3 1.50 92 95.8% 225,800 -11.7% 234,500 -14.7% 234,500 -14.7% 181 100%
2016 10 -52% 25 -29% 0.40 4 4.17 52 96.5% 237,083 -6.9% 241,000 -13.9% 255,800 -9.5% 190 100%
Jan-17 1 5 150% 0.20 5 5.00 71 91.5% 224,200 -9.4% 215,000 215,000 179 100%
Feb-17 1 0% 2 0% 0.50 7 7.00 15 96.7% 227,700 -9.2% 203,000 -34.7% 203,000 -34.7% 182 100%
Mar-17 1 2 100% 0.50 6 6.00 56 96.9% 222,400 -8.8% 310,000 310,000 178 100%
Apr-17 2 1 -67% 2.00 6 3.00 71 97.3% 219,900 -8.0% 232,750 232,750 176 100%
May-17 2 100% 2 0% 1.00 4 2.00 35 98.3% 225,400 -6.9% 266,750 18.0% 266,750 18.0% 180 100%
Jun-17 1 -67% 3 0% 0.33 6 6.00 65 97.5% 221,700 -5.7% 228,000 -21.4% 228,000 -17.1% 177 100%
Jul-17 - 3 6 226,300 -2.6% 181
Aug-17 2 3 50% 0.67 7 3.50 25 94.3% 231,400 -0.2% 238,000 238,000 185 100%
Sep-17 - 1 -50% 6 231,300 -2.5% 185
Oct-17 1 0% - 3 3.00 66 86.1% 222,200 -4.5% 206,500 -5.7% 206,500 -5.7% 178 100%
Nov-17 2 100% 2 -50% 1.00 3 1.50 77 94.6% 221,100 -2.5% 234,000 -11.7% 234,000 -11.7% 177 100%
Dec-17 - 1 0% 3 219,100 -3.0% 175
2017 13 30% 25 0% 0.52 5 4.11 53 95.3% 224,392 -5.4% 228,000 -5.4% 238,885 -6.6% 179 100%
Jan-18 - - 3 211,000 -5.9% 169
Feb-18 2 100% 1 -50% 2.00 1 0.50 46 89.2% 217,500 -4.5% 177,500 -12.6% 177,500 -12.6% 174 100%
Mar-18 1 0% 2 0% 0.50 3 3.00 117 94.3% 214,900 -3.4% 207,500 -33.1% 207,500 -33.1% 172 100%
Apr-18 1 -50% 2 100% 0.50 4 4.00 14 96.4% 213,900 -2.7% 212,000 -8.9% 212,000 -8.9% 171 100%
May-18 3 50% 5 150% 0.60 5 1.67 28 97.4% 216,500 -3.9% 240,000 -10.0% 235,333 -11.8% 173 100%
Jun-18 1 0% 1 -67% 1.00 4 4.00 44 95.9% 209,500 -5.5% 210,000 -7.9% 210,000 -7.9% 168 100%
Jul-18 3 5 67% 0.60 6 2.00 49 98.6% 208,200 -8.0% 191,000 220,000 166 100%
Aug-18 3 50% 1 -67% 3.00 4 1.33 32 95.3% 209,900 -9.3% 235,000 -1.3% 246,667 3.6% 168 100%
Sep-18 2 1 0% 2.00 3 1.50 117 94.9% 212,900 -8.0% 218,250 218,250 170 100%
Oct-18 1 0% 1 1.00 3 3.00 132 90.1% 210,300 -5.4% 252,000 22.0% 252,000 22.0% 168 100%
Nov-18 1 -50% 2 0% 0.50 4 4.00 97 95.1% 210,400 -4.8% 228,000 -2.6% 228,000 -2.6% 168 100%
Dec-18 1 - 2 2.00 34 100.0% 213,200 -2.7% 209,900 209,900 170 100%
2018 19 46% 21 -16% 0.90 4 2.45 57 95.5% 212,350 -5.4% 212,000 -7.0% 221,942 -7.1% 170 100%
Jan-19 - 2 0.00 4 204,400 -3.1% 163
Feb-19 2 0% 1 0% 2.00 2 1.00 55 94.8% 210,300 -3.3% 227,500 28.2% 227,500 28.2% 168 100%
Mar-19 2 100% 3 50% 0.67 3 1.50 39 97.2% 206,300 -4.0% 228,000 9.9% 228,000 9.9% 165 100%
Apr-19 2 100% 1 -50% 2.00 2 1.00 32 97.4% 208,000 -2.8% 235,750 11.2% 235,750 11.2% 166 100%
May-19 1 -67% 2 -60% 0.50 2 2.00 47 94.3% 213,500 -1.4% 245,000 2.1% 245,000 4.1% 171 100%
Jun-19
Jul-19
Aug-19
Sep-19
Oct-19
Nov-19
Dec-19
2019 7 -63% 9 -57% 0.78 3 1.38 42 96.2% 208,500 -1.8% 230,000 8.5% 232,500 4.8% 167 100%
ROW
ACADIA (215)
-20%
-15%
-10%
-5%
0%
5%
10%
15%
-
1
2
3
4
5
6
MONTHS OF SUPPLY AND PRICE CHANGE
Months of Supply trend (12 M) Benchmark price y/y % Change
Source: CREB®
0
2
4
6
8
10
12
0%
20%
40%
60%
80%
100%
120%
140%
SALES TO NEW LISTINGS RATIO AND INVENTORY
Inventory Sales to New listings ratio trend (12 M) Inventory Trend (12 M)
Source: CREB®
100,000
150,000
200,000
250,000
300,000
350,000
PRICE COMPARISON
Average Median Benchmark Source: CREB®
-
10
20
30
40
50
60
70
80
DAYS ON MARKET
Days on market trend (12 M)
Source: CREB®
198,000
200,000
202,000
204,000
206,000
208,000
210,000
212,000
214,000
216,000
218,000
0
1
2
3
4
5
6
7
May.
'18
Jun.
'18
Jul.
'18
Aug.
'18
Sep.
'18
Oct.
'18
Nov.
'18
Dec.
'18
Jan.
'19
Feb.
'19
Mar.
'19
Apr.
'19
May.
'19
INVENTORY, SALES AND PRICE
Inventory Sales Benchmark Price Source: CREB®
0
1
2
3
4
5
6
<$200,000 $200,000 -
$299,999
$300,000 -
$399,999
$400,000 -
$499,999
$500,000 -
$599,999
$600,000 -
$699,999
$700,000 -
999,999
$1,000,000+
MONTHS OF SUPPLY BY PRICE RANGE
May-16 May-17 May-18 May-19 Source: CREB®
May
ROW
ACADIA (215)
-
1
2
3
4
Jan. Feb. Mar. Apr. May Jun. Jul. Aug. Sept. Oct. Nov. Dec.
ROW SALES COMPARISON
2019 2018 2017 2016
Source: CREB®
0
1
2
3
4
5
6
7
<$200,000 $200,000 -
$299,999
$300,000 -
$399,999
$400,000 -
$499,999
$500,000 -
$599,999
$600,000 -
$699,999
$700,000 -
999,999
$1,000,000+
YTD SALES BY PRICE RANGE
YTD-2016 YTD-2017 YTD-2018 YTD-2019
Source: CREB®
YTD-MAY
0
1
2
3
4
5
6
7
8
9
10
<$200,000 $200,000 -
$299,999
$300,000 -
$399,999
$400,000 -
$499,999
$500,000 -
$599,999
$600,000 -
$699,999
$700,000 -
999,999
$1,000,000+
YTD NEW LISTINGS BY PRICE RANGE
YTD-2016 YTD-2017 YTD-2018 YTD-2019
Source: CREB®
YTD-MAY
0
1
2
3
4
5
6
<$200,000 $200,000 -
$299,999
$300,000 -
$399,999
$400,000 -
$499,999
$500,000 -
$599,999
$600,000 -
$699,999
$700,000 -
999,999
$1,000,000+
INVENTORY BY PRICE RANGE
May-16 May-17 May-18 May-19
Source: CREB®
May
-
1
2
3
4
5
6
Jan. Feb. Mar. Apr. May Jun. Jul. Aug. Sept. Oct. Nov. Dec.
ROW NEW LISTINGS COMPARISON
2019 2018 2017 2016 Source: CREB®
-
1
2
3
4
5
6
7
8
Jan. Feb. Mar. Apr. May Jun. Jul. Aug. Sept. Oct. Nov. Dec.
ROW INVENTORY COMPARISON
2019 2018 2017 2016 Source: CREB®
BENCHMARK PROPERTIES
ACADIA (215)
Detached Attached
One
Storey
Two Storey Total
Semi-
Detached
Row Total
Gross Living Area (Above Ground) 1153 1259 1166 Gross Living Area (Above Ground) - 1045 1045
Lot Size 5500 5604 5500 Lot Size - 0 -
Above Ground Bedrooms 3 3 3 Above Ground Bedrooms - 3 3
Year Built 1962 1961 1962 Year Built - 1970 1970
Below Ground Bedrooms 1 0 1 Below Ground Bedrooms - 0 0
Full Bathrooms 2 2 2 Full Bathrooms - 1 1
Half Bathrooms 0 1 0 Half Bathrooms - 0 0
Finished Basement - - - Finished Basement - - -
MAY 2019 Benchmark Price 428,300 447,000 432,000 MAY 2019 Benchmark Price 213,500 213,500
MAY 2019 Index value 179 210 183 MAY 2019 Index value 171 171
Share of detached 86% 14% 100% Share of attached - 100% 100%
Share of total residential 56% 9% 65% Share of total residential - 13% 13%
Apartment Total Residential
Total Total
Gross Living Area (Above Ground) 907 Gross Living Area (Above Ground) 1114
Above Ground Bedrooms 2 Lot Size -
Year Built 1978 Above Ground Bedrooms 3
Covered Parking Spaces 1 Year Built 1965
Full Bathrooms 1 Below Ground Bedrooms 0
Half Bathrooms 0 Full Bathrooms 1
MAY 2019 Benchmark Price 177,200 Half Bathrooms 0
MAY 2019 Index value 165 MAY 2019 Benchmark Price 335,800
Share of apartment to total residential 19% MAY 2019 Index value 178
Finished Basement -
DEFINITIONS
Detached -A unit that is not attached to any other unit
Attached - A unit that is attached to another unit by at least one common wall
Apartment - An attached unit that has connecting enclosed hallways
Total Residential - Includes detached, attached and apartment style properties
Exclusions - Data does not include activity related to rental, land or leased properties
Months of Supply - Active Listings (Inventory) / sales
Average DOM - Average Days on Market for Sold properties
Y/Y% - Year over year percentage change
S/NL Ratio - Total number of sales / Total number of new listings
SP/LP Ratio - Total dollar volume of sales / Total dollar volume of new listings
Benchmark Price
MLS® Home Price Index
at a point in time with price levels in a base (reference) period.
100,000
150,000
200,000
250,000
300,000
350,000
400,000
450,000
500,000
550,000
BENCHMARK PRICE COMPARISON
Detached One Storey Detached Two Storey Detached Apartment Semi Row Source: CREB®

Weitere ähnliche Inhalte

Ähnlich wie 2019 05 Monthly Home Sales Stats for ACADIA, Calgary

Corporate Venture Capital Group Investment Analysis 1995 to Q2 2008
Corporate Venture Capital Group Investment Analysis 1995 to Q2 2008Corporate Venture Capital Group Investment Analysis 1995 to Q2 2008
Corporate Venture Capital Group Investment Analysis 1995 to Q2 2008
mensa25
 
Table 17 rate of growth (% yoy) gdp and its component at current prices
Table 17 rate of growth (% yoy) gdp and its component at current pricesTable 17 rate of growth (% yoy) gdp and its component at current prices
Table 17 rate of growth (% yoy) gdp and its component at current prices
Padma Natarajan
 
富邦投顧研究部核心持股2011年殖利率 02.17.2012
富邦投顧研究部核心持股2011年殖利率 02.17.2012富邦投顧研究部核心持股2011年殖利率 02.17.2012
富邦投顧研究部核心持股2011年殖利率 02.17.2012
yo9889
 
PPF_7800_underlying_data
PPF_7800_underlying_dataPPF_7800_underlying_data
PPF_7800_underlying_data
Karan Dewan
 
SPX (1990-2012) - Long Straddle, Strangle & Deep OTM
SPX (1990-2012) - Long Straddle, Strangle & Deep OTMSPX (1990-2012) - Long Straddle, Strangle & Deep OTM
SPX (1990-2012) - Long Straddle, Strangle & Deep OTM
Stefan Bolta
 

Ähnlich wie 2019 05 Monthly Home Sales Stats for ACADIA, Calgary (20)

September 2015 - Market Snapshot - General Overvew
September 2015 - Market Snapshot - General OvervewSeptember 2015 - Market Snapshot - General Overvew
September 2015 - Market Snapshot - General Overvew
 
August 2015 - Market snapshot - General Overview
August 2015 - Market snapshot - General OverviewAugust 2015 - Market snapshot - General Overview
August 2015 - Market snapshot - General Overview
 
2016 Facebook Advertising Dashboard Template
2016 Facebook Advertising Dashboard Template2016 Facebook Advertising Dashboard Template
2016 Facebook Advertising Dashboard Template
 
KENYA AIRWAYS STOCK ANALYSIS- LUDENYO CIFA
KENYA AIRWAYS STOCK ANALYSIS- LUDENYO CIFAKENYA AIRWAYS STOCK ANALYSIS- LUDENYO CIFA
KENYA AIRWAYS STOCK ANALYSIS- LUDENYO CIFA
 
June 2015 - General Overview
June 2015 - General Overview June 2015 - General Overview
June 2015 - General Overview
 
Problem 1 (50 points) All Financial Data should only be obtained from.pdf
Problem 1 (50 points) All Financial Data should only be obtained from.pdfProblem 1 (50 points) All Financial Data should only be obtained from.pdf
Problem 1 (50 points) All Financial Data should only be obtained from.pdf
 
EmployeeGoalSetting
EmployeeGoalSettingEmployeeGoalSetting
EmployeeGoalSetting
 
August 2018 Real Estate Update for The Woodlands, Texas
August 2018 Real Estate Update for The Woodlands, TexasAugust 2018 Real Estate Update for The Woodlands, Texas
August 2018 Real Estate Update for The Woodlands, Texas
 
July 2015 - Market Snapshot - General Overview
July 2015  - Market Snapshot - General OverviewJuly 2015  - Market Snapshot - General Overview
July 2015 - Market Snapshot - General Overview
 
Kedia april commodity seasonality report
Kedia april commodity seasonality reportKedia april commodity seasonality report
Kedia april commodity seasonality report
 
Reporte mensual de operaciones de Servicio
Reporte mensual de operaciones de Servicio Reporte mensual de operaciones de Servicio
Reporte mensual de operaciones de Servicio
 
Corporate Venture Capital Group Investment Analysis 1995 to Q2 2008
Corporate Venture Capital Group Investment Analysis 1995 to Q2 2008Corporate Venture Capital Group Investment Analysis 1995 to Q2 2008
Corporate Venture Capital Group Investment Analysis 1995 to Q2 2008
 
107年指考各科成績累計
107年指考各科成績累計107年指考各科成績累計
107年指考各科成績累計
 
Tablas propoleos
Tablas propoleosTablas propoleos
Tablas propoleos
 
November 2016 Real Estate Market Report, The Woodlands, TX
November 2016 Real Estate Market Report, The Woodlands, TXNovember 2016 Real Estate Market Report, The Woodlands, TX
November 2016 Real Estate Market Report, The Woodlands, TX
 
Table 17 rate of growth (% yoy) gdp and its component at current prices
Table 17 rate of growth (% yoy) gdp and its component at current pricesTable 17 rate of growth (% yoy) gdp and its component at current prices
Table 17 rate of growth (% yoy) gdp and its component at current prices
 
May 2015 - Market Snapshot - General Overview
May 2015 - Market Snapshot - General OverviewMay 2015 - Market Snapshot - General Overview
May 2015 - Market Snapshot - General Overview
 
富邦投顧研究部核心持股2011年殖利率 02.17.2012
富邦投顧研究部核心持股2011年殖利率 02.17.2012富邦投顧研究部核心持股2011年殖利率 02.17.2012
富邦投顧研究部核心持股2011年殖利率 02.17.2012
 
PPF_7800_underlying_data
PPF_7800_underlying_dataPPF_7800_underlying_data
PPF_7800_underlying_data
 
SPX (1990-2012) - Long Straddle, Strangle & Deep OTM
SPX (1990-2012) - Long Straddle, Strangle & Deep OTMSPX (1990-2012) - Long Straddle, Strangle & Deep OTM
SPX (1990-2012) - Long Straddle, Strangle & Deep OTM
 

Mehr von Jerry Charlton

2021 April Calgary Home Sales Stats
2021 April Calgary Home Sales Stats2021 April Calgary Home Sales Stats
2021 April Calgary Home Sales Stats
Jerry Charlton
 

Mehr von Jerry Charlton (14)

2021 April Calgary Home Sales Stats
2021 April Calgary Home Sales Stats2021 April Calgary Home Sales Stats
2021 April Calgary Home Sales Stats
 
Calgary Home Sales Apr 2020
Calgary Home Sales Apr 2020Calgary Home Sales Apr 2020
Calgary Home Sales Apr 2020
 
2020 Feb Calgary Market Stats
2020 Feb Calgary Market Stats2020 Feb Calgary Market Stats
2020 Feb Calgary Market Stats
 
Huntington Hills Detached Home Sales Report - 1-31-2020
Huntington Hills Detached Home Sales Report - 1-31-2020Huntington Hills Detached Home Sales Report - 1-31-2020
Huntington Hills Detached Home Sales Report - 1-31-2020
 
Calgary Home Sales Stats 2019 November - Buyers in Control
Calgary Home Sales Stats 2019 November - Buyers in ControlCalgary Home Sales Stats 2019 November - Buyers in Control
Calgary Home Sales Stats 2019 November - Buyers in Control
 
2019 July Calgary Monthly Home Sales Report from CREB
2019 July Calgary Monthly Home Sales Report from CREB2019 July Calgary Monthly Home Sales Report from CREB
2019 July Calgary Monthly Home Sales Report from CREB
 
June 2019 and YTD Calgary Home Sale Stats from Calgary Real Estate Board and ...
June 2019 and YTD Calgary Home Sale Stats from Calgary Real Estate Board and ...June 2019 and YTD Calgary Home Sale Stats from Calgary Real Estate Board and ...
June 2019 and YTD Calgary Home Sale Stats from Calgary Real Estate Board and ...
 
Acadia, Calgary flips - Before and After
Acadia, Calgary flips - Before and AfterAcadia, Calgary flips - Before and After
Acadia, Calgary flips - Before and After
 
Southwood flips - Before and After with Pics and Prices
Southwood flips - Before and After with Pics and PricesSouthwood flips - Before and After with Pics and Prices
Southwood flips - Before and After with Pics and Prices
 
Buying Foreclosures in Alberta
Buying Foreclosures in AlbertaBuying Foreclosures in Alberta
Buying Foreclosures in Alberta
 
CMHC Calgary Condo Buyers Guide
CMHC Calgary Condo Buyers GuideCMHC Calgary Condo Buyers Guide
CMHC Calgary Condo Buyers Guide
 
Buying and Owning A Condo in Alberta
Buying and Owning A Condo in AlbertaBuying and Owning A Condo in Alberta
Buying and Owning A Condo in Alberta
 
CMHC Home Buyers Guide
CMHC Home Buyers GuideCMHC Home Buyers Guide
CMHC Home Buyers Guide
 
Calgary Real Property Reports (Survey)
Calgary Real Property Reports (Survey)Calgary Real Property Reports (Survey)
Calgary Real Property Reports (Survey)
 

Kürzlich hochgeladen

9990771857 Call Girls in Dwarka Sector 6 Delhi (Call Girls) Delhi
9990771857 Call Girls in Dwarka Sector 6 Delhi (Call Girls) Delhi9990771857 Call Girls in Dwarka Sector 6 Delhi (Call Girls) Delhi
9990771857 Call Girls in Dwarka Sector 6 Delhi (Call Girls) Delhi
delhimodel235
 
9990771857 Call Girls in Dwarka Sector 1 Delhi (Call Girls) Delhi
9990771857 Call Girls in Dwarka Sector 1 Delhi (Call Girls) Delhi9990771857 Call Girls in Dwarka Sector 1 Delhi (Call Girls) Delhi
9990771857 Call Girls in Dwarka Sector 1 Delhi (Call Girls) Delhi
delhimodel235
 
9990771857 Call Girls Dwarka Sector 9 Delhi (Call Girls ) Delhi
9990771857 Call Girls Dwarka Sector 9 Delhi (Call Girls ) Delhi9990771857 Call Girls Dwarka Sector 9 Delhi (Call Girls ) Delhi
9990771857 Call Girls Dwarka Sector 9 Delhi (Call Girls ) Delhi
delhimodel235
 
9990771857 Call Girls in Dwarka Sector 7 Delhi (Call Girls) Delhi
9990771857 Call Girls in Dwarka Sector 7 Delhi (Call Girls) Delhi9990771857 Call Girls in Dwarka Sector 7 Delhi (Call Girls) Delhi
9990771857 Call Girls in Dwarka Sector 7 Delhi (Call Girls) Delhi
delhimodel235
 
Call Girls In Laxmi Nagar Delhi +91-8447779280! !Best Woman Seeking Man Escor...
Call Girls In Laxmi Nagar Delhi +91-8447779280! !Best Woman Seeking Man Escor...Call Girls In Laxmi Nagar Delhi +91-8447779280! !Best Woman Seeking Man Escor...
Call Girls In Laxmi Nagar Delhi +91-8447779280! !Best Woman Seeking Man Escor...
asmaqueen5
 
9990771857 Call Girls in Dwarka Sector 137 Noida (Call Girls) Delhi
9990771857 Call Girls in Dwarka Sector 137 Noida (Call Girls) Delhi9990771857 Call Girls in Dwarka Sector 137 Noida (Call Girls) Delhi
9990771857 Call Girls in Dwarka Sector 137 Noida (Call Girls) Delhi
delhimodel235
 
Call Girls In Vasant Vihar Delhi 💯Call Us 🔝8264348440🔝
Call Girls In Vasant Vihar Delhi 💯Call Us 🔝8264348440🔝Call Girls In Vasant Vihar Delhi 💯Call Us 🔝8264348440🔝
Call Girls In Vasant Vihar Delhi 💯Call Us 🔝8264348440🔝
soniya singh
 
9990771857 Call Girls in Dwarka Sector 2 Delhi (Call Girls) Delhi
9990771857 Call Girls in Dwarka Sector 2 Delhi (Call Girls) Delhi9990771857 Call Girls in Dwarka Sector 2 Delhi (Call Girls) Delhi
9990771857 Call Girls in Dwarka Sector 2 Delhi (Call Girls) Delhi
delhimodel235
 

Kürzlich hochgeladen (20)

Properties for Sale in Istanbul with Schools and Parks | Antalya Development
Properties for Sale in Istanbul with Schools and Parks | Antalya DevelopmentProperties for Sale in Istanbul with Schools and Parks | Antalya Development
Properties for Sale in Istanbul with Schools and Parks | Antalya Development
 
9990771857 Call Girls in Dwarka Sector 6 Delhi (Call Girls) Delhi
9990771857 Call Girls in Dwarka Sector 6 Delhi (Call Girls) Delhi9990771857 Call Girls in Dwarka Sector 6 Delhi (Call Girls) Delhi
9990771857 Call Girls in Dwarka Sector 6 Delhi (Call Girls) Delhi
 
2k Shots ≽ 9205541914 ≼ Call Girls In Sainik Farm (Delhi)
2k Shots ≽ 9205541914 ≼ Call Girls In Sainik Farm (Delhi)2k Shots ≽ 9205541914 ≼ Call Girls In Sainik Farm (Delhi)
2k Shots ≽ 9205541914 ≼ Call Girls In Sainik Farm (Delhi)
 
9990771857 Call Girls in Dwarka Sector 1 Delhi (Call Girls) Delhi
9990771857 Call Girls in Dwarka Sector 1 Delhi (Call Girls) Delhi9990771857 Call Girls in Dwarka Sector 1 Delhi (Call Girls) Delhi
9990771857 Call Girls in Dwarka Sector 1 Delhi (Call Girls) Delhi
 
Shapoorji Pallonji Joyville Vista Pune | Spend Your Family Time Together
Shapoorji Pallonji Joyville Vista Pune | Spend Your Family Time TogetherShapoorji Pallonji Joyville Vista Pune | Spend Your Family Time Together
Shapoorji Pallonji Joyville Vista Pune | Spend Your Family Time Together
 
Kolte Patil Kharadi Pune E Brochure.pdf
Kolte Patil Kharadi Pune E  Brochure.pdfKolte Patil Kharadi Pune E  Brochure.pdf
Kolte Patil Kharadi Pune E Brochure.pdf
 
9990771857 Call Girls Dwarka Sector 9 Delhi (Call Girls ) Delhi
9990771857 Call Girls Dwarka Sector 9 Delhi (Call Girls ) Delhi9990771857 Call Girls Dwarka Sector 9 Delhi (Call Girls ) Delhi
9990771857 Call Girls Dwarka Sector 9 Delhi (Call Girls ) Delhi
 
SVN Live 5.6.24 Weekly Property Broadcast
SVN Live 5.6.24 Weekly Property BroadcastSVN Live 5.6.24 Weekly Property Broadcast
SVN Live 5.6.24 Weekly Property Broadcast
 
Majestique Viman Nagar Pune Brochure.pdf
Majestique Viman Nagar Pune Brochure.pdfMajestique Viman Nagar Pune Brochure.pdf
Majestique Viman Nagar Pune Brochure.pdf
 
9990771857 Call Girls in Dwarka Sector 7 Delhi (Call Girls) Delhi
9990771857 Call Girls in Dwarka Sector 7 Delhi (Call Girls) Delhi9990771857 Call Girls in Dwarka Sector 7 Delhi (Call Girls) Delhi
9990771857 Call Girls in Dwarka Sector 7 Delhi (Call Girls) Delhi
 
Call Girls In Laxmi Nagar Delhi +91-8447779280! !Best Woman Seeking Man Escor...
Call Girls In Laxmi Nagar Delhi +91-8447779280! !Best Woman Seeking Man Escor...Call Girls In Laxmi Nagar Delhi +91-8447779280! !Best Woman Seeking Man Escor...
Call Girls In Laxmi Nagar Delhi +91-8447779280! !Best Woman Seeking Man Escor...
 
Kohinoor Flats In Hinjewadi Phase 2 | Homes Built To Suit Your Needs
Kohinoor Flats In Hinjewadi Phase 2 | Homes Built To Suit Your NeedsKohinoor Flats In Hinjewadi Phase 2 | Homes Built To Suit Your Needs
Kohinoor Flats In Hinjewadi Phase 2 | Homes Built To Suit Your Needs
 
2k Shot Call girls Karol Bagh Delhi 9205541914
2k Shot Call girls Karol Bagh Delhi 92055419142k Shot Call girls Karol Bagh Delhi 9205541914
2k Shot Call girls Karol Bagh Delhi 9205541914
 
BDSM⚡Call Girls in Sector 55 Noida Escorts >༒8448380779 Escort Service
BDSM⚡Call Girls in Sector 55 Noida Escorts >༒8448380779 Escort ServiceBDSM⚡Call Girls in Sector 55 Noida Escorts >༒8448380779 Escort Service
BDSM⚡Call Girls in Sector 55 Noida Escorts >༒8448380779 Escort Service
 
2k Shot Call girls Aiims Delhi 9205541914
2k Shot Call girls Aiims Delhi 92055419142k Shot Call girls Aiims Delhi 9205541914
2k Shot Call girls Aiims Delhi 9205541914
 
9990771857 Call Girls in Dwarka Sector 137 Noida (Call Girls) Delhi
9990771857 Call Girls in Dwarka Sector 137 Noida (Call Girls) Delhi9990771857 Call Girls in Dwarka Sector 137 Noida (Call Girls) Delhi
9990771857 Call Girls in Dwarka Sector 137 Noida (Call Girls) Delhi
 
Greater Vancouver Realtors Statistics Package April 2024
Greater Vancouver Realtors Statistics Package April 2024Greater Vancouver Realtors Statistics Package April 2024
Greater Vancouver Realtors Statistics Package April 2024
 
Call Girls In Vasant Vihar Delhi 💯Call Us 🔝8264348440🔝
Call Girls In Vasant Vihar Delhi 💯Call Us 🔝8264348440🔝Call Girls In Vasant Vihar Delhi 💯Call Us 🔝8264348440🔝
Call Girls In Vasant Vihar Delhi 💯Call Us 🔝8264348440🔝
 
Magarpatta Nova Elegance Mundhwa Pune E-Brochure.pdf
Magarpatta Nova Elegance Mundhwa Pune  E-Brochure.pdfMagarpatta Nova Elegance Mundhwa Pune  E-Brochure.pdf
Magarpatta Nova Elegance Mundhwa Pune E-Brochure.pdf
 
9990771857 Call Girls in Dwarka Sector 2 Delhi (Call Girls) Delhi
9990771857 Call Girls in Dwarka Sector 2 Delhi (Call Girls) Delhi9990771857 Call Girls in Dwarka Sector 2 Delhi (Call Girls) Delhi
9990771857 Call Girls in Dwarka Sector 2 Delhi (Call Girls) Delhi
 

2019 05 Monthly Home Sales Stats for ACADIA, Calgary

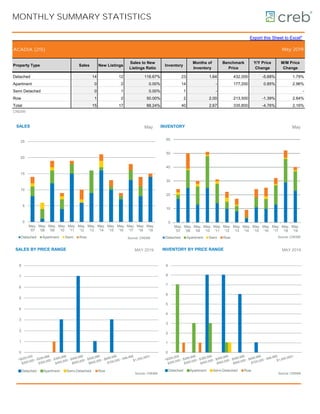
  • 1. MONTHLY SUMMARY STATISTICS Export this Sheet to Excel* ACADIA (215) Property Type Sales New Listings Sales to New Listings Ratio Inventory Months of Inventory Benchmark Price Y/Y Price Change M/M Price Change Detached 14 12 116.67% 23 1.64 432,000 -5.68% 1.79% Apartment 0 2 0.00% 14 - 177,200 0.85% 2.96% Semi Detached 0 1 0.00% 1 - - Row 1 2 50.00% 2 2.00 213,500 -1.39% 2.64% Total 15 17 88.24% 40 2.67 335,800 -4.76% 2.16% CREB® May 2019 0 5 10 15 20 25 May. '07 May. '08 May. '09 May. '10 May. '11 May. '12 May. '13 May. '14 May. '15 May. '16 May. '17 May. '18 May. '19 SALES Detached Apartment Semi Row Source: CREB® May 0 1 2 3 4 5 6 7 8 9 INVENTORY BY PRICE RANGE Detached Apartment Semi-Detached Row Source: CREB® MAY 2019 0 1 2 3 4 5 6 7 8 SALES BY PRICE RANGE Detached Apartment Semi-Detached Row Source: CREB® MAY 2019 0 10 20 30 40 50 60 May. '07 May. '08 May. '09 May. '10 May. '11 May. '12 May. '13 May. '14 May. '15 May. '16 May. '17 May. '18 May. '19 INVENTORY Detached Apartment Semi Row Source: CREB® May
  • 2. TOTAL RESIDENTIAL ACADIA (215) Sales Y/Y% New Listings Y/Y% S/NL Ratio Inventory Months of Supply DOM SP/LP Benchmark Price Y/Y% Median Price Y/Y% Average Price Y/Y% Index Jan-10 7 -13% 12 -8% 0.58 19 2.71 30 98.5% 310,800 5.9% 339,900 7.6% 305,843 1.3% 165 Feb-10 13 63% 13 -32% 1.00 15 1.15 35 97.1% 307,600 4.6% 344,500 23.7% 318,604 15.4% 163 Mar-10 8 -20% 25 0% 0.32 27 3.38 40 97.9% 311,000 7.3% 377,500 18.0% 332,063 8.3% 165 Apr-10 11 -31% 28 87% 0.39 43 3.91 31 97.2% 316,200 7.5% 355,000 6.9% 350,295 10.2% 168 May-10 9 -53% 27 50% 0.33 51 5.67 38 97.0% 317,700 7.0% 315,000 -3.1% 317,700 2.7% 169 Jun-10 8 -58% 24 20% 0.33 52 6.50 38 97.2% 319,400 5.7% 281,250 -21.4% 270,188 -19.1% 170 Jul-10 7 -36% 21 5% 0.33 49 7.00 46 96.8% 314,300 2.4% 335,000 -2.0% 346,393 1.7% 167 Aug-10 12 -14% 20 5% 0.60 42 3.50 42 97.8% 309,400 -0.2% 351,000 6.4% 330,729 5.8% 164 Sep-10 16 -20% 16 7% 1.00 36 2.25 40 96.1% 306,100 -1.1% 317,500 -3.2% 303,344 -2.1% 163 Oct-10 4 -43% 16 -11% 0.25 39 9.75 28 96.5% 303,800 -1.2% 269,400 -26.7% 278,075 -17.5% 161 Nov-10 8 -47% 14 27% 0.57 39 4.88 59 96.7% 303,200 -1.6% 365,750 8.9% 322,656 0.0% 161 Dec-10 8 60% 12 33% 0.67 24 3.00 56 94.3% 316,400 2.3% 317,500 -16.0% 303,563 -9.8% 168 2010 111 -27% 228 13% 0.49 36 4.47 40 96.9% 311,325 3.1% 339,900 2.3% 316,958 0.0% 165 Jan-11 12 71% 22 83% 0.55 28 2.33 31 96.9% 308,100 -0.9% 314,100 -7.6% 315,867 3.3% 164 Feb-11 8 -38% 15 15% 0.53 32 4.00 29 96.9% 313,400 1.9% 326,375 -5.3% 326,294 2.4% 166 Mar-11 11 38% 12 -52% 0.92 30 2.73 35 97.0% 312,100 0.4% 370,000 -2.0% 340,500 2.5% 166 Apr-11 9 -18% 19 -32% 0.47 30 3.33 35 98.1% 316,600 0.1% 354,600 -0.1% 350,372 0.0% 168 May-11 19 111% 26 -4% 0.73 31 1.63 38 98.1% 314,900 -0.9% 336,000 6.7% 314,195 -1.1% 167 Jun-11 12 50% 22 -8% 0.55 36 3.00 44 96.4% 318,100 -0.4% 341,750 21.5% 322,096 19.2% 169 Jul-11 11 57% 16 -24% 0.69 36 3.27 35 97.6% 322,400 2.6% 339,000 1.2% 309,382 -10.7% 171 Aug-11 14 17% 15 -25% 0.93 35 2.50 60 97.4% 320,000 3.4% 341,500 -2.7% 333,407 0.8% 170 Sep-11 6 -63% 16 0% 0.38 34 5.67 54 96.1% 322,100 5.2% 333,000 4.9% 313,750 3.4% 171 Oct-11 7 75% 15 -6% 0.47 33 4.71 43 98.7% 319,100 5.0% 321,000 19.2% 328,771 18.2% 169 Nov-11 9 13% 9 -36% 1.00 25 2.78 62 95.6% 317,200 4.6% 318,000 -13.1% 303,444 -6.0% 168 Dec-11 6 -25% 4 -67% 1.50 18 3.00 47 97.5% 302,900 -4.3% 306,250 -3.5% 282,000 -7.1% 161 2011 124 12% 191 -16% 0.65 31 3.25 42 97.2% 315,575 1.4% 332,750 -2.1% 321,067 1.3% 168 Jan-12 6 -50% 14 -36% 0.43 21 3.50 38 96.7% 301,900 -2.0% 372,500 18.6% 318,417 0.8% 160 Feb-12 8 0% 9 -40% 0.89 21 2.63 105 95.8% 306,600 -2.2% 364,375 11.6% 366,338 12.3% 163 Mar-12 12 9% 21 75% 0.57 26 2.17 30 96.4% 305,900 -2.0% 328,000 -11.4% 323,125 -5.1% 162 Apr-12 17 89% 14 -26% 1.21 16 0.94 23 98.1% 311,100 -1.7% 353,000 -0.5% 328,471 -6.3% 165 May-12 10 -47% 20 -23% 0.50 22 2.20 20 98.8% 315,700 0.3% 343,500 2.2% 340,610 8.4% 168 Jun-12 12 0% 24 9% 0.50 30 2.50 34 97.4% 319,400 0.4% 374,750 9.7% 375,417 16.6% 170 Jul-12 20 82% 18 13% 1.11 24 1.20 30 98.0% 327,000 1.4% 320,000 -5.6% 321,695 4.0% 174 Aug-12 22 57% 23 53% 0.96 25 1.14 32 97.4% 321,100 0.3% 325,000 -4.8% 321,045 -3.7% 171 Sep-12 15 150% 17 6% 0.88 22 1.47 41 97.0% 313,200 -2.8% 331,000 -0.6% 315,500 0.6% 166 Oct-12 9 29% 13 -13% 0.69 19 2.11 22 97.3% 310,200 -2.8% 375,000 16.8% 355,833 8.2% 165 Nov-12 11 22% 10 11% 1.10 15 1.36 70 96.2% 312,300 -1.5% 316,500 -0.5% 313,668 3.4% 166 Dec-12 8 33% 5 25% 1.60 8 1.00 53 96.6% 311,700 2.9% 361,250 18.0% 334,563 18.6% 166 2012 150 21% 188 -2% 0.80 21 1.85 38 97.3% 313,008 -0.8% 339,975 2.2% 331,817 3.3% 166 Jan-13 3 -50% 10 -29% 0.30 13 4.33 48 99.9% 312,300 3.4% 350,000 -6.0% 392,700 23.3% 166 Feb-13 11 38% 15 67% 0.73 14 1.27 28 96.3% 315,900 3.0% 240,000 -34.1% 286,973 -21.7% 168 Mar-13 15 25% 20 -5% 0.75 18 1.20 25 98.6% 318,900 4.2% 371,000 13.1% 332,693 3.0% 169 Apr-13 14 -18% 16 14% 0.88 18 1.29 17 99.4% 327,700 5.3% 373,500 5.8% 339,325 3.3% 174 May-13 16 60% 17 -15% 0.94 17 1.06 45 97.8% 330,500 4.7% 376,250 9.5% 335,525 -1.5% 176 Jun-13 18 50% 18 -25% 1.00 17 0.94 27 98.4% 333,600 4.4% 378,500 1.0% 359,511 -4.2% 177 Jul-13 22 10% 19 6% 1.16 10 0.45 32 98.0% 334,500 2.3% 252,500 -21.1% 289,245 -10.1% 178 Aug-13 10 -55% 21 -9% 0.48 17 1.70 36 97.5% 331,100 3.1% 394,000 21.2% 360,792 12.4% 176 Sep-13 19 27% 14 -18% 1.36 9 0.47 27 97.9% 331,700 5.9% 360,000 8.8% 320,458 1.6% 176 Oct-13 14 56% 18 38% 0.78 9 0.64 22 98.6% 333,400 7.5% 384,500 2.5% 339,393 -4.6% 177 Nov-13 17 55% 11 10% 1.55 6 0.35 23 98.4% 335,600 7.5% 405,000 28.0% 372,547 18.8% 178 Dec-13 3 -63% 6 20% 0.50 8 2.67 32 98.2% 337,500 8.3% 318,000 -12.0% 302,667 -9.5% 179 2013 162 8% 185 -2% 0.88 13 1.37 29 98.2% 328,558 5.0% 375,250 10.4% 333,137 0.4% 174 Jan-14 10 233% 9 -10% 1.11 5 0.50 28 98.5% 336,600 7.8% 363,250 3.8% 335,712 -14.5% 179 Feb-14 5 -55% 10 -33% 0.50 9 1.80 11 99.0% 340,700 7.9% 330,000 37.5% 336,600 17.3% 181 Mar-14 13 -13% 11 -45% 1.18 7 0.54 29 98.1% 344,500 8.0% 345,900 -6.8% 340,723 2.4% 183 Apr-14 13 -7% 19 19% 0.68 13 1.00 16 99.7% 354,100 8.1% 440,000 17.8% 392,800 15.8% 188 May-14 21 31% 22 29% 0.95 9 0.43 24 99.9% 358,400 8.4% 455,000 20.9% 422,839 26.0% 190 Jun-14 14 -22% 16 -11% 0.88 11 0.79 18 99.1% 360,300 8.0% 311,000 -17.8% 315,779 -12.2% 191 Jul-14 11 -50% 18 -5% 0.61 18 1.64 25 98.7% 361,100 8.0% 412,000 63.2% 409,364 41.5% 192 Aug-14 11 10% 18 -14% 0.61 21 1.91 28 98.7% 359,400 8.5% 420,000 6.6% 398,536 10.5% 191 Sep-14 19 0% 16 14% 1.19 13 0.68 29 98.3% 364,100 9.8% 325,000 -9.7% 323,156 0.8% 193 Oct-14 15 7% 23 28% 0.65 18 1.20 30 98.0% 362,800 8.8% 460,000 19.6% 417,093 22.9% 193 Nov-14 12 -29% 18 64% 0.67 22 1.83 35 97.5% 363,900 8.4% 401,000 -1.0% 353,408 -5.1% 193 Dec-14 9 200% 7 17% 1.29 18 2.00 32 96.4% 366,500 8.6% 238,000 -25.2% 293,222 -3.1% 195 2014 153 -6% 187 1% 0.82 14 1.19 26 98.6% 356,033 8.4% 400,000 6.6% 366,272 9.9% 189
  • 3. TOTAL RESIDENTIAL ACADIA (215) Sales Y/Y% New Listings Y/Y% S/NL Ratio Inventory Months of Supply DOM SP/LP Benchmark Price Y/Y% Median Price Y/Y% Average Price Y/Y% Index Jan-15 4 -60% 28 211% 0.14 34 8.50 13 99.3% 369,000 9.6% 462,450 27.3% 446,225 32.9% 196 Feb-15 18 260% 17 70% 1.06 28 1.56 26 97.6% 365,000 7.1% 394,250 19.5% 367,758 9.3% 194 Mar-15 14 8% 17 55% 0.82 21 1.50 40 97.1% 361,200 4.8% 411,500 19.0% 363,964 6.8% 192 Apr-15 20 54% 23 21% 0.87 26 1.30 31 97.8% 362,400 2.3% 403,000 -8.4% 391,355 -0.4% 192 May-15 13 -38% 20 -9% 0.65 24 1.85 23 98.2% 354,700 -1.0% 399,400 -12.2% 387,504 -8.4% 188 Jun-15 16 14% 15 -6% 1.07 19 1.19 33 98.2% 353,900 -1.8% 414,050 33.1% 431,009 36.5% 188 Jul-15 9 -18% 16 -11% 0.56 23 2.56 36 97.1% 353,100 -2.2% 356,000 -13.6% 348,944 -14.8% 188 Aug-15 11 0% 13 -28% 0.85 19 1.73 38 97.4% 351,400 -2.2% 325,000 -22.6% 336,645 -15.5% 187 Sep-15 13 -32% 15 -6% 0.87 15 1.15 45 97.0% 350,900 -3.6% 335,000 3.1% 350,731 8.5% 186 Oct-15 10 -33% 16 -30% 0.63 19 1.90 21 97.5% 349,200 -3.7% 407,500 -11.4% 371,500 -10.9% 185 Nov-15 10 -17% 8 -56% 1.25 15 1.50 39 95.6% 343,400 -5.6% 326,250 -18.6% 321,600 -9.0% 182 Dec-15 7 -22% 7 0% 1.00 13 1.86 28 96.8% 339,800 -7.3% 377,000 58.4% 358,500 22.3% 180 2015 145 -5% 195 4% 0.74 21 2.22 32 97.5% 354,500 -0.4% 393,000 -1.7% 373,134 1.9% 188 Jan-16 3 -25% 17 -39% 0.18 23 7.67 16 98.1% 339,400 -8.0% 403,000 -12.9% 410,167 -8.1% 180 Feb-16 8 -56% 11 -35% 0.73 25 3.13 57 95.8% 345,000 -5.5% 391,000 -0.8% 398,000 8.2% 183 Mar-16 10 -29% 13 -24% 0.77 24 2.40 26 98.2% 343,500 -4.9% 404,500 -1.7% 344,050 -5.5% 182 Apr-16 14 -30% 20 -13% 0.70 27 1.93 44 97.7% 348,800 -3.8% 403,000 0.0% 375,493 -4.1% 185 May-16 9 -31% 16 -20% 0.56 25 2.78 32 98.6% 352,400 -0.6% 390,100 -2.3% 375,122 -3.2% 187 Jun-16 11 -31% 15 0% 0.73 20 1.82 36 98.9% 348,400 -1.6% 322,500 -22.1% 339,645 -21.2% 185 Jul-16 10 11% 10 -38% 1.00 14 1.40 31 97.7% 346,600 -1.8% 412,075 15.8% 391,365 12.2% 184 Aug-16 6 -45% 13 0% 0.46 21 3.50 56 96.2% 339,600 -3.4% 432,000 32.9% 459,000 36.3% 180 Sep-16 8 -38% 12 -20% 0.67 24 3.00 34 97.6% 346,600 -1.2% 394,250 17.7% 366,438 4.5% 184 Oct-16 8 -20% 16 0% 0.50 28 3.50 66 97.5% 352,000 0.8% 484,250 18.8% 438,563 18.1% 187 Nov-16 12 20% 19 138% 0.63 29 2.42 27 98.0% 345,800 0.7% 397,500 21.8% 384,292 19.5% 184 Dec-16 4 -43% 4 -43% 1.00 17 4.25 83 96.4% 342,000 0.6% 323,000 -14.3% 331,125 -7.6% 182 2016 103 -29% 166 -15% 0.62 23 3.15 40 97.6% 345,842 -2.4% 407,000 3.6% 381,240 2.2% 184 Jan-17 8 167% 16 -6% 0.50 20 2.50 55 97.0% 341,100 0.5% 336,000 -16.6% 353,625 -13.8% 181 Feb-17 10 25% 16 45% 0.63 21 2.10 24 97.6% 340,900 -1.2% 356,500 -8.8% 347,150 -12.8% 181 Mar-17 9 -10% 21 62% 0.43 30 3.33 28 97.7% 341,700 -0.5% 358,000 -11.5% 351,422 2.1% 181 Apr-17 12 -14% 17 -15% 0.71 31 2.58 55 97.7% 353,000 1.2% 411,750 2.2% 375,125 -0.1% 187 May-17 18 100% 24 50% 0.75 32 1.78 28 97.7% 356,700 1.2% 445,000 14.1% 388,278 3.5% 189 Jun-17 12 9% 26 73% 0.46 45 3.75 35 98.2% 357,700 2.7% 405,000 25.6% 369,708 8.9% 190 Jul-17 14 40% 20 100% 0.70 37 2.64 28 98.2% 360,500 4.0% 426,850 3.6% 432,050 10.4% 191 Aug-17 13 117% 18 38% 0.72 38 2.92 68 97.2% 360,300 6.1% 365,000 -15.5% 359,531 -21.7% 191 Sep-17 7 -13% 21 75% 0.33 45 6.43 39 96.7% 362,900 4.7% 405,000 2.7% 444,857 21.4% 193 Oct-17 17 113% 11 -31% 1.55 32 1.88 40 96.1% 355,800 1.1% 367,000 -24.2% 322,621 -26.4% 189 Nov-17 9 -25% 13 -32% 0.69 29 3.22 59 97.5% 346,900 0.3% 392,000 -1.4% 374,578 -2.5% 184 Dec-17 9 125% 14 250% 0.64 27 3.00 80 97.9% 343,400 0.4% 419,000 29.7% 396,378 19.7% 182 2017 138 34% 217 31% 0.64 32 3.01 43 97.5% 351,742 1.7% 395,000 -2.9% 374,276 -1.8% 187 Jan-18 7 -13% 13 -19% 0.54 26 3.71 54 96.4% 346,900 1.7% 410,000 22.0% 402,214 13.7% 184 Feb-18 5 -50% 14 -13% 0.36 33 6.60 45 93.4% 350,300 2.8% 255,000 -28.5% 277,000 -20.2% 186 Mar-18 9 0% 21 0% 0.43 40 4.44 68 97.7% 359,000 5.1% 430,000 20.1% 428,778 22.0% 191 Apr-18 13 8% 25 47% 0.52 48 3.69 20 97.6% 356,900 1.1% 470,000 14.1% 454,262 21.1% 190 May-18 14 -22% 29 21% 0.48 52 3.71 39 97.9% 352,600 -1.1% 395,500 -11.1% 359,143 -7.5% 187 Jun-18 12 0% 19 -27% 0.63 48 4.00 35 96.1% 353,000 -1.3% 406,500 0.4% 354,771 -4.0% 187 Jul-18 13 -7% 29 45% 0.45 54 4.15 55 97.2% 353,000 -2.1% 375,000 -12.1% 342,762 -20.7% 187 Aug-18 14 8% 21 17% 0.67 52 3.71 48 96.1% 345,800 -4.0% 347,250 -4.9% 334,536 -7.0% 184 Sep-18 15 114% 22 5% 0.68 42 2.80 58 97.1% 352,200 -2.9% 407,000 0.5% 400,636 -9.9% 187 Oct-18 11 -35% 14 27% 0.79 39 3.55 75 96.0% 343,400 -3.5% 315,000 -14.2% 343,755 6.6% 182 Nov-18 8 -11% 6 -54% 1.33 30 3.75 79 97.2% 337,300 -2.8% 383,700 -2.1% 358,175 -4.4% 179 Dec-18 5 -44% 7 -50% 0.71 20 4.00 50 96.2% 324,100 -5.6% 362,500 -13.5% 351,790 -11.2% 172 2018 126 -9% 220 1% 0.57 40 4.01 51 96.8% 347,875 -1.1% 396,250 0.3% 371,466 -0.8% 185 Jan-19 5 -29% 21 62% 0.24 29 5.80 86 96.6% 326,000 -6.0% 425,000 3.7% 393,100 -2.3% 173 Feb-19 9 80% 15 7% 0.60 30 3.33 60 96.3% 323,400 -7.7% 396,000 55.3% 393,000 41.9% 172 Mar-19 8 -11% 25 19% 0.32 42 5.25 27 96.1% 327,500 -8.8% 379,250 -11.8% 359,375 -16.2% 174 Apr-19 12 -8% 23 -8% 0.52 50 4.17 30 96.8% 328,700 -7.9% 392,500 -16.5% 382,894 -15.7% 175 May-19 15 7% 17 -41% 0.88 40 2.67 43 97.2% 335,800 -4.8% 465,900 17.8% 466,840 30.0% 178 Jun-19 Jul-19 Aug-19 Sep-19 Oct-19 Nov-19 Dec-19 2019 49 -61% 101 -54% 0.49 38 4.24 45 96.7% 328,280 -5.6% 410,000 3.5% 407,650 9.7% 174
  • 4. TOTAL RESIDENTIAL ACADIA (215) -20% -15% -10% -5% 0% 5% 10% 15% - 1 2 3 4 5 MONTHS OF SUPPLY AND PRICE CHANGE Months of supply trend (12 M) Benchmark price y/y% change Source: CREB® 0 10 20 30 40 50 60 0% 20% 40% 60% 80% 100% 120% SALES TO NEW LISTINGS RATIO AND INVENTORY Inventory Sales to New listings ratio trend (12 M) Inventory trend (12 M) Source: CREB® 0 100,000 200,000 300,000 400,000 500,000 600,000 PRICE COMPARISON Average Median Benchmark Source: CREB® - 10 20 30 40 50 60 DAYS ON MARKET Days on market trend (12 M) Source: CREB® 305,000 310,000 315,000 320,000 325,000 330,000 335,000 340,000 345,000 350,000 355,000 360,000 0 10 20 30 40 50 60 May. '18 Jun. '18 Jul. '18 Aug. '18 Sep. '18 Oct. '18 Nov. '18 Dec. '18 Jan. '19 Feb. '19 Mar. '19 Apr. '19 May. '19 INVENTORY, SALES AND PRICE Inventory Sales Benchmark Price Source: CREB® 0 1 2 3 4 5 6 7 8 9 <$200,000 $200,000 - $299,999 $300,000 - $399,999 $400,000 - $499,999 $500,000 - $599,999 $600,000 - $699,999 $700,000 - 999,999 $1,000,000+ MONTHS OF SUPPLY BY PRICE RANGE May-16 May-17 May-18 May-19 Source: CREB® May
  • 5. TOTAL RESIDENTIAL ACADIA (215) - 2 4 6 8 10 12 14 16 18 20 Jan. Feb. Mar. Apr. May Jun. Jul. Aug. Sept. Oct. Nov. Dec. SALES COMPARISON 2019 2018 2017 2016 Source: CREB® 0 5 10 15 20 25 <$200,000 $200,000 - $299,999 $300,000 - $399,999 $400,000 - $499,999 $500,000 - $599,999 $600,000 - $699,999 $700,000 - 999,999 $1,000,000+ YTD SALES BY PRICE RANGE YTD-2016 YTD-2017 YTD-2018 YTD-2019 Source: CREB® YTD-MAY 0 5 10 15 20 25 30 35 40 <$200,000 $200,000 - $299,999 $300,000 - $399,999 $400,000 - $499,999 $500,000 - $599,999 $600,000 - $699,999 $700,000 - 999,999 $1,000,000+ YTD NEW LISTINGS BY PRICE RANGE YTD-2016 YTD-2017 YTD-2018 YTD-2019 Source: CREB® YTD-MAY 0 2 4 6 8 10 12 14 16 18 <$200,000 $200,000 - $299,999 $300,000 - $399,999 $400,000 - $499,999 $500,000 - $599,999 $600,000 - $699,999 $700,000 - 999,999 $1,000,000+ INVENTORY BY PRICE RANGE May-16 May-17 May-18 May-19 Source: CREB® May - 5 10 15 20 25 30 35 Jan. Feb. Mar. Apr. May Jun. Jul. Aug. Sept. Oct. Nov. Dec. NEW LISTINGS COMPARISON 2019 2018 2017 2016 Source: CREB® - 10 20 30 40 50 60 Jan. Feb. Mar. Apr. May Jun. Jul. Aug. Sept. Oct. Nov. Dec. INVENTORY COMPARISON 2019 2018 2017 2016 Source: CREB®
  • 6. DETACHED ACADIA (215) Sales Y/Y% New Listings Y/Y% S/NL Ratio Inventory Months of Supply DOM SP/LP Benchmark Price Y/Y% Median Price Y/Y% Average Price Y/Y% Index Jan-10 4 -33% 3 -70% 1.33 7 1.75 43 98.5% 375,100 10.9% 354,000 8.6% 358,225 8.6% 159 Feb-10 7 75% 7 -30% 1.00 5 0.71 28 97.9% 368,200 6.5% 360,000 2.1% 360,500 2.6% 156 Mar-10 5 -38% 14 -26% 0.36 12 2.40 21 98.4% 376,000 10.6% 390,000 16.4% 394,400 16.9% 159 Apr-10 8 -33% 16 100% 0.50 19 2.38 31 97.3% 380,500 9.3% 371,250 9.0% 376,781 6.3% 161 May-10 4 -67% 16 78% 0.25 25 6.25 34 96.3% 383,800 7.4% 362,250 8.1% 367,575 2.9% 163 Jun-10 4 -71% 18 38% 0.22 32 8.00 21 97.5% 386,600 5.7% 345,000 -5.0% 348,250 -7.4% 164 Jul-10 6 -14% 11 -8% 0.55 31 5.17 40 96.7% 377,700 1.6% 352,000 -3.6% 375,042 -0.8% 160 Aug-10 8 0% 12 -8% 0.67 26 3.25 55 97.8% 371,500 -1.3% 377,500 -1.9% 390,063 2.3% 157 Sep-10 9 -36% 10 25% 0.90 22 2.44 40 96.5% 368,200 -2.1% 357,000 1.9% 352,889 0.2% 156 Oct-10 2 -60% 10 -9% 0.20 24 12.00 24 95.6% 366,300 -0.9% 334,400 -12.0% 334,400 -13.2% 155 Nov-10 6 -33% 9 50% 0.67 26 4.33 69 96.8% 367,000 -1.5% 370,750 -5.5% 363,542 -8.1% 155 Dec-10 4 0% 6 -14% 0.67 14 3.50 59 95.6% 390,900 5.4% 377,500 -1.2% 371,250 0.4% 166 2010 67 -35% 132 5% 0.51 20 4.35 40 97.2% 375,983 4.1% 369,000 2.5% 368,474 1.2% 159 Jan-11 11 175% 18 500% 0.61 18 1.64 31 96.9% 377,400 0.6% 315,000 -11.0% 330,491 -7.7% 160 Feb-11 6 -14% 13 86% 0.46 21 3.50 22 96.9% 388,300 5.5% 335,375 -6.8% 336,725 -6.6% 164 Mar-11 10 100% 9 -36% 1.11 17 1.70 28 97.0% 388,300 3.3% 372,000 -4.6% 360,250 -8.7% 164 Apr-11 8 0% 11 -31% 0.73 14 1.75 28 98.3% 393,700 3.5% 373,175 0.5% 365,419 -3.0% 167 May-11 15 275% 17 6% 0.88 14 0.93 31 98.5% 392,800 2.3% 360,000 -0.6% 349,801 -4.8% 166 Jun-11 7 75% 11 -39% 0.64 15 2.14 36 96.9% 397,000 2.7% 370,000 7.2% 369,522 6.1% 168 Jul-11 6 0% 11 0% 0.55 18 3.00 22 98.0% 404,100 7.0% 348,750 -0.9% 347,000 -7.5% 171 Aug-11 11 38% 12 0% 0.92 20 1.82 48 97.6% 398,700 7.3% 379,000 0.4% 375,000 -3.9% 169 Sep-11 4 -56% 9 -10% 0.44 20 5.00 52 96.1% 402,900 9.4% 368,750 3.3% 379,375 7.5% 171 Oct-11 5 150% 9 -10% 0.56 20 4.00 43 98.7% 398,500 8.8% 338,000 1.1% 361,980 8.2% 169 Nov-11 8 33% 6 -33% 1.33 15 1.88 63 95.4% 394,200 7.4% 319,500 -13.8% 316,375 -13.0% 167 Dec-11 3 -25% 1 -83% 3.00 10 3.33 43 97.8% 366,300 -6.3% 390,000 3.3% 381,500 2.8% 155 2011 94 40% 127 -4% 0.74 17 2.56 36 97.4% 391,850 4.2% 346,500 -6.1% 353,459 -4.1% 166 Jan-12 4 -64% 6 -67% 0.67 10 2.50 25 97.5% 368,000 -2.5% 391,500 24.3% 387,750 17.3% 156 Feb-12 8 33% 5 -62% 1.60 7 0.88 105 95.8% 376,500 -3.0% 364,375 8.6% 366,338 8.8% 159 Mar-12 6 -40% 12 33% 0.50 12 2.00 27 98.0% 377,000 -2.9% 371,000 -0.3% 381,167 5.8% 160 Apr-12 13 63% 10 -9% 1.30 8 0.62 17 98.7% 383,800 -2.5% 373,000 0.0% 368,423 0.8% 163 May-12 6 -60% 12 -29% 0.50 10 1.67 12 99.2% 389,000 -1.0% 392,550 9.0% 405,850 16.0% 165 Jun-12 9 29% 15 36% 0.60 16 1.78 36 97.8% 394,900 -0.5% 395,000 6.8% 401,389 8.6% 167 Jul-12 10 67% 11 0% 0.91 14 1.40 17 98.4% 408,900 1.2% 385,000 10.4% 379,400 9.3% 173 Aug-12 13 18% 15 25% 0.87 16 1.23 28 97.6% 399,900 0.3% 380,000 0.3% 377,615 0.7% 169 Sep-12 10 150% 12 33% 0.83 16 1.60 45 97.1% 388,300 -3.6% 345,000 -6.4% 352,100 -7.2% 164 Oct-12 8 60% 8 -11% 1.00 9 1.13 23 97.1% 380,500 -4.5% 375,000 10.9% 365,063 0.9% 161 Nov-12 6 -25% 8 33% 0.75 8 1.33 70 96.3% 386,200 -2.0% 394,000 23.3% 387,333 22.4% 164 Dec-12 6 100% 3 200% 2.00 4 0.67 43 96.5% 386,200 5.4% 376,250 -3.5% 382,083 0.2% 164 2012 99 5% 117 -8% 0.85 11 1.40 36 97.6% 386,600 -1.3% 378,000 9.1% 377,442 6.8% 164 Jan-13 3 -25% 4 -33% 0.75 4 1.33 48 99.9% 386,900 5.1% 350,000 -10.6% 392,700 1.3% 164 Feb-13 5 -38% 6 20% 0.83 5 1.00 28 96.3% 392,100 4.1% 390,000 7.0% 395,550 8.0% 166 Mar-13 9 50% 12 0% 0.75 7 0.78 29 98.7% 394,900 4.7% 404,000 8.9% 411,656 8.0% 167 Apr-13 10 -23% 10 0% 1.00 7 0.70 13 99.6% 407,400 6.1% 405,450 8.7% 406,405 10.3% 173 May-13 9 50% 10 -17% 0.90 8 0.89 42 98.1% 409,300 5.2% 388,000 -1.2% 398,378 -1.8% 173 Jun-13 12 33% 10 -33% 1.20 7 0.58 23 98.8% 413,300 4.7% 401,000 1.5% 419,475 4.5% 175 Jul-13 9 -10% 13 18% 0.69 8 0.89 22 98.7% 415,700 1.7% 410,000 6.5% 418,489 10.3% 176 Aug-13 7 -46% 12 -20% 0.58 11 1.57 19 97.5% 409,600 2.4% 423,000 11.3% 429,486 13.7% 173 Sep-13 10 0% 6 -50% 1.67 3 0.30 28 98.1% 410,500 5.7% 411,250 19.2% 410,150 16.5% 174 Oct-13 8 0% 13 63% 0.62 4 0.50 18 98.9% 414,800 9.0% 418,750 11.7% 426,500 16.8% 176 Nov-13 14 133% 7 -13% 2.00 1 0.07 23 98.6% 419,500 8.6% 410,000 4.1% 412,843 6.6% 178 Dec-13 1 -83% 2 -33% 0.50 2 2.00 15 98.8% 420,900 9.0% 405,000 7.6% 405,000 6.0% 178 2013 97 -2% 105 -10% 0.92 6 0.88 25 98.5% 407,908 5.5% 407,000 7.7% 412,526 9.3% 173 Jan-14 5 67% 4 0% 1.25 1 0.20 31 98.4% 417,600 7.9% 417,500 19.3% 424,900 8.2% 177 Feb-14 2 -60% 4 -33% 0.50 2 1.00 6 99.2% 421,400 7.5% 435,750 11.7% 435,750 10.2% 178 Mar-14 5 -44% 7 -42% 0.71 3 0.60 23 98.9% 421,400 6.7% 440,000 8.9% 439,200 6.7% 178 Apr-14 10 0% 14 40% 0.71 8 0.80 13 99.9% 436,200 7.1% 448,750 10.7% 440,450 8.4% 185 May-14 16 78% 14 40% 1.14 3 0.19 18 100.2% 441,000 7.7% 467,250 20.4% 465,163 16.8% 187 Jun-14 4 -67% 8 -20% 0.50 7 1.75 14 99.9% 444,800 7.6% 414,700 3.4% 436,600 4.1% 188 Jul-14 8 -11% 11 -15% 0.73 11 1.38 23 98.9% 444,500 6.9% 445,500 8.7% 466,375 11.4% 188 Aug-14 9 29% 9 -25% 1.00 10 1.11 28 98.8% 440,300 7.5% 424,900 0.4% 437,989 2.0% 186 Sep-14 5 -50% 7 17% 0.71 7 1.40 28 99.1% 448,800 9.3% 472,000 14.8% 460,534 12.3% 190 Oct-14 10 25% 12 -8% 0.83 8 0.80 26 98.1% 447,800 8.0% 473,500 13.1% 479,450 12.4% 190 Nov-14 7 -50% 7 0% 1.00 7 1.00 35 97.5% 443,600 5.7% 427,000 4.1% 437,000 5.9% 188 Dec-14 3 200% 4 100% 0.75 9 3.00 29 96.3% 447,800 6.4% 425,000 4.9% 424,667 4.9% 190 2014 84 -13% 101 -4% 0.83 6 1.10 23 99.0% 437,933 7.4% 449,500 10.4% 451,055 9.3% 185
  • 7. DETACHED ACADIA (215) Sales Y/Y% New Listings Y/Y% S/NL Ratio Inventory Months of Supply DOM SP/LP Benchmark Price Y/Y% Median Price Y/Y% Average Price Y/Y% Index Jan-15 3 -40% 16 300% 0.19 19 6.33 12 99.7% 455,600 9.1% 475,000 13.8% 481,633 13.4% 193 Feb-15 11 450% 13 225% 0.85 16 1.45 15 97.7% 449,000 6.5% 440,000 1.0% 437,023 0.3% 190 Mar-15 9 80% 11 57% 0.82 11 1.22 40 97.4% 441,700 4.8% 439,000 -0.2% 438,833 -0.1% 187 Apr-15 15 50% 12 -14% 1.25 10 0.67 33 97.8% 443,300 1.6% 436,000 -2.8% 436,300 -0.9% 188 May-15 10 -38% 15 7% 0.67 11 1.10 24 98.2% 431,300 -2.2% 427,375 -8.5% 436,005 -6.3% 183 Jun-15 14 250% 7 -13% 2.00 5 0.36 35 98.3% 431,100 -3.1% 419,050 1.0% 450,510 3.2% 183 Jul-15 5 -38% 8 -27% 0.63 7 1.40 23 96.6% 432,700 -2.7% 419,000 -5.9% 430,400 -7.7% 183 Aug-15 5 -44% 6 -33% 0.83 8 1.60 26 97.7% 428,000 -2.8% 440,000 3.6% 439,500 0.3% 181 Sep-15 5 0% 8 14% 0.63 7 1.40 43 96.9% 427,700 -4.7% 425,000 -10.0% 438,000 -4.9% 181 Oct-15 7 -30% 9 -25% 0.78 9 1.29 21 97.4% 425,100 -5.1% 416,000 -12.1% 422,143 -12.0% 180 Nov-15 3 -57% 3 -57% 1.00 7 2.33 31 96.4% 414,800 -6.5% 415,500 -2.7% 427,167 -2.3% 176 Dec-15 5 67% 5 25% 1.00 5 1.00 21 97.3% 408,100 -8.9% 380,000 -10.6% 391,900 -7.7% 173 2015 92 10% 113 12% 0.81 10 1.68 28 97.7% 432,367 -1.3% 425,000 -5.5% 436,400 -3.2% 183 Jan-16 3 0% 10 -38% 0.30 11 3.67 16 98.1% 412,200 -9.5% 403,000 -15.2% 410,167 -14.8% 175 Feb-16 7 -36% 6 -54% 1.17 11 1.57 50 95.6% 424,000 -5.6% 393,000 -10.7% 410,429 -6.1% 180 Mar-16 5 -44% 8 -27% 0.63 12 2.40 15 98.5% 424,700 -3.8% 447,000 1.8% 435,200 -0.8% 180 Apr-16 10 -33% 12 0% 0.83 13 1.30 41 98.0% 435,500 -1.8% 420,500 -3.6% 423,200 -3.0% 184 May-16 7 -30% 10 -33% 0.70 10 1.43 19 98.6% 442,400 2.6% 415,000 -2.9% 423,443 -2.9% 187 Jun-16 5 -64% 9 29% 0.56 10 2.00 29 100.7% 436,200 1.2% 438,000 4.5% 436,300 -3.2% 185 Jul-16 8 60% 6 -25% 1.33 6 0.75 29 97.8% 433,200 0.1% 429,250 2.4% 438,206 1.8% 183 Aug-16 6 20% 5 -17% 1.20 6 1.00 56 96.2% 424,200 -0.9% 432,000 -1.8% 459,000 4.4% 180 Sep-16 5 0% 7 -13% 0.71 9 1.80 18 98.1% 433,900 1.4% 477,500 12.4% 469,900 7.3% 184 Oct-16 6 -14% 8 -11% 0.75 10 1.67 66 97.8% 446,400 5.0% 490,000 17.8% 482,417 14.3% 189 Nov-16 9 200% 10 233% 0.90 8 0.89 23 98.1% 439,600 6.0% 430,000 3.5% 426,278 -0.2% 186 Dec-16 2 -60% 1 -80% 2.00 3 1.50 75 96.8% 437,700 7.3% 427,750 12.6% 427,750 9.1% 185 2016 73 -21% 92 -19% 0.79 9 1.66 35 97.8% 432,500 0.0% 429,000 0.9% 436,339 0.0% 183 Jan-17 4 33% 5 -50% 0.80 5 1.25 43 97.9% 437,200 6.1% 445,500 10.5% 483,000 17.8% 185 Feb-17 6 -14% 7 17% 0.86 4 0.67 16 98.3% 436,000 2.8% 475,250 20.9% 448,083 9.2% 185 Mar-17 4 -20% 9 13% 0.44 10 2.50 34 96.7% 437,000 2.9% 434,000 -2.9% 447,200 2.8% 185 Apr-17 6 -40% 10 -17% 0.60 11 1.83 56 97.8% 454,400 4.3% 469,500 11.7% 489,000 15.5% 192 May-17 13 86% 13 30% 1.00 13 1.00 27 97.6% 459,900 4.0% 450,000 8.4% 460,500 8.8% 195 Jun-17 8 60% 16 78% 0.50 20 2.50 21 98.7% 463,600 6.3% 441,250 0.7% 450,875 3.3% 196 Jul-17 11 38% 10 67% 1.10 14 1.27 22 98.2% 467,400 7.9% 455,000 6.0% 467,655 6.7% 198 Aug-17 6 0% 10 100% 0.60 16 2.67 66 97.4% 464,600 9.5% 443,500 2.7% 460,317 0.3% 197 Sep-17 4 -20% 11 57% 0.36 22 5.50 44 96.6% 468,400 8.0% 522,250 9.4% 531,000 13.0% 198 Oct-17 10 67% 9 13% 1.11 16 1.60 37 97.2% 460,300 3.1% 394,000 -19.6% 421,000 -12.7% 195 Nov-17 6 -33% 5 -50% 1.20 12 2.00 54 98.1% 447,800 1.9% 417,500 -2.9% 429,833 0.8% 190 Dec-17 7 250% 10 900% 0.70 12 1.71 59 98.2% 442,600 1.1% 430,000 0.5% 437,200 2.2% 187 2017 85 16% 115 25% 0.74 13 2.04 37 97.8% 453,267 4.8% 445,000 3.7% 456,662 4.7% 192 Jan-18 5 25% 5 0% 1.00 11 2.20 59 96.5% 453,000 3.6% 425,500 -4.5% 493,600 2.2% 192 Feb-18 1 -83% 9 29% 0.11 17 17.00 33 95.2% 457,700 5.0% 400,000 -15.8% 400,000 -10.7% 194 Mar-18 7 75% 16 78% 0.44 22 3.14 27 98.1% 470,500 7.7% 443,000 2.1% 491,929 10.0% 199 Apr-18 12 100% 19 90% 0.63 28 2.33 20 97.6% 465,500 2.4% 477,500 1.7% 474,450 -3.0% 197 May-18 8 -38% 16 23% 0.50 29 3.63 25 98.4% 458,000 -0.4% 416,750 -7.4% 444,438 -3.5% 194 Jun-18 9 13% 14 -13% 0.64 26 2.89 35 96.3% 459,200 -0.9% 420,000 -4.8% 420,583 -6.7% 194 Jul-18 7 -36% 19 90% 0.37 32 4.57 58 97.4% 462,200 -1.1% 431,000 -5.3% 466,286 -0.3% 196 Aug-18 7 17% 13 30% 0.54 30 4.29 23 96.2% 446,900 -3.8% 423,000 -4.6% 431,643 -6.2% 189 Sep-18 9 125% 18 64% 0.50 29 3.22 27 97.3% 456,300 -2.6% 552,500 5.8% 531,349 0.1% 193 Oct-18 4 -60% 11 22% 0.36 31 7.75 22 96.5% 442,600 -3.8% 438,750 11.4% 460,625 9.4% 187 Nov-18 5 -17% 3 -40% 1.67 23 4.60 50 97.8% 438,100 -2.2% 400,000 -4.2% 469,480 9.2% 186 Dec-18 3 -57% 6 -40% 0.50 16 5.33 37 96.1% 413,800 -6.5% 395,050 -8.1% 409,683 -6.3% 175 2018 77 -9% 149 30% 0.52 25 5.08 33 97.2% 451,983 -0.3% 431,000 -3.1% 465,354 1.9% 191 Jan-19 4 -20% 15 200% 0.27 20 5.00 104 96.4% 419,500 -7.4% 432,500 1.6% 446,875 -9.5% 178 Feb-19 5 400% 11 22% 0.45 23 4.60 77 96.4% 414,800 -9.4% 460,000 15.0% 497,600 24.4% 176 Mar-19 6 -14% 18 13% 0.33 30 5.00 24 95.9% 420,400 -10.6% 395,000 -10.8% 403,167 -18.0% 178 Apr-19 10 -17% 18 -5% 0.56 35 3.50 29 96.7% 424,400 -8.8% 399,500 -16.3% 412,323 -13.1% 180 May-19 14 75% 12 -25% 1.17 23 1.64 43 97.3% 432,000 -5.7% 471,700 13.2% 482,686 8.6% 183 Jun-19 Jul-19 Aug-19 Sep-19 Oct-19 Nov-19 Dec-19 2019 39 -49% 74 -50% 0.53 26 3.95 47 96.7% 422,220 -6.6% 435,500 1.0% 450,649 -3.2% 179
  • 8. DETACHED ACADIA (215) -20% -15% -10% -5% 0% 5% 10% 15% - 1 2 3 4 5 6 MONTHS OF SUPPLY AND PRICE CHANGE Months of Supply trend (12 M) Benchmark price y/y % Change Source: CREB® 0 5 10 15 20 25 30 35 40 0% 20% 40% 60% 80% 100% 120% SALES TO NEW LISTINGS RATIO AND INVENTORY Inventory Sales to New listings ratio trend (12 M) Inventory Trend (12 M) Source: CREB® 0 100,000 200,000 300,000 400,000 500,000 600,000 PRICE COMPARISON Average Median Benchmark Source: CREB® - 5 10 15 20 25 30 35 40 45 50 DAYS ON MARKET Days on market trend (12 M) Source: CREB® 380,000 390,000 400,000 410,000 420,000 430,000 440,000 450,000 460,000 470,000 0 5 10 15 20 25 30 35 40 May. '18 Jun. '18 Jul. '18 Aug. '18 Sep. '18 Oct. '18 Nov. '18 Dec. '18 Jan. '19 Feb. '19 Mar. '19 Apr. '19 May. '19 INVENTORY, SALES AND PRICE Inventory Sales Benchmark Price Source: CREB® 0 1 2 3 4 5 6 7 <$200,000 $200,000 - $299,999 $300,000 - $399,999 $400,000 - $499,999 $500,000 - $599,999 $600,000 - $699,999 $700,000 - 999,999 $1,000,000+ MONTHS OF SUPPLY BY PRICE RANGE May-16 May-17 May-18 May-19 Source: CREB® May
  • 9. DETACHED ACADIA (215) - 2 4 6 8 10 12 14 16 Jan. Feb. Mar. Apr. May Jun. Jul. Aug. Sept. Oct. Nov. Dec. SALES COMPARISON 2019 2018 2017 2016 Source: CREB® 0 5 10 15 20 25 <$200,000 $200,000 - $299,999 $300,000 - $399,999 $400,000 - $499,999 $500,000 - $599,999 $600,000 - $699,999 $700,000 - 999,999 $1,000,000+ YTD SALES BY PRICE RANGE YTD-2016 YTD-2017 YTD-2018 YTD-2019 Source: CREB® YTD-MAY 0 5 10 15 20 25 30 35 40 <$200,000 $200,000 - $299,999 $300,000 - $399,999 $400,000 - $499,999 $500,000 - $599,999 $600,000 - $699,999 $700,000 - 999,999 $1,000,000+ YTD NEW LISTINGS BY PRICE RANGE YTD-2016 YTD-2017 YTD-2018 YTD-2019 Source: CREB® YTD-MAY 0 2 4 6 8 10 12 14 16 18 <$200,000 $200,000 - $299,999 $300,000 - $399,999 $400,000 - $499,999 $500,000 - $599,999 $600,000 - $699,999 $700,000 - 999,999 $1,000,000+ INVENTORY BY PRICE RANGE May-16 May-17 May-18 May-19 Source: CREB® May - 2 4 6 8 10 12 14 16 18 20 Jan. Feb. Mar. Apr. May Jun. Jul. Aug. Sept. Oct. Nov. Dec. NEW LISTINGS COMPARISON 2019 2018 2017 2016 Source: CREB® - 5 10 15 20 25 30 35 40 Jan. Feb. Mar. Apr. May Jun. Jul. Aug. Sept. Oct. Nov. Dec. INVENTORY COMPARISON 2019 2018 2017 2016 Source: CREB®
  • 10. APARTMENT ACADIA (215) Sales Y/Y% New Listings Y/Y% S/NL Ratio Inventory Months of Supply DOM SP/LP Benchmark Price Y/Y% Median Price Y/Y% Average Price Y/Y% Index Jan-10 1 6 200% 0.17 7 7.00 12 98.7% 190,800 2.8% 183,000 183,000 177 Feb-10 3 50% 4 -33% 0.75 7 2.33 42 95.2% 193,300 7.4% 306,000 66.3% 297,667 61.8% 180 Mar-10 2 100% 7 75% 0.29 11 5.50 31 96.9% 194,400 9.2% 237,250 58.2% 237,250 58.2% 181 Apr-10 1 0% 12 200% 0.08 21 21.00 22 97.2% 196,300 7.9% 320,500 83.1% 320,500 83.1% 183 May-10 3 -25% 8 33% 0.38 23 7.67 47 97.9% 195,700 9.5% 290,000 43.9% 270,333 22.3% 182 Jun-10 3 50% 1 -75% 3.00 15 5.00 67 97.1% 193,500 6.0% 179,500 -3.8% 181,000 -2.9% 180 Jul-10 1 -50% 5 0% 0.20 10 10.00 85 97.8% 190,800 1.5% 174,500 -41.1% 174,500 -41.1% 177 Aug-10 1 -75% 4 0% 0.25 9 9.00 23 96.9% 189,200 0.1% 147,750 -26.9% 147,750 -29.7% 176 Sep-10 5 0% 4 0% 1.25 8 1.60 51 95.5% 186,700 -0.4% 180,000 -2.7% 239,500 15.9% 174 Oct-10 - 2 -50% 10 181,100 -4.3% 168 Nov-10 1 -67% 3 200% 0.33 8 8.00 43 96.7% 178,400 -3.7% 145,000 -18.5% 145,000 -29.0% 166 Dec-10 3 5 400% 0.60 7 2.33 68 90.1% 174,900 -8.5% 174,000 221,333 163 2010 24 0% 61 36% 0.39 11 7.22 49 95.7% 188,758 2.2% 185,500 -0.3% 231,406 10.4% 176 Jan-11 1 0% 3 -50% 0.33 8 8.00 39 96.9% 171,600 -10.1% 155,000 -15.3% 155,000 -15.3% 160 Feb-11 - 2 -50% 10 175,000 -9.5% 163 Mar-11 1 -50% 3 -57% 0.33 12 12.00 97 95.5% 171,600 -11.7% 143,000 -39.7% 143,000 -39.7% 160 Apr-11 1 0% 5 -58% 0.20 13 13.00 93 95.9% 178,000 -9.3% 230,000 -28.2% 230,000 -28.2% 166 May-11 3 0% 8 0% 0.38 14 4.67 69 95.2% 176,200 -10.0% 158,000 -45.5% 171,233 -36.7% 164 Jun-11 5 67% 9 800% 0.56 17 3.40 54 95.4% 179,900 -7.0% 300,000 67.1% 255,700 41.3% 167 Jul-11 3 200% 2 -60% 1.50 14 4.67 63 97.2% 179,600 -5.9% 231,500 32.7% 265,500 52.1% 167 Aug-11 3 200% - 8 2.67 102 95.6% 182,400 -3.6% 144,700 -2.1% 180,900 22.4% 170 Sep-11 1 -80% 5 25% 0.20 7 7.00 97 95.9% 182,300 -2.4% 115,000 -36.1% 115,000 -52.0% 170 Oct-11 1 5 150% 0.20 8 8.00 59 99.5% 180,300 -0.4% 278,500 278,500 168 Nov-11 1 0% - 4 4.00 53 97.6% 181,100 1.5% 200,000 37.9% 200,000 37.9% 168 Dec-11 2 -33% 1 -80% 2.00 2 1.00 60 95.0% 187,200 7.0% 140,000 -19.5% 140,000 -36.7% 174 2011 22 -8% 43 -30% 0.51 10 6.22 70 96.1% 178,767 -5.3% 166,500 -10.2% 206,041 -11.0% 166 Jan-12 2 100% 5 67% 0.40 4 2.00 62 93.4% 183,600 7.0% 179,750 16.0% 179,750 16.0% 171 Feb-12 - 2 0% 6 183,800 5.0% 171 Mar-12 2 100% 4 33% 0.50 7 3.50 34 88.6% 181,900 6.0% 264,000 84.6% 264,000 84.6% 169 Apr-12 3 200% 2 -60% 1.50 5 1.67 47 93.2% 184,300 3.5% 140,000 -39.1% 184,833 -19.6% 171 May-12 - 1 -88% 5 187,500 6.4% 174 Jun-12 1 -80% 4 -56% 0.25 7 7.00 53 97.8% 187,900 4.4% 322,500 7.5% 322,500 26.1% 175 Jul-12 6 100% 4 100% 1.50 5 0.83 42 97.3% 185,000 3.0% 278,000 20.1% 259,333 -2.3% 172 Aug-12 4 33% 5 0.80 5 1.25 10 97.7% 183,200 0.4% 253,500 75.2% 243,750 34.7% 170 Sep-12 2 100% 4 -20% 0.50 4 2.00 39 95.6% 179,700 -1.4% 246,000 113.9% 246,000 113.9% 167 Oct-12 1 0% 3 -40% 0.33 7 7.00 12 100.0% 183,500 1.8% 282,000 1.3% 282,000 1.3% 171 Nov-12 2 100% 2 1.00 7 3.50 53 96.8% 181,500 0.2% 219,750 9.9% 219,750 9.9% 169 Dec-12 2 0% 1 0% 2.00 3 1.50 83 97.4% 179,600 -4.1% 192,000 37.1% 192,000 37.1% 167 2012 25 14% 37 -14% 0.68 5 3.03 42 95.8% 183,458 2.6% 250,000 50.2% 235,720 14.4% 171 Jan-13 - 2 -60% 4 178,700 -2.7% 166 Feb-13 3 5 150% 0.60 5 1.67 29 96.2% 181,300 -1.4% 179,000 176,333 169 Mar-13 4 100% 8 100% 0.50 8 2.00 15 98.7% 184,000 1.2% 187,250 -29.1% 211,375 -19.9% 171 Apr-13 4 33% 5 150% 0.80 9 2.25 27 98.4% 187,600 1.8% 172,300 23.1% 171,625 -7.1% 174 May-13 7 4 300% 1.75 4 0.57 48 97.2% 193,100 3.0% 231,500 254,714 180 Jun-13 3 200% 4 0% 0.75 4 1.33 46 97.0% 193,900 3.2% 172,000 -46.7% 255,000 -20.9% 180 Jul-13 7 17% 4 0% 1.75 2 0.29 41 96.9% 191,300 3.4% 162,000 -41.7% 172,571 -33.5% 178 Aug-13 1 -75% 6 20% 0.17 5 5.00 16 97.2% 189,100 3.2% 170,000 -32.9% 170,000 -30.3% 176 Sep-13 6 200% 4 0% 1.50 3 0.50 25 97.6% 186,800 4.0% 172,750 -29.8% 205,866 -16.3% 174 Oct-13 4 300% 3 0% 1.33 2 0.50 35 97.0% 187,500 2.2% 157,500 -44.1% 194,875 -30.9% 174 Nov-13 2 0% 4 100% 0.50 3 1.50 16 95.0% 186,100 2.5% 166,250 -24.3% 166,250 -24.3% 173 Dec-13 2 0% 2 100% 1.00 4 2.00 40 97.7% 186,900 4.1% 251,500 31.0% 251,500 31.0% 174 2013 43 72% 51 38% 0.84 4 1.60 33 97.3% 187,192 2.0% 170,000 -32.0% 205,516 -12.8% 174 Jan-14 4 5 150% 0.80 3 0.75 25 99.3% 189,900 6.3% 252,961 255,656 177 Feb-14 3 0% 4 -20% 0.75 5 1.67 14 98.7% 195,400 7.8% 326,000 82.1% 270,500 53.4% 182 Mar-14 5 25% 2 -75% 2.50 2 0.40 39 96.6% 202,800 10.2% 268,000 43.1% 268,100 26.8% 189 Apr-14 1 -75% 1 -80% 1.00 2 2.00 40 95.5% 204,000 8.7% 210,000 21.9% 210,000 22.4% 190 May-14 1 -86% 2 -50% 0.50 1 1.00 29 97.5% 206,300 6.8% 190,000 -17.9% 190,000 -25.4% 192 Jun-14 3 0% 3 -25% 1.00 2 0.67 20 96.7% 204,300 5.4% 160,000 -7.0% 204,667 -19.7% 190 Jul-14 2 -71% 5 25% 0.40 3 1.50 25 98.7% 207,800 8.6% 227,000 40.1% 227,000 31.5% 193 Aug-14 1 0% 4 -33% 0.25 5 5.00 23 96.4% 206,800 9.4% 217,000 27.6% 217,000 27.6% 192 Sep-14 8 33% 5 25% 1.60 3 0.38 29 97.6% 207,500 11.1% 221,250 28.1% 257,125 24.9% 193 Oct-14 3 -25% 6 100% 0.50 5 1.67 40 98.5% 206,000 9.9% 260,000 65.1% 296,633 52.2% 192 Nov-14 1 -50% 5 25% 0.20 8 8.00 45 96.1% 213,700 14.8% 148,900 -10.4% 148,900 -10.4% 199 Dec-14 2 0% 1 -50% 2.00 4 2.00 24 95.2% 214,600 14.8% 173,000 -31.2% 173,000 -31.2% 200 2014 34 -21% 43 -16% 0.79 4 2.09 29 97.6% 204,925 9.5% 220,750 29.9% 244,159 18.8% 191
  • 11. APARTMENT ACADIA (215) Sales Y/Y% New Listings Y/Y% S/NL Ratio Inventory Months of Supply DOM SP/LP Benchmark Price Y/Y% Median Price Y/Y% Average Price Y/Y% Index Jan-15 - 8 60% 11 213,500 12.4% 199 Feb-15 4 33% 1 -75% 4.00 7 1.75 34 98.6% 210,000 7.5% 183,000 -43.9% 227,875 -15.8% 195 Mar-15 3 -40% 4 100% 0.75 5 1.67 56 94.0% 210,800 3.9% 167,000 -37.7% 181,667 -32.2% 196 Apr-15 4 300% 5 400% 0.80 6 1.50 28 97.5% 210,900 3.4% 199,000 -5.2% 226,500 7.9% 196 May-15 1 0% 3 50% 0.33 7 7.00 11 98.5% 208,100 0.9% 160,500 -15.5% 160,500 -15.5% 194 Jun-15 1 -67% 5 67% 0.20 7 7.00 12 97.9% 209,000 2.3% 318,000 98.8% 318,000 55.4% 194 Jul-15 2 0% 3 -40% 0.67 9 4.50 49 97.2% 207,000 -0.4% 192,000 -15.4% 192,000 -15.4% 193 Aug-15 2 100% 2 -50% 1.00 4 2.00 32 97.2% 204,100 -1.3% 180,800 -16.7% 180,800 -16.7% 190 Sep-15 2 -75% 4 -20% 0.50 4 2.00 68 97.6% 200,600 -3.3% 243,500 10.1% 243,500 -5.3% 187 Oct-15 1 -67% 2 -67% 0.50 4 4.00 28 97.0% 199,300 -3.3% 189,000 -27.3% 189,000 -36.3% 185 Nov-15 3 200% 1 -80% 3.00 3 1.00 47 92.0% 200,100 -6.4% 250,000 67.9% 223,667 50.2% 186 Dec-15 - - 3 198,300 -7.6% 184 2015 23 -32% 38 -12% 0.61 6 3.24 39 96.5% 205,975 0.5% 189,000 -14.4% 214,504 -12.1% 192 Jan-16 - 5 -38% 6 196,600 -7.9% 183 Feb-16 - 3 200% 9 194,900 -7.2% 181 Mar-16 5 67% 4 0% 1.25 8 1.60 37 97.6% 193,400 -8.3% 205,000 22.8% 252,900 39.2% 180 Apr-16 4 0% 4 -20% 1.00 7 1.75 53 96.5% 195,700 -7.2% 249,000 25.1% 256,225 13.1% 182 May-16 1 0% 3 0% 0.33 7 7.00 113 98.5% 194,100 -6.7% 186,000 15.9% 186,000 15.9% 181 Jun-16 2 100% 3 -40% 0.67 7 3.50 44 96.4% 195,700 -6.4% 231,300 -27.3% 231,300 -27.3% 182 Jul-16 2 0% 4 33% 0.50 6 3.00 36 96.3% 196,500 -5.1% 204,000 6.3% 204,000 6.3% 183 Aug-16 - 6 200% 11 191,100 -6.4% 178 Sep-16 2 0% 3 -25% 0.67 10 5.00 74 95.5% 192,600 -4.0% 169,500 -30.4% 169,500 -30.4% 179 Oct-16 1 0% 4 100% 0.25 12 12.00 85 96.4% 191,400 -4.0% 395,000 109.0% 395,000 109.0% 178 Nov-16 2 -33% 4 300% 0.50 12 6.00 46 98.1% 186,700 -6.7% 255,000 2.0% 255,000 14.0% 174 Dec-16 - 1 8 178,200 -10.1% 166 2016 19 -17% 44 16% 0.43 9 4.98 52 96.9% 192,242 -6.7% 200,000 5.8% 241,579 12.6% 179 Jan-17 2 5 0% 0.40 8 4.00 53 96.8% 176,500 -10.2% 212,500 212,500 164 Feb-17 3 6 100% 0.50 9 3.00 43 94.3% 175,600 -9.9% 207,500 193,333 163 Mar-17 2 -60% 7 75% 0.29 13 6.50 15 97.4% 179,900 -7.0% 223,000 8.8% 223,000 -11.8% 167 Apr-17 4 0% 6 50% 0.67 13 3.25 45 97.3% 186,500 -4.7% 257,500 3.4% 275,500 7.5% 173 May-17 3 200% 8 167% 0.38 14 4.67 26 97.9% 184,700 -4.8% 160,000 -14.0% 156,333 -15.9% 172 Jun-17 2 0% 6 100% 0.33 17 8.50 54 96.8% 182,300 -6.8% 149,000 -35.6% 149,000 -35.6% 170 Jul-17 3 50% 7 75% 0.43 16 5.33 48 98.0% 181,700 -7.5% 366,000 79.4% 301,500 47.8% 169 Aug-17 4 5 -17% 0.80 15 3.75 86 97.5% 181,900 -4.8% 262,500 272,750 169 Sep-17 3 50% 7 133% 0.43 15 5.00 33 97.2% 181,500 -5.8% 332,500 96.2% 330,000 94.7% 169 Oct-17 5 400% 2 -50% 2.50 12 2.40 47 95.4% 179,900 -6.0% 165,500 -58.1% 179,613 -54.5% 167 Nov-17 - 6 50% 14 172,800 -7.4% 161 Dec-17 2 3 200% 0.67 12 6.00 153 96.1% 170,800 -4.2% 253,500 253,500 159 2017 33 74% 68 55% 0.49 13 4.76 53 96.8% 179,508 -6.6% 197,000 -1.5% 233,653 -3.3% 167 Jan-18 2 0% 7 40% 0.29 11 5.50 42 95.3% 169,400 -4.0% 173,750 -18.2% 173,750 -18.2% 158 Feb-18 1 -67% 4 -33% 0.25 15 15.00 81 92.8% 169,700 -3.4% 255,000 22.9% 255,000 31.9% 158 Mar-18 1 -50% 2 -71% 0.50 14 14.00 313 94.5% 173,800 -3.4% 208,000 -6.7% 208,000 -6.7% 162 Apr-18 - 4 -33% 15 176,400 -5.4% 164 May-18 3 0% 8 0% 0.38 17 5.67 89 96.4% 175,700 -4.9% 234,000 46.2% 255,500 63.4% 163 Jun-18 2 0% 4 -33% 0.50 17 8.50 30 93.9% 181,000 -0.7% 131,000 -12.1% 131,000 -12.1% 168 Jul-18 3 0% 4 -43% 0.75 15 5.00 55 95.0% 177,700 -2.2% 165,000 -54.9% 177,300 -41.2% 165 Aug-18 2 -50% 5 0% 0.40 16 8.00 191 97.3% 180,800 -0.6% 197,500 -24.8% 197,500 -27.6% 168 Sep-18 4 33% 3 -57% 1.33 9 2.25 97 97.1% 180,900 -0.3% 178,450 -46.3% 197,725 -40.1% 168 Oct-18 4 -20% 2 0% 2.00 5 1.25 81 96.1% 181,400 0.8% 277,000 67.4% 259,950 44.7% 169 Nov-18 2 1 -83% 2.00 3 1.50 144 94.5% 175,700 1.7% 145,000 145,000 163 Dec-18 1 -50% 1 -67% 1.00 2 2.00 106 94.1% 174,100 1.9% 320,000 26.2% 320,000 26.2% 162 2018 25 -24% 45 -34% 0.56 12 6.24 98 95.7% 176,383 -1.7% 202,000 2.5% 208,264 -10.9% 164 Jan-19 1 -50% 3 -57% 0.33 4 4.00 14 98.9% 175,800 3.8% 178,000 2.4% 178,000 2.4% 164 Feb-19 1 0% 3 -25% 0.33 5 5.00 21 97.3% 172,300 1.5% 267,000 4.7% 267,000 4.7% 160 Mar-19 - 4 100% 0.00 9 176,400 1.5% 164 Apr-19 - 4 0% 0.00 13 172,100 -2.4% 160 May-19 - 2 -75% 0.00 14 177,200 0.9% 165 Jun-19 Jul-19 Aug-19 Sep-19 Oct-19 Nov-19 Dec-19 2019 2 -92% 16 -64% 0.13 9 4.50 18 97.9% 174,760 -0.9% 222,500 10.1% 222,500 6.8% 163
  • 12. APARTMENT ACADIA (215) -20% -15% -10% -5% 0% 5% 10% 15% 20% - 1 2 3 4 5 6 7 8 9 MONTHS OF SUPPLY AND PRICE CHANGE Months of Supply trend (12 M) Benchmark price y/y % Change Source: CREB® 0 5 10 15 20 25 0% 20% 40% 60% 80% 100% 120% 140% SALES TO NEW LISTINGS RATIO AND INVENTORY Inventory Sales to New listings ratio trend (12 M) Inventory Trend (12 M) Source: CREB® 0 50,000 100,000 150,000 200,000 250,000 300,000 350,000 400,000 450,000 PRICE COMPARISON Average Median Benchmark Source: CREB® - 20 40 60 80 100 120 140 DAYS ON MARKET Days on market trend (12 M) Source: CREB® 166,000 168,000 170,000 172,000 174,000 176,000 178,000 180,000 182,000 184,000 0 2 4 6 8 10 12 14 16 18 May. '18 Jun. '18 Jul. '18 Aug. '18 Sep. '18 Oct. '18 Nov. '18 Dec. '18 Jan. '19 Feb. '19 Mar. '19 Apr. '19 May. '19 INVENTORY, SALES AND PRICE Inventory Sales Benchmark Price Source: CREB® 0 1 2 3 4 5 <$200,000 $200,000 - $299,999 $300,000 - $399,999 $400,000 - $499,999 $500,000 - $599,999 $600,000 - $699,999 $700,000 - 999,999 $1,000,000+ MONTHS OF SUPPLY BY PRICE RANGE May-16 May-17 May-18 May-19 Source: CREB® May
  • 13. APARTMENT ACADIA (215) - 1 2 3 4 5 6 Jan. Feb. Mar. Apr. May Jun. Jul. Aug. Sept. Oct. Nov. Dec. SALES COMPARISON 2019 2018 2017 2016 Source: CREB® 0 1 2 3 4 5 6 7 8 <$200,000 $200,000 - $299,999 $300,000 - $399,999 $400,000 - $499,999 $500,000 - $599,999 $600,000 - $699,999 $700,000 - 999,999 $1,000,000+ YTD SALES BY PRICE RANGE YTD-2016 YTD-2017 YTD-2018 YTD-2019 Source: CREB® YTD-MAY 0 5 10 15 20 25 <$200,000 $200,000 - $299,999 $300,000 - $399,999 $400,000 - $499,999 $500,000 - $599,999 $600,000 - $699,999 $700,000 - 999,999 $1,000,000+ YTD NEW LISTINGS BY PRICE RANGE YTD-2016 YTD-2017 YTD-2018 YTD-2019 Source: CREB® YTD-MAY 0 1 2 3 4 5 6 7 8 9 10 11 12 13 14 <$200,000 $200,000 - $299,999 $300,000 - $399,999 $400,000 - $499,999 $500,000 - $599,999 $600,000 - $699,999 $700,000 - 999,999 $1,000,000+ INVENTORY BY PRICE RANGE May-16 May-17 May-18 May-19 Source: CREB® May - 1 2 3 4 5 6 7 8 9 Jan. Feb. Mar. Apr. May Jun. Jul. Aug. Sept. Oct. Nov. Dec. NEW LISTINGS COMPARISON 2019 2018 2017 2016 Source: CREB® - 2 4 6 8 10 12 14 16 18 Jan. Feb. Mar. Apr. May Jun. Jul. Aug. Sept. Oct. Nov. Dec. INVENTORY COMPARISON 2019 2018 2017 2016 Source: CREB®
  • 14. SEMI DETACHED ACADIA (215) Sales Y/Y% New Listings Y/Y% S/NL Ratio Inventory Months of Supply DOM SP/LP Benchmark Price Y/Y% Median Price Y/Y% Average Price Y/Y% Index Share of Sales Condo Jan-10 1 1 1.00 0 0.00 9 98.4% 295,000 295,000 0% Feb-10 1 1 0% 1.00 0 0.00 3 98.4% 245,000 245,000 0% Mar-10 - 1 0 Apr-10 - - 0 May-10 1 0% 1 0% 1.00 1 1.00 56 97.8% 313,000 19.5% 313,000 19.5% 0% Jun-10 - - 1 Jul-10 - 1 1 Aug-10 1 - 1 1.00 20 96.2% 250,000 250,000 0% Sep-10 1 1 1.00 0 0.00 18 94.3% 245,000 245,000 0% Oct-10 - - 0 Nov-10 - - 0 Dec-10 - - 0 2010 5 25% 6 0% 0.83 0 0.40 21 97.1% 250,000 4.8% 269,600 14.1% 0% Jan-11 - - 0 Feb-11 - - 0 Mar-11 - - 0 Apr-11 - 2 2 May-11 - - 2 Jun-11 - - 2 Jul-11 - - 1 Aug-11 - 1 2 Sep-11 - - 1 Oct-11 - - 0 Nov-11 - 1 1 Dec-11 - 1 2 2011 - 5 -17% 1 Jan-12 - 2 4 Feb-12 - - 4 Mar-12 1 1 1.00 3 3.00 67 97.8% 313,000 313,000 0% Apr-12 - - 2 May-12 1 3 0.33 3 3.00 15 97.6% 288,000 288,000 0% Jun-12 1 5 0.20 3 3.00 19 93.5% 290,000 290,000 0% Jul-12 3 - 1 0.33 32 97.8% 278,000 275,300 0% Aug-12 3 1 0% 3.00 0 0.00 60 95.9% 251,000 252,000 33% Sep-12 - - 0 Oct-12 - - 0 Nov-12 - - 0 Dec-12 - - 0 2012 9 12 140% 0.75 2 1.87 42 96.7% 288,000 274,767 11% Jan-13 - - 0 Feb-13 - - 0 Mar-13 - - 0 Apr-13 - - 0 May-13 - 1 -67% 1 Jun-13 1 0% - 0 0.00 9 100.0% 229,000 -21.0% 229,000 -21.0% 0% Jul-13 - - 0 Aug-13 - - 0 Sep-13 - 1 1 Oct-13 - - 1 Nov-13 - - 1 Dec-13 - - 0 2013 1 -89% 2 -83% 0.50 0 0.00 9 100.0% 229,000 -20.5% 229,000 -16.7% 0% Jan-14 - - 0 Feb-14 - - 0 Mar-14 1 1 1.00 0 0.00 2 103.3% 345,900 345,900 0% Apr-14 - 2 1 May-14 2 - 0 0.00 15 97.7% 320,500 320,500 0% Jun-14 1 0% 1 1.00 0 0.00 12 103.5% 419,004 83.0% 419,004 83.0% 0% Jul-14 - - 0 Aug-14 - 1 1 Sep-14 1 - 0 0.00 31 98.7% 380,000 380,000 0% Oct-14 - - 0 Nov-14 - 1 1 Dec-14 - - 1 2014 5 400% 6 200% 0.83 0 0.00 15 100.3% 345,900 51.0% 357,181 56.0% 0%
  • 15. SEMI DETACHED ACADIA (215) Sales Y/Y% New Listings Y/Y% S/NL Ratio Inventory Months of Supply DOM SP/LP Benchmark Price Y/Y% Median Price Y/Y% Average Price Y/Y% Index Share of Sales Condo Jan-15 1 1 1.00 1 1.00 17 97.4% 340,000 340,000 0% Feb-15 1 - 0 0.00 89 94.7% 330,400 330,400 0% Mar-15 - - 0 Apr-15 1 1 -50% 1.00 0 0.00 13 99.1% 376,600 376,600 0% May-15 - 1 0 Jun-15 1 0% - 0 0.00 18 98.5% 271,000 -35.3% 271,000 -35.3% 0% Jul-15 1 1 1.00 0 0.00 22 98.5% 322,000 322,000 0% Aug-15 - 1 0% 1 Sep-15 2 100% 1 2.00 0 0.00 38 97.6% 348,750 -8.2% 348,750 -8.2% 0% Oct-15 - 1 1 Nov-15 2 2 100% 1.00 1 0.50 24 96.7% 374,250 374,250 0% Dec-15 - - 1 2015 9 80% 9 50% 1.00 0 0.21 31 97.4% 340,000 -1.7% 342,889 -4.0% 0% Jan-16 - - 1 Feb-16 - - 1 Mar-16 - - 0 Apr-16 - 1 0% 1 May-16 - 1 0% 2 Jun-16 1 0% - 1 1.00 72 97.1% 267,000 -1.5% 267,000 -1.5% 0% Jul-16 - - 0 Aug-16 - - 0 Sep-16 - - 0 Oct-16 - 1 0% 1 Nov-16 - 1 -50% 2 Dec-16 - 1 3 2016 1 -89% 5 -44% 0.20 1 1.00 72 97.1% 267,000 -21.5% 267,000 -22.1% 0% Jan-17 1 1 1.00 2 2.00 88 96.0% 257,000 257,000 0% Feb-17 - 1 1 Mar-17 2 3 0.67 1 0.50 15 101.3% 309,000 309,000 0% Apr-17 - - 1 May-17 - 1 0% 1 Jun-17 1 0% 1 1.00 2 2.00 82 95.1% 303,500 13.7% 303,500 13.7% 0% Jul-17 - - 1 Aug-17 1 - 0 0.00 95 98.6% 345,000 345,000 0% Sep-17 - 2 2 Oct-17 1 - 1 1.00 19 87.2% 170,000 170,000 0% Nov-17 1 - 0 0.00 53 96.8% 324,200 324,200 0% Dec-17 - - 0 2017 7 600% 9 80% 0.78 1 0.92 52 97.2% 303,500 13.7% 288,243 8.0% 0% Jan-18 - 1 0% 1 Feb-18 1 - 0 0.00 22 96.2% 375,000 375,000 0% Mar-18 - 1 -67% 1 Apr-18 - - 1 May-18 - - 1 Jun-18 - - 1 Jul-18 - 1 1 Aug-18 2 100% 2 1.00 2 1.00 13 96.0% 263,500 -23.6% 263,500 -23.6% 0% Sep-18 - - 1 Oct-18 2 100% - 0 0.00 140 96.6% 323,500 90.3% 323,500 90.3% 0% Nov-18 - - 0 Dec-18 - - 0 2018 5 -29% 5 -44% 1.00 1 0.33 65 96.3% 322,000 6.1% 309,800 7.5% 0% Jan-19 - 1 0% 0.00 1 Feb-19 1 0% - 0 0.00 26 96.9% 327,000 -12.8% 327,000 -12.8% 0% Mar-19 - - 0 Apr-19 - - 0 May-19 - 1 0.00 1 Jun-19 Jul-19 Aug-19 Sep-19 Oct-19 Nov-19 Dec-19 2019 1 -80% 2 -60% 0.50 0 0.00 26 96.9% 327,000 1.6% 327,000 5.6% 0%
  • 16. SEMI DETACHED ACADIA (215) - 1 2 3 4 MONTHS OF SUPPLY AND PRICE CHANGE Months of Supply trend (12 M) Benchmark price y/y % Change Source: CREB® 0 1 2 3 4 5 0% 20% 40% 60% 80% 100% 120% 140% 160% SALES TO NEW LISTINGS RATIO AND INVENTORY Inventory Sales to New listings ratio trend (12 M) Inventory Trend (12 M) Source: CREB® 100,000 150,000 200,000 250,000 300,000 350,000 400,000 450,000 PRICE COMPARISON Average Median Benchmark Source: CREB® - 10 20 30 40 50 60 70 80 90 DAYS ON MARKET Days on market trend (12 M) Source: CREB® 0 0 0 1 1 1 1 0 1 2 3 May. '18 Jun. '18 Jul. '18 Aug. '18 Sep. '18 Oct. '18 Nov. '18 Dec. '18 Jan. '19 Feb. '19 Mar. '19 Apr. '19 May. '19 INVENTORY, SALES AND PRICE Inventory Sales Benchmark Price Source: CREB® 0 1 <$200,000 $200,000 - $299,999 $300,000 - $399,999 $400,000 - $499,999 $500,000 - $599,999 $600,000 - $699,999 $700,000 - 999,999 $1,000,000+ MONTHS OF SUPPLY BY PRICE RANGE May-16 May-17 May-18 May-19 Source: CREB® May
  • 17. SEMI DETACHED ACADIA (215) - 1 2 3 Jan. Feb. Mar. Apr. May Jun. Jul. Aug. Sept. Oct. Nov. Dec. SEMI-DETACHED SALES COMPARISON 2019 2018 2017 2016 Source: CREB® 0 1 1 2 2 3 <$200,000 $200,000 - $299,999 $300,000 - $399,999 $400,000 - $499,999 $500,000 - $599,999 $600,000 - $699,999 $700,000 - 999,999 $1,000,000+ YTD SALES BY PRICE RANGE YTD-2016 YTD-2017 YTD-2018 YTD-2019 Source: CREB® YTD-MAY 0 1 1 2 2 3 3 4 <$200,000 $200,000 - $299,999 $300,000 - $399,999 $400,000 - $499,999 $500,000 - $599,999 $600,000 - $699,999 $700,000 - 999,999 $1,000,000+ YTD NEW LISTINGS BY PRICE RANGE YTD-2016 YTD-2017 YTD-2018 YTD-2019 Source: CREB® YTD-MAY 0 1 2 <$200,000 $200,000 - $299,999 $300,000 - $399,999 $400,000 - $499,999 $500,000 - $599,999 $600,000 - $699,999 $700,000 - 999,999 $1,000,000+ INVENTORY BY PRICE RANGE May-16 May-17 May-18 May-19 Source: CREB® May - 1 2 3 4 Jan. Feb. Mar. Apr. May Jun. Jul. Aug. Sept. Oct. Nov. Dec. SEMI-DETACHED NEW LISTINGS COMPARISON 2019 2018 2017 2016 Source: CREB® - 1 2 3 4 Jan. Feb. Mar. Apr. May Jun. Jul. Aug. Sept. Oct. Nov. Dec. SEMI-DETACHED INVENTORY COMPARISON 2019 2018 2017 2016 Source: CREB®
  • 18. ROW ACADIA (215) Sales Y/Y% New Listings Y/Y% S/NL Ratio Inventory Months of Supply DOM SP/LP Benchmark Price Y/Y% Median Price Y/Y% Average Price Y/Y% Index Share of Sales Condo Jan-10 1 -50% 2 100% 0.50 5 5.00 16 97.9% 222,200 -4.1% 230,000 5.3% 230,000 5.3% 178 100% Feb-10 2 0% 1 -50% 2.00 3 1.50 67 96.1% 221,300 -2.3% 240,175 10.2% 240,175 10.2% 177 100% Mar-10 1 0% 3 50% 0.33 4 4.00 149 95.5% 217,000 -2.4% 210,000 -2.8% 210,000 -2.8% 174 100% Apr-10 2 -33% - 3 1.50 36 96.2% 228,800 4.0% 259,250 23.5% 259,250 18.3% 183 100% May-10 1 -50% 2 0% 0.50 2 2.00 14 97.4% 227,600 5.0% 265,000 19.9% 265,000 19.9% 182 100% Jun-10 1 -50% 5 67% 0.20 4 4.00 23 96.0% 231,300 6.6% 225,500 6.2% 225,500 6.2% 185 100% Jul-10 - 4 33% 7 233,200 7.5% 186 Aug-10 2 0% 4 300% 0.50 6 3.00 13 99.6% 229,700 5.9% 225,250 -7.3% 225,250 -7.3% 184 100% Sep-10 1 0% 1 -67% 1.00 6 6.00 11 96.0% 227,800 4.1% 235,000 0.0% 235,000 0.0% 182 100% Oct-10 2 100% 4 100% 0.50 5 2.50 32 97.9% 229,100 3.1% 221,750 2.0% 221,750 2.0% 183 100% Nov-10 1 -50% 2 -33% 0.50 5 5.00 18 96.3% 228,300 2.2% 255,000 7.1% 255,000 7.1% 183 100% Dec-10 1 0% 1 0% 1.00 3 3.00 7 98.1% 233,300 3.3% 279,500 37.7% 279,500 37.7% 187 100% 2010 15 -29% 29 16% 0.52 4 3.41 35 97.1% 227,467 2.7% 230,000 5.7% 239,523 6.1% 182 100% Jan-11 - 1 -50% 2 233,800 5.2% 187 Feb-11 2 0% - 1 0.50 50 96.8% 225,400 1.9% 295,000 22.8% 295,000 22.8% 180 100% Mar-11 - - 1 224,300 3.4% 179 Apr-11 - 1 1 223,400 -2.4% 179 May-11 1 0% 1 -50% 1.00 1 1.00 41 95.5% 220,300 -3.2% 209,000 -21.1% 209,000 -21.1% 176 100% Jun-11 - 2 -60% 2 220,100 -4.8% 176 Jul-11 2 3 -25% 0.67 3 1.50 33 96.3% 222,800 -4.5% 262,350 262,350 178 100% Aug-11 - 2 -50% 5 221,200 -3.7% 177 Sep-11 1 0% 2 100% 0.50 6 6.00 19 96.3% 219,400 -3.7% 250,000 6.4% 250,000 6.4% 175 100% Oct-11 1 -50% 1 -75% 1.00 5 5.00 27 97.3% 221,100 -3.5% 213,000 -3.9% 213,000 -3.9% 177 100% Nov-11 - 2 0% 5 222,100 -2.7% 178 Dec-11 1 0% 1 0% 1.00 4 4.00 31 99.1% 220,800 -5.4% 267,500 -4.3% 267,500 -4.3% 177 100% 2011 8 -47% 16 -45% 0.50 3 3.00 35 96.8% 222,892 -2.0% 261,150 13.5% 256,775 7.2% 178 100% Jan-12 - 1 0% 3 216,700 -7.3% 173 Feb-12 - 2 4 216,900 -3.8% 173 Mar-12 3 4 0.75 4 1.33 22 97.0% 212,800 -5.1% 279,000 249,833 170 100% Apr-12 1 2 100% 0.50 1 1.00 31 98.0% 215,900 -3.4% 240,000 240,000 173 100% May-12 3 200% 4 300% 0.75 4 1.33 37 97.8% 219,600 -0.3% 235,000 12.4% 227,667 8.9% 176 100% Jun-12 1 - 4 4.00 13 96.6% 219,400 -0.3% 280,000 280,000 175 100% Jul-12 1 -50% 3 0% 0.33 4 4.00 77 97.5% 223,600 0.4% 258,000 -1.7% 258,000 -1.7% 179 100% Aug-12 2 2 0% 1.00 4 2.00 64 97.9% 221,700 0.2% 211,500 211,500 177 100% Sep-12 3 200% 1 -50% 3.00 2 0.67 30 97.5% 220,800 0.6% 213,000 -14.8% 239,833 -4.1% 177 100% Oct-12 - 2 100% 3 221,400 0.1% 177 Nov-12 3 - 0 0.00 82 95.5% 219,400 -1.2% 226,500 228,950 175 100% Dec-12 - 1 0% 1 218,300 -1.1% 175 2012 17 113% 22 38% 0.77 3 1.79 45 97.1% 218,875 -1.8% 235,000 -10.0% 237,638 -7.5% 175 100% Jan-13 - 4 300% 5 222,600 2.7% 178 Feb-13 3 4 100% 0.75 4 1.33 26 96.5% 220,300 1.6% 234,900 216,650 176 100% Mar-13 2 -33% - 3 1.50 28 97.2% 223,900 5.2% 220,000 -21.1% 220,000 -11.9% 179 100% Apr-13 - 1 -50% 2 227,200 5.2% 182 May-13 - 2 -50% 4 227,400 3.6% 182 Jun-13 2 100% 4 0.50 6 3.00 29 96.5% 231,300 5.4% 221,750 -20.8% 221,750 -20.8% 185 100% Jul-13 6 500% 2 -33% 3.00 0 0.00 38 96.8% 230,200 3.0% 235,500 -8.7% 231,500 -10.3% 184 100% Aug-13 2 0% 3 50% 0.67 1 0.50 107 97.2% 235,900 6.4% 215,760 2.0% 215,760 2.0% 189 100% Sep-13 3 0% 3 200% 1.00 2 0.67 30 97.2% 238,600 8.1% 228,000 7.0% 250,667 4.5% 191 100% Oct-13 2 2 0% 1.00 2 1.00 12 98.3% 234,600 6.0% 280,000 280,000 188 100% Nov-13 1 -67% - 1 1.00 37 98.4% 235,400 7.3% 221,000 -2.4% 221,000 -3.5% 188 100% Dec-13 - 2 100% 2 240,600 10.2% 192 2013 21 24% 27 23% 0.78 3 1.13 37 97.1% 230,667 5.4% 225,000 -4.3% 232,713 -2.1% 184 100% Jan-14 1 - 1 1.00 30 95.0% 239,100 7.4% 210,000 210,000 191 100% Feb-14 - 2 -50% 2 240,800 9.3% 193 Mar-14 2 0% 1 2.00 2 1.00 37 96.1% 245,100 9.5% 273,500 24.3% 273,500 24.3% 196 100% Apr-14 2 2 100% 1.00 2 1.00 19 99.0% 251,500 10.7% 245,950 245,950 201 100% May-14 2 6 200% 0.33 5 2.50 78 99.6% 256,500 12.8% 303,000 303,000 205 100% Jun-14 6 200% 4 0% 1.50 2 0.33 20 98.2% 257,700 11.4% 255,250 15.1% 273,583 23.4% 206 100% Jul-14 1 -83% 2 0% 0.50 4 4.00 38 97.0% 256,700 11.5% 318,000 35.0% 318,000 37.4% 205 100% Aug-14 1 -50% 4 33% 0.25 5 5.00 35 100.0% 260,600 10.5% 225,000 4.3% 225,000 4.3% 208 100% Sep-14 5 67% 4 33% 1.25 3 0.60 28 97.8% 259,000 8.5% 256,000 12.3% 280,060 11.7% 207 100% Oct-14 2 0% 5 150% 0.40 5 2.50 35 96.2% 256,300 9.2% 286,000 2.1% 286,000 2.1% 205 100% Nov-14 4 300% 5 0.80 6 1.50 32 97.5% 257,700 9.5% 249,250 12.8% 258,250 16.9% 206 100% Dec-14 4 2 0% 2.00 4 1.00 39 96.9% 258,500 7.4% 235,750 254,750 207 100% 2014 30 43% 37 37% 0.81 3 1.86 33 97.6% 253,292 9.8% 255,000 13.3% 268,790 15.5% 202 100%
  • 19. ROW ACADIA (215) Sales Y/Y% New Listings Y/Y% S/NL Ratio Inventory Months of Supply DOM SP/LP Benchmark Price Y/Y% Median Price Y/Y% Average Price Y/Y% Index Share of Sales Condo Jan-15 - 3 3 253,700 6.1% 203 Feb-15 2 3 50% 0.67 5 2.50 39 96.7% 256,200 6.4% 285,250 285,250 205 100% Mar-15 2 0% 2 100% 1.00 5 2.50 14 97.7% 255,100 4.1% 300,500 9.9% 300,500 9.9% 204 100% Apr-15 - 5 150% 10 256,500 2.0% 205 May-15 2 0% 1 -83% 2.00 6 3.00 20 98.5% 256,000 -0.2% 258,500 -14.7% 258,500 -14.7% 205 100% Jun-15 - 3 -25% 7 251,800 -2.3% 201 Jul-15 1 0% 4 100% 0.25 7 7.00 89 100.0% 247,700 -3.5% 282,500 -11.2% 282,500 -11.2% 198 100% Aug-15 4 300% 4 0% 1.00 6 1.50 55 96.8% 255,300 -2.0% 280,000 24.4% 286,000 27.1% 204 100% Sep-15 4 -20% 2 -50% 2.00 4 1.00 39 96.6% 257,500 -0.6% 307,500 20.1% 296,250 5.8% 206 100% Oct-15 2 0% 4 -20% 0.50 5 2.50 16 98.5% 256,800 0.2% 285,500 -0.2% 285,500 -0.2% 205 100% Nov-15 2 -50% 2 -60% 1.00 4 2.00 57 97.2% 254,300 -1.3% 257,500 3.3% 257,500 -0.3% 203 100% Dec-15 2 -50% 2 0% 1.00 4 2.00 44 95.1% 255,600 -1.1% 275,000 16.6% 275,000 7.9% 204 100% 2015 21 -30% 35 -5% 0.60 6 2.67 40 97.2% 254,708 0.6% 280,000 9.8% 282,667 5.2% 204 100% Jan-16 - 2 -33% 5 247,400 -2.5% 198 Feb-16 1 -50% 2 -33% 0.50 4 4.00 100 97.9% 250,800 -2.1% 311,000 9.0% 311,000 9.0% 201 100% Mar-16 - 1 -50% 4 243,800 -4.4% 195 Apr-16 - 3 -40% 6 238,900 -6.9% 191 May-16 1 -50% 2 100% 0.50 6 6.00 39 98.5% 242,200 -5.4% 226,000 -12.6% 226,000 -12.6% 194 100% Jun-16 3 3 0% 1.00 2 0.67 33 96.6% 235,200 -6.6% 290,000 275,000 188 100% Jul-16 - - 2 232,400 -6.2% 186 Aug-16 - 2 -50% 4 231,800 -9.2% 185 Sep-16 1 -75% 2 0% 0.50 5 5.00 31 95.3% 237,300 -7.8% 243,000 -21.0% 243,000 -18.0% 190 100% Oct-16 1 -50% 3 -25% 0.33 5 5.00 45 95.3% 232,600 -9.4% 219,000 -23.3% 219,000 -23.3% 186 100% Nov-16 1 -50% 4 100% 0.25 7 7.00 23 96.4% 226,800 -10.8% 265,000 2.9% 265,000 2.9% 181 100% Dec-16 2 0% 1 -50% 2.00 3 1.50 92 95.8% 225,800 -11.7% 234,500 -14.7% 234,500 -14.7% 181 100% 2016 10 -52% 25 -29% 0.40 4 4.17 52 96.5% 237,083 -6.9% 241,000 -13.9% 255,800 -9.5% 190 100% Jan-17 1 5 150% 0.20 5 5.00 71 91.5% 224,200 -9.4% 215,000 215,000 179 100% Feb-17 1 0% 2 0% 0.50 7 7.00 15 96.7% 227,700 -9.2% 203,000 -34.7% 203,000 -34.7% 182 100% Mar-17 1 2 100% 0.50 6 6.00 56 96.9% 222,400 -8.8% 310,000 310,000 178 100% Apr-17 2 1 -67% 2.00 6 3.00 71 97.3% 219,900 -8.0% 232,750 232,750 176 100% May-17 2 100% 2 0% 1.00 4 2.00 35 98.3% 225,400 -6.9% 266,750 18.0% 266,750 18.0% 180 100% Jun-17 1 -67% 3 0% 0.33 6 6.00 65 97.5% 221,700 -5.7% 228,000 -21.4% 228,000 -17.1% 177 100% Jul-17 - 3 6 226,300 -2.6% 181 Aug-17 2 3 50% 0.67 7 3.50 25 94.3% 231,400 -0.2% 238,000 238,000 185 100% Sep-17 - 1 -50% 6 231,300 -2.5% 185 Oct-17 1 0% - 3 3.00 66 86.1% 222,200 -4.5% 206,500 -5.7% 206,500 -5.7% 178 100% Nov-17 2 100% 2 -50% 1.00 3 1.50 77 94.6% 221,100 -2.5% 234,000 -11.7% 234,000 -11.7% 177 100% Dec-17 - 1 0% 3 219,100 -3.0% 175 2017 13 30% 25 0% 0.52 5 4.11 53 95.3% 224,392 -5.4% 228,000 -5.4% 238,885 -6.6% 179 100% Jan-18 - - 3 211,000 -5.9% 169 Feb-18 2 100% 1 -50% 2.00 1 0.50 46 89.2% 217,500 -4.5% 177,500 -12.6% 177,500 -12.6% 174 100% Mar-18 1 0% 2 0% 0.50 3 3.00 117 94.3% 214,900 -3.4% 207,500 -33.1% 207,500 -33.1% 172 100% Apr-18 1 -50% 2 100% 0.50 4 4.00 14 96.4% 213,900 -2.7% 212,000 -8.9% 212,000 -8.9% 171 100% May-18 3 50% 5 150% 0.60 5 1.67 28 97.4% 216,500 -3.9% 240,000 -10.0% 235,333 -11.8% 173 100% Jun-18 1 0% 1 -67% 1.00 4 4.00 44 95.9% 209,500 -5.5% 210,000 -7.9% 210,000 -7.9% 168 100% Jul-18 3 5 67% 0.60 6 2.00 49 98.6% 208,200 -8.0% 191,000 220,000 166 100% Aug-18 3 50% 1 -67% 3.00 4 1.33 32 95.3% 209,900 -9.3% 235,000 -1.3% 246,667 3.6% 168 100% Sep-18 2 1 0% 2.00 3 1.50 117 94.9% 212,900 -8.0% 218,250 218,250 170 100% Oct-18 1 0% 1 1.00 3 3.00 132 90.1% 210,300 -5.4% 252,000 22.0% 252,000 22.0% 168 100% Nov-18 1 -50% 2 0% 0.50 4 4.00 97 95.1% 210,400 -4.8% 228,000 -2.6% 228,000 -2.6% 168 100% Dec-18 1 - 2 2.00 34 100.0% 213,200 -2.7% 209,900 209,900 170 100% 2018 19 46% 21 -16% 0.90 4 2.45 57 95.5% 212,350 -5.4% 212,000 -7.0% 221,942 -7.1% 170 100% Jan-19 - 2 0.00 4 204,400 -3.1% 163 Feb-19 2 0% 1 0% 2.00 2 1.00 55 94.8% 210,300 -3.3% 227,500 28.2% 227,500 28.2% 168 100% Mar-19 2 100% 3 50% 0.67 3 1.50 39 97.2% 206,300 -4.0% 228,000 9.9% 228,000 9.9% 165 100% Apr-19 2 100% 1 -50% 2.00 2 1.00 32 97.4% 208,000 -2.8% 235,750 11.2% 235,750 11.2% 166 100% May-19 1 -67% 2 -60% 0.50 2 2.00 47 94.3% 213,500 -1.4% 245,000 2.1% 245,000 4.1% 171 100% Jun-19 Jul-19 Aug-19 Sep-19 Oct-19 Nov-19 Dec-19 2019 7 -63% 9 -57% 0.78 3 1.38 42 96.2% 208,500 -1.8% 230,000 8.5% 232,500 4.8% 167 100%
  • 20. ROW ACADIA (215) -20% -15% -10% -5% 0% 5% 10% 15% - 1 2 3 4 5 6 MONTHS OF SUPPLY AND PRICE CHANGE Months of Supply trend (12 M) Benchmark price y/y % Change Source: CREB® 0 2 4 6 8 10 12 0% 20% 40% 60% 80% 100% 120% 140% SALES TO NEW LISTINGS RATIO AND INVENTORY Inventory Sales to New listings ratio trend (12 M) Inventory Trend (12 M) Source: CREB® 100,000 150,000 200,000 250,000 300,000 350,000 PRICE COMPARISON Average Median Benchmark Source: CREB® - 10 20 30 40 50 60 70 80 DAYS ON MARKET Days on market trend (12 M) Source: CREB® 198,000 200,000 202,000 204,000 206,000 208,000 210,000 212,000 214,000 216,000 218,000 0 1 2 3 4 5 6 7 May. '18 Jun. '18 Jul. '18 Aug. '18 Sep. '18 Oct. '18 Nov. '18 Dec. '18 Jan. '19 Feb. '19 Mar. '19 Apr. '19 May. '19 INVENTORY, SALES AND PRICE Inventory Sales Benchmark Price Source: CREB® 0 1 2 3 4 5 6 <$200,000 $200,000 - $299,999 $300,000 - $399,999 $400,000 - $499,999 $500,000 - $599,999 $600,000 - $699,999 $700,000 - 999,999 $1,000,000+ MONTHS OF SUPPLY BY PRICE RANGE May-16 May-17 May-18 May-19 Source: CREB® May
  • 21. ROW ACADIA (215) - 1 2 3 4 Jan. Feb. Mar. Apr. May Jun. Jul. Aug. Sept. Oct. Nov. Dec. ROW SALES COMPARISON 2019 2018 2017 2016 Source: CREB® 0 1 2 3 4 5 6 7 <$200,000 $200,000 - $299,999 $300,000 - $399,999 $400,000 - $499,999 $500,000 - $599,999 $600,000 - $699,999 $700,000 - 999,999 $1,000,000+ YTD SALES BY PRICE RANGE YTD-2016 YTD-2017 YTD-2018 YTD-2019 Source: CREB® YTD-MAY 0 1 2 3 4 5 6 7 8 9 10 <$200,000 $200,000 - $299,999 $300,000 - $399,999 $400,000 - $499,999 $500,000 - $599,999 $600,000 - $699,999 $700,000 - 999,999 $1,000,000+ YTD NEW LISTINGS BY PRICE RANGE YTD-2016 YTD-2017 YTD-2018 YTD-2019 Source: CREB® YTD-MAY 0 1 2 3 4 5 6 <$200,000 $200,000 - $299,999 $300,000 - $399,999 $400,000 - $499,999 $500,000 - $599,999 $600,000 - $699,999 $700,000 - 999,999 $1,000,000+ INVENTORY BY PRICE RANGE May-16 May-17 May-18 May-19 Source: CREB® May - 1 2 3 4 5 6 Jan. Feb. Mar. Apr. May Jun. Jul. Aug. Sept. Oct. Nov. Dec. ROW NEW LISTINGS COMPARISON 2019 2018 2017 2016 Source: CREB® - 1 2 3 4 5 6 7 8 Jan. Feb. Mar. Apr. May Jun. Jul. Aug. Sept. Oct. Nov. Dec. ROW INVENTORY COMPARISON 2019 2018 2017 2016 Source: CREB®
  • 22. BENCHMARK PROPERTIES ACADIA (215) Detached Attached One Storey Two Storey Total Semi- Detached Row Total Gross Living Area (Above Ground) 1153 1259 1166 Gross Living Area (Above Ground) - 1045 1045 Lot Size 5500 5604 5500 Lot Size - 0 - Above Ground Bedrooms 3 3 3 Above Ground Bedrooms - 3 3 Year Built 1962 1961 1962 Year Built - 1970 1970 Below Ground Bedrooms 1 0 1 Below Ground Bedrooms - 0 0 Full Bathrooms 2 2 2 Full Bathrooms - 1 1 Half Bathrooms 0 1 0 Half Bathrooms - 0 0 Finished Basement - - - Finished Basement - - - MAY 2019 Benchmark Price 428,300 447,000 432,000 MAY 2019 Benchmark Price 213,500 213,500 MAY 2019 Index value 179 210 183 MAY 2019 Index value 171 171 Share of detached 86% 14% 100% Share of attached - 100% 100% Share of total residential 56% 9% 65% Share of total residential - 13% 13% Apartment Total Residential Total Total Gross Living Area (Above Ground) 907 Gross Living Area (Above Ground) 1114 Above Ground Bedrooms 2 Lot Size - Year Built 1978 Above Ground Bedrooms 3 Covered Parking Spaces 1 Year Built 1965 Full Bathrooms 1 Below Ground Bedrooms 0 Half Bathrooms 0 Full Bathrooms 1 MAY 2019 Benchmark Price 177,200 Half Bathrooms 0 MAY 2019 Index value 165 MAY 2019 Benchmark Price 335,800 Share of apartment to total residential 19% MAY 2019 Index value 178 Finished Basement - DEFINITIONS Detached -A unit that is not attached to any other unit Attached - A unit that is attached to another unit by at least one common wall Apartment - An attached unit that has connecting enclosed hallways Total Residential - Includes detached, attached and apartment style properties Exclusions - Data does not include activity related to rental, land or leased properties Months of Supply - Active Listings (Inventory) / sales Average DOM - Average Days on Market for Sold properties Y/Y% - Year over year percentage change S/NL Ratio - Total number of sales / Total number of new listings SP/LP Ratio - Total dollar volume of sales / Total dollar volume of new listings Benchmark Price MLS® Home Price Index at a point in time with price levels in a base (reference) period. 100,000 150,000 200,000 250,000 300,000 350,000 400,000 450,000 500,000 550,000 BENCHMARK PRICE COMPARISON Detached One Storey Detached Two Storey Detached Apartment Semi Row Source: CREB®