SlideShare ist ein Scribd-Unternehmen logo
1 von 44
Water from the mountains, The Fourth
   Paradigm, and the color of snow


(photo T. H. Painter)
Snow contributions to annual precipitation

                                140                                                                       6


                                120                                                                       5


                                100
                                                   SWE                                                    4                             Arizona/New Mexico:    39%


                                                                                                              Average Monthly SWE(in)
                                                                                 Flow
Average Monthly Flow (1000AF)


                                80                                                                        3
                                                                                                                                                      Utah:      60%

                                60                                                                        2
                                                                                                                                                  Colorado:      63%
                                40                                                                        1

                                                                                                                                              Sierra Nevada:         67%
                                20                                                                        0


                                                                                                          -1

                                      Oct   Nov   Dec   Jan   Feb   Mar   Apr   May   Jun   Jul   Aug   Sep

                                                                    Month


                                Most runoff & recharge come from snowmelt
                                                                                                                                                (Serreze, WRR, 1999)       2
Snow-pillow data for Leavitt Lake, 2929 m, Walker R
   drainage, near Tuolumne & Stanislaus basins


                                                 3
Measurement of snow water equivalent with
              snow pillow


        or


                                (Calif DWR)   4
[Bales et
al., WRR, 2006]

            5
April-July 2011 forecast, Tuolumne River
                           3.5

                                                                               historical max
                           3.0
                                              upper bound                                 actual
                           2.5                                                             *
April-July forecast, km3


                                                                lower bound
                           2.0

                                                                                historical avg
                           1.5


                           1.0


                                                                              historical min
                           0.5


                           0.0
                                   February      March      April                   May          6
7
Snow sensors don’t cover the highest elevations


                                      (K. Rittger)   8
Snow redistribution


(D. Marks)                         9
Differential ablation


    (E. H. Bair)        10
Sierra Nevada, trends in 220 long-term snow
 courses (> 50 years, continuing to present)


                                               11
SWE 2007, 3 methods


             12


                      (K. Rittger)
SWE 2011, 3 methods


             13


                      (K. Rittger)
Reconstruction of heterogeneous snow in a grid cell


       z
                            x
                       y


Daily potential melt       fSCA               Reconstructed SWE


                                  (A. Kahl
                                  Homan et al., Hyd Proc 2011)   14
Fractional snow-covered area, Sierra Nevada
       (MODIS images available daily)
Snow is one of nature’s most colorful materials
            (e.g., Landsat snow & cloud)


Bands 3 2 1 (red, green, blue)   Bands 5 4 2 (swir, nir, green)
                                                                  16
Spectra with 7 MODIS “land” bands (500m
    resolution, global daily coverage)


                                          17
Pure endmembers, 01 Apr 2005

                               100% Snow
                               100% Vegetation
                               100% Rock/Soil


 MODIS image


                                         18
Validation of fSCA w Landsat ETM+


                                    19
Example of satellite data management issue:
    blurring caused by off-nadir view


                                         20
21
Net shortwave radiation:
                                    Tuolumne-Merced River basins
                                                 March 1, 2006 12:00

       S1/8° ¯ NLDAS2                S100m ¯ Spatially Integrated   S100m ¯ Corrected for elevation   S100m ¯ Corrected for topography


    Cosgrove et al., 2003;
     Pinker et al., 2003;                                                Erbs et al., 1982;               Dozier and Frew, 1990
                                     Dubayah and Loechel., 1997
     Mitchell et al., 2004                                             Olyphant et al., 1984

S100m ¯, Corrected for vegetation         a, Snow Albedo                     S100m -                            Qns
                                                                                                                 100m


   Link and Marks, 1999;                Painter et al., 2009;               S -= a S ¯                       Qns = S ¯ +S -
   Garren and Marks, 2005               Dozier et al., 2008

                                                                                         M p j = mQ Rd + a rTD                22
1. Thousand years ago —
                                                             experimental science
                         Data                               Description of natural
                      Acquisition
                      & Modeling                            phenomena
                                                         2. Last few hundred years
                                                             —theoretical science
                                                            Newton’s Laws, Maxwell’s


                                       Collaboration &
Disseminate &


                                        Visualization
                                                            Equations . . .
    Share


                      Archiving &
                      Preservation
                                                         3. Last few decades —
                                                             computational science
                Jim Gray, 1944-2007                         Simulation of complex
                                                            phenomena
                       Analysis &
                      Data Mining
                                                         4. Today — data-intensive
                                                             science
                                                           Model/data integration
                   (J. Frew, T. Hey)
                                                           Data mining
     http://fourthparadigm.org                             Higher-order
                                                              products, sharing    23
Information about water is more useful as we
            climb the value ladder

                                                    Forecasting

                                               Reporting
                                                                Done poorly,
                                        Analysis           but a few notable
                                                           counter-examples
                                 Integration

                         Distribution
                                                Done poorly to moderately,
                   Aggregation                             not easy to find

             Quality assurance
                                                   Sometimes done well,
     Collation                      generally discoverable and available,
Monitoring                                        but could be improved


                                  (I. Zaslavsky & CSIRO, BOM, WMO)       24
Example from medical literature


   Cardiac Disease
   Literature

Co-author path Tague
Co-author path Kolstad
Co-author graph
Citation graph


                                              Immunology Literature


                                      Shared Function


                                             (Phil Bourne)            25
Alternative forms of scholarship


The Right Thing To Do                                      Reward


Accessible data


                                           (Phil Bourne)            26
Stuff to do


              27
SWE model comparison, 2006
                             July
                             June
                             May 1
                             April11


                                       28
Modeled vs observed SWE, April 1, 2006


(K. Rittger)                                            29
Net longwave radiation:
                                  Tuolumne-Merced River basins
                                                    March 1, 2006 12:00
L1/8° ¯ NLDAS2
 a

                                    e 100m ¯ Spatially Integrated
                                      a                                    L100m ¯ Corrected for elevation
                                                                            a
                                                                                                             L100m ¯ Corrected for topography
                                                                                                              a


e 1/8° ¯
  a


                                  Dubayah and Loechel, 1997                       La ¯ = e as Ta4 (z)           Dozier and Frew, 1990

   e 1/8° = L1/8° s Ta1/8°
     a       a


               L100m ¯, Corrected for vegetation
                ac
                                                                            L100m -                                Qnl
                                                                                                                    100m


                Link and Marks, 1999;                          L - = e ss Ts4 + (1- e s )L ¯                  Qnl = L ¯ +L -
                Garren and Marks, 2005
                                                                                                    M p j = mQ Rd + a rTD             30
fSCA corrected for vegetation (not validated)


                                                31
32
Hindu Kush


             33
34
Better graphics!


SWE, cm
   450

   250

   190

   130

    60

    1     04/10/05                35
Finis
           ―the author of all books‖
     – James Joyce, Finnegan’s Wake


36   http://www.slideshare.net/JeffDozier
37
Backup slides


                38
Orographic effect varies (Tuolumne-Merced River
                basins example)


                                              39
PRISM


        40
41
[D. Marks]


             42
Alternative forms of scholarship

Reviews                                              Curation

                      Research
                      [Grants]
            Journal                Poster
            Article                Session

                      Conference
                        Paper

                                                    Blogs
          Data
                                    (Phil Bourne)           43
SWE 2005, 3 methods


                      44

Weitere ähnliche Inhalte

Andere mochten auch

WE2.L09 - ICESAT LIDAR AND GLOBAL DIGITAL ELEVATION MODELS: APPLICATIONS TO D...
WE2.L09 - ICESAT LIDAR AND GLOBAL DIGITAL ELEVATION MODELS: APPLICATIONS TO D...WE2.L09 - ICESAT LIDAR AND GLOBAL DIGITAL ELEVATION MODELS: APPLICATIONS TO D...
WE2.L09 - ICESAT LIDAR AND GLOBAL DIGITAL ELEVATION MODELS: APPLICATIONS TO D...
grssieee
 

Andere mochten auch (10)

WE2.L09 - ICESAT LIDAR AND GLOBAL DIGITAL ELEVATION MODELS: APPLICATIONS TO D...
WE2.L09 - ICESAT LIDAR AND GLOBAL DIGITAL ELEVATION MODELS: APPLICATIONS TO D...WE2.L09 - ICESAT LIDAR AND GLOBAL DIGITAL ELEVATION MODELS: APPLICATIONS TO D...
WE2.L09 - ICESAT LIDAR AND GLOBAL DIGITAL ELEVATION MODELS: APPLICATIONS TO D...
 
Digital Elevation Study -Mason County, KY Area
Digital Elevation Study -Mason County, KY AreaDigital Elevation Study -Mason County, KY Area
Digital Elevation Study -Mason County, KY Area
 
Drainage generation using_arc_gis
Drainage generation using_arc_gisDrainage generation using_arc_gis
Drainage generation using_arc_gis
 
Slope Modeling & Terrain Analysis (EPAN09)
Slope Modeling & Terrain Analysis (EPAN09)Slope Modeling & Terrain Analysis (EPAN09)
Slope Modeling & Terrain Analysis (EPAN09)
 
Digital Elevation Models - WUR - Grontmij
Digital Elevation Models - WUR - GrontmijDigital Elevation Models - WUR - Grontmij
Digital Elevation Models - WUR - Grontmij
 
Lidar campaign & products 2014
Lidar campaign & products 2014Lidar campaign & products 2014
Lidar campaign & products 2014
 
Digital terrain representations(last)
Digital terrain representations(last)Digital terrain representations(last)
Digital terrain representations(last)
 
DTM DEM Generation
DTM DEM GenerationDTM DEM Generation
DTM DEM Generation
 
Digital Elevation Models
Digital Elevation ModelsDigital Elevation Models
Digital Elevation Models
 
Photogrammetry 1.
Photogrammetry 1.Photogrammetry 1.
Photogrammetry 1.
 

Ähnlich wie Faculty to Faculty

Final presentation to Manitoba Hydro
Final presentation to Manitoba HydroFinal presentation to Manitoba Hydro
Final presentation to Manitoba Hydro
Scott St. George
 

Ähnlich wie Faculty to Faculty (9)

From Atmospheric Rivers to Rivers Of Debris: Coupling Extreme Precipitation E...
From Atmospheric Rivers to Rivers Of Debris: Coupling Extreme Precipitation E...From Atmospheric Rivers to Rivers Of Debris: Coupling Extreme Precipitation E...
From Atmospheric Rivers to Rivers Of Debris: Coupling Extreme Precipitation E...
 
Prairie megadroughts: drought, proxies and decadal climate variability in the...
Prairie megadroughts: drought, proxies and decadal climate variability in the...Prairie megadroughts: drought, proxies and decadal climate variability in the...
Prairie megadroughts: drought, proxies and decadal climate variability in the...
 
CAG Quebec 2008 - Prairie drought and tree rings
CAG Quebec 2008 - Prairie drought and tree ringsCAG Quebec 2008 - Prairie drought and tree rings
CAG Quebec 2008 - Prairie drought and tree rings
 
ASBPA 2012 - CA Tide Stations
ASBPA 2012 - CA Tide StationsASBPA 2012 - CA Tide Stations
ASBPA 2012 - CA Tide Stations
 
Observing Sea Level
Observing Sea Level Observing Sea Level
Observing Sea Level
 
Final presentation to Manitoba Hydro
Final presentation to Manitoba HydroFinal presentation to Manitoba Hydro
Final presentation to Manitoba Hydro
 
Geology and Floodplain Management
Geology and Floodplain ManagementGeology and Floodplain Management
Geology and Floodplain Management
 
Two solitudes - how seasonality biases drought from tree rings
Two solitudes - how seasonality biases drought from tree ringsTwo solitudes - how seasonality biases drought from tree rings
Two solitudes - how seasonality biases drought from tree rings
 
Through the trees: The story of Prairie drought told by tree rings
Through the trees: The story of Prairie drought told by tree ringsThrough the trees: The story of Prairie drought told by tree rings
Through the trees: The story of Prairie drought told by tree rings
 

Kürzlich hochgeladen

Why Teams call analytics are critical to your entire business
Why Teams call analytics are critical to your entire businessWhy Teams call analytics are critical to your entire business
Why Teams call analytics are critical to your entire business
panagenda
 
Artificial Intelligence: Facts and Myths
Artificial Intelligence: Facts and MythsArtificial Intelligence: Facts and Myths
Artificial Intelligence: Facts and Myths
Joaquim Jorge
 

Kürzlich hochgeladen (20)

TrustArc Webinar - Stay Ahead of US State Data Privacy Law Developments
TrustArc Webinar - Stay Ahead of US State Data Privacy Law DevelopmentsTrustArc Webinar - Stay Ahead of US State Data Privacy Law Developments
TrustArc Webinar - Stay Ahead of US State Data Privacy Law Developments
 
Apidays New York 2024 - Scaling API-first by Ian Reasor and Radu Cotescu, Adobe
Apidays New York 2024 - Scaling API-first by Ian Reasor and Radu Cotescu, AdobeApidays New York 2024 - Scaling API-first by Ian Reasor and Radu Cotescu, Adobe
Apidays New York 2024 - Scaling API-first by Ian Reasor and Radu Cotescu, Adobe
 
AWS Community Day CPH - Three problems of Terraform
AWS Community Day CPH - Three problems of TerraformAWS Community Day CPH - Three problems of Terraform
AWS Community Day CPH - Three problems of Terraform
 
Strategies for Unlocking Knowledge Management in Microsoft 365 in the Copilot...
Strategies for Unlocking Knowledge Management in Microsoft 365 in the Copilot...Strategies for Unlocking Knowledge Management in Microsoft 365 in the Copilot...
Strategies for Unlocking Knowledge Management in Microsoft 365 in the Copilot...
 
Why Teams call analytics are critical to your entire business
Why Teams call analytics are critical to your entire businessWhy Teams call analytics are critical to your entire business
Why Teams call analytics are critical to your entire business
 
Exploring the Future Potential of AI-Enabled Smartphone Processors
Exploring the Future Potential of AI-Enabled Smartphone ProcessorsExploring the Future Potential of AI-Enabled Smartphone Processors
Exploring the Future Potential of AI-Enabled Smartphone Processors
 
A Year of the Servo Reboot: Where Are We Now?
A Year of the Servo Reboot: Where Are We Now?A Year of the Servo Reboot: Where Are We Now?
A Year of the Servo Reboot: Where Are We Now?
 
Strategize a Smooth Tenant-to-tenant Migration and Copilot Takeoff
Strategize a Smooth Tenant-to-tenant Migration and Copilot TakeoffStrategize a Smooth Tenant-to-tenant Migration and Copilot Takeoff
Strategize a Smooth Tenant-to-tenant Migration and Copilot Takeoff
 
Connector Corner: Accelerate revenue generation using UiPath API-centric busi...
Connector Corner: Accelerate revenue generation using UiPath API-centric busi...Connector Corner: Accelerate revenue generation using UiPath API-centric busi...
Connector Corner: Accelerate revenue generation using UiPath API-centric busi...
 
Artificial Intelligence: Facts and Myths
Artificial Intelligence: Facts and MythsArtificial Intelligence: Facts and Myths
Artificial Intelligence: Facts and Myths
 
🐬 The future of MySQL is Postgres 🐘
🐬  The future of MySQL is Postgres   🐘🐬  The future of MySQL is Postgres   🐘
🐬 The future of MySQL is Postgres 🐘
 
Deploy with confidence: VMware Cloud Foundation 5.1 on next gen Dell PowerEdg...
Deploy with confidence: VMware Cloud Foundation 5.1 on next gen Dell PowerEdg...Deploy with confidence: VMware Cloud Foundation 5.1 on next gen Dell PowerEdg...
Deploy with confidence: VMware Cloud Foundation 5.1 on next gen Dell PowerEdg...
 
Automating Google Workspace (GWS) & more with Apps Script
Automating Google Workspace (GWS) & more with Apps ScriptAutomating Google Workspace (GWS) & more with Apps Script
Automating Google Workspace (GWS) & more with Apps Script
 
Workshop - Best of Both Worlds_ Combine KG and Vector search for enhanced R...
Workshop - Best of Both Worlds_ Combine  KG and Vector search for  enhanced R...Workshop - Best of Both Worlds_ Combine  KG and Vector search for  enhanced R...
Workshop - Best of Both Worlds_ Combine KG and Vector search for enhanced R...
 
From Event to Action: Accelerate Your Decision Making with Real-Time Automation
From Event to Action: Accelerate Your Decision Making with Real-Time AutomationFrom Event to Action: Accelerate Your Decision Making with Real-Time Automation
From Event to Action: Accelerate Your Decision Making with Real-Time Automation
 
Top 5 Benefits OF Using Muvi Live Paywall For Live Streams
Top 5 Benefits OF Using Muvi Live Paywall For Live StreamsTop 5 Benefits OF Using Muvi Live Paywall For Live Streams
Top 5 Benefits OF Using Muvi Live Paywall For Live Streams
 
The 7 Things I Know About Cyber Security After 25 Years | April 2024
The 7 Things I Know About Cyber Security After 25 Years | April 2024The 7 Things I Know About Cyber Security After 25 Years | April 2024
The 7 Things I Know About Cyber Security After 25 Years | April 2024
 
Real Time Object Detection Using Open CV
Real Time Object Detection Using Open CVReal Time Object Detection Using Open CV
Real Time Object Detection Using Open CV
 
Data Cloud, More than a CDP by Matt Robison
Data Cloud, More than a CDP by Matt RobisonData Cloud, More than a CDP by Matt Robison
Data Cloud, More than a CDP by Matt Robison
 
Manulife - Insurer Innovation Award 2024
Manulife - Insurer Innovation Award 2024Manulife - Insurer Innovation Award 2024
Manulife - Insurer Innovation Award 2024
 

Faculty to Faculty

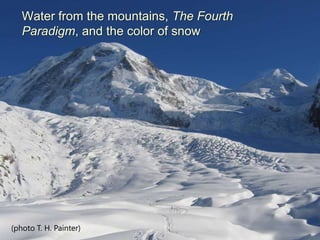
  • 1. Water from the mountains, The Fourth Paradigm, and the color of snow (photo T. H. Painter)
  • 2. Snow contributions to annual precipitation 140 6 120 5 100 SWE 4 Arizona/New Mexico: 39% Average Monthly SWE(in) Flow Average Monthly Flow (1000AF) 80 3 Utah: 60% 60 2 Colorado: 63% 40 1 Sierra Nevada: 67% 20 0 -1 Oct Nov Dec Jan Feb Mar Apr May Jun Jul Aug Sep Month Most runoff & recharge come from snowmelt (Serreze, WRR, 1999) 2
  • 3. Snow-pillow data for Leavitt Lake, 2929 m, Walker R drainage, near Tuolumne & Stanislaus basins 3
  • 4. Measurement of snow water equivalent with snow pillow or (Calif DWR) 4
  • 6. April-July 2011 forecast, Tuolumne River 3.5 historical max 3.0 upper bound actual 2.5 * April-July forecast, km3 lower bound 2.0 historical avg 1.5 1.0 historical min 0.5 0.0 February March April May 6
  • 7. 7
  • 8. Snow sensors don’t cover the highest elevations (K. Rittger) 8
  • 10. Differential ablation (E. H. Bair) 10
  • 11. Sierra Nevada, trends in 220 long-term snow courses (> 50 years, continuing to present) 11
  • 12. SWE 2007, 3 methods 12 (K. Rittger)
  • 13. SWE 2011, 3 methods 13 (K. Rittger)
  • 14. Reconstruction of heterogeneous snow in a grid cell z x y Daily potential melt fSCA Reconstructed SWE (A. Kahl Homan et al., Hyd Proc 2011) 14
  • 15. Fractional snow-covered area, Sierra Nevada (MODIS images available daily)
  • 16. Snow is one of nature’s most colorful materials (e.g., Landsat snow & cloud) Bands 3 2 1 (red, green, blue) Bands 5 4 2 (swir, nir, green) 16
  • 17. Spectra with 7 MODIS “land” bands (500m resolution, global daily coverage) 17
  • 18. Pure endmembers, 01 Apr 2005 100% Snow 100% Vegetation 100% Rock/Soil MODIS image 18
  • 19. Validation of fSCA w Landsat ETM+ 19
  • 20. Example of satellite data management issue: blurring caused by off-nadir view 20
  • 21. 21
  • 22. Net shortwave radiation: Tuolumne-Merced River basins March 1, 2006 12:00 S1/8° ¯ NLDAS2 S100m ¯ Spatially Integrated S100m ¯ Corrected for elevation S100m ¯ Corrected for topography Cosgrove et al., 2003; Pinker et al., 2003; Erbs et al., 1982; Dozier and Frew, 1990 Dubayah and Loechel., 1997 Mitchell et al., 2004 Olyphant et al., 1984 S100m ¯, Corrected for vegetation a, Snow Albedo S100m - Qns 100m Link and Marks, 1999; Painter et al., 2009; S -= a S ¯ Qns = S ¯ +S - Garren and Marks, 2005 Dozier et al., 2008 M p j = mQ Rd + a rTD 22
  • 23. 1. Thousand years ago — experimental science Data Description of natural Acquisition & Modeling phenomena 2. Last few hundred years —theoretical science Newton’s Laws, Maxwell’s Collaboration & Disseminate & Visualization Equations . . . Share Archiving & Preservation 3. Last few decades — computational science Jim Gray, 1944-2007 Simulation of complex phenomena Analysis & Data Mining 4. Today — data-intensive science Model/data integration (J. Frew, T. Hey) Data mining http://fourthparadigm.org Higher-order products, sharing 23
  • 24. Information about water is more useful as we climb the value ladder Forecasting Reporting Done poorly, Analysis but a few notable counter-examples Integration Distribution Done poorly to moderately, Aggregation not easy to find Quality assurance Sometimes done well, Collation generally discoverable and available, Monitoring but could be improved (I. Zaslavsky & CSIRO, BOM, WMO) 24
  • 25. Example from medical literature Cardiac Disease Literature Co-author path Tague Co-author path Kolstad Co-author graph Citation graph Immunology Literature Shared Function (Phil Bourne) 25
  • 26. Alternative forms of scholarship The Right Thing To Do Reward Accessible data (Phil Bourne) 26
  • 28. SWE model comparison, 2006 July June May 1 April11 28
  • 29. Modeled vs observed SWE, April 1, 2006 (K. Rittger) 29
  • 30. Net longwave radiation: Tuolumne-Merced River basins March 1, 2006 12:00 L1/8° ¯ NLDAS2 a e 100m ¯ Spatially Integrated a L100m ¯ Corrected for elevation a L100m ¯ Corrected for topography a e 1/8° ¯ a Dubayah and Loechel, 1997 La ¯ = e as Ta4 (z) Dozier and Frew, 1990 e 1/8° = L1/8° s Ta1/8° a a L100m ¯, Corrected for vegetation ac L100m - Qnl 100m Link and Marks, 1999; L - = e ss Ts4 + (1- e s )L ¯ Qnl = L ¯ +L - Garren and Marks, 2005 M p j = mQ Rd + a rTD 30
  • 31. fSCA corrected for vegetation (not validated) 31
  • 32. 32
  • 34. 34
  • 35. Better graphics! SWE, cm 450 250 190 130 60 1 04/10/05 35
  • 36. Finis ―the author of all books‖ – James Joyce, Finnegan’s Wake 36 http://www.slideshare.net/JeffDozier
  • 37. 37
  • 39. Orographic effect varies (Tuolumne-Merced River basins example) 39
  • 40. PRISM 40
  • 41. 41
  • 43. Alternative forms of scholarship Reviews Curation Research [Grants] Journal Poster Article Session Conference Paper Blogs Data (Phil Bourne) 43
  • 44. SWE 2005, 3 methods 44

Hinweis der Redaktion

  1. Figure 1 of Dozier, Eos AGU Trans, 2011