SlideShare ist ein Scribd-Unternehmen logo
1 von 5
Alumni GivingRate LinearRegressionAnalysis
Introduction:
Thisstudyinvestigatesthe factorsthatinfluencealumnidonations. We use exploratorydataanalysisand
multi factor linear regression techniques to predict alumni giving rate. After analyzing relationships
between the variables, we fit linear regression models and perform residual diagnosis to ensure that
assumptionsof linearregressionare notviolated.We findthatlowerstudent-faculty ratioleadstohigher
alumni donations and smaller class size is insignificant in predicting alumni donations. We include an
additional parameter graduation rate, which is highlycorrelated with alumni giving rate and interaction
between student-faculty ratio and dummy variable private in our final model. The final mode has an
adjusted R-squared of 75.76%.
Data Description:
In thisstudywe use data from 48 US universities collected from Americaโ€™s Best Colleges, Year 2000 Ed.
๏ƒ˜ School: University Name
๏ƒ˜ % of Classes Under 20: Percentage of classes offered with fewer than 20 students
๏ƒ˜ Student/Faculty Ratio: Ratio of the students to the faculty
๏ƒ˜ Alumni Giving Rate: Percentage of alumni that donated to the university
๏ƒ˜ Private:A categorical variable forprivate orpublicuniversitieswith1for private and 0 for public
We observed that there are no null values and outlier in the dataset and descriptive statistics of all the
variables is presented in table 1.
TABLE 1: Summary statistics for the response and predictor variables
Variable Minimum 1st
Quantile Median Mean 3rd
Quantile Maximum
Alumni GivingRate 7.00 18.75 29.00 29.27 38.50 67.00
PercentClassSize under20 29.00 44.75 59.50 55.73 66.25 77.00
StudentFacultyRatio 3.00 8.00 10.50 11.54 13.50 23.00
Private 0.00 0.00 1.00 0.688 1.00 1.00
We observe that ๐ด๐‘™๐‘ข๐‘š๐‘›๐‘– ๐‘”๐‘–๐‘ฃ๐‘–๐‘›๐‘” ๐‘Ÿ๐‘Ž๐‘ก๐‘’ has positive correlation with ๐‘ƒ๐‘’๐‘Ÿ๐‘๐‘’๐‘›๐‘ก ๐‘๐‘™๐‘Ž๐‘ ๐‘  ๐‘ ๐‘–๐‘ง๐‘’ ๐‘ข๐‘›๐‘‘๐‘’๐‘Ÿ 20 and
strong negative correlation with ๐‘†๐‘ก๐‘ข๐‘‘๐‘’๐‘›๐‘ก ๐‘“๐‘Ž๐‘๐‘ข๐‘™๐‘ก๐‘ฆ ๐‘Ÿ๐‘Ž๐‘ก๐‘–๐‘œ with correlation coefficients of 0.646 and
Alumni GivingRate LinearRegressionAnalysis
โˆ’0.742 respectively. Further, ๐‘ƒ๐‘’๐‘Ÿ๐‘๐‘’๐‘›๐‘ก ๐‘๐‘™๐‘Ž๐‘ ๐‘  ๐‘ ๐‘–๐‘ง๐‘’ ๐‘ข๐‘›๐‘‘๐‘’๐‘Ÿ 20 and ๐‘†๐‘ก๐‘ข๐‘‘๐‘’๐‘›๐‘ก ๐‘“๐‘Ž๐‘๐‘ข๐‘™๐‘ก๐‘ฆ ๐‘Ÿ๐‘Ž๐‘ก๐‘–๐‘œ have a
correlation of โˆ’0.786 which can lead to multicollinearity issues.
Figure 1: Pairwise scatter plots of all the variables
Figure 2: Box plot for Alumni Giving Rate, Percent class under 20 and Student-Faculty Ratio
Methodology
Researchshowsthat studentswhoare more satisfiedwiththeircontactwithteachersare more likelyto
graduate. As a result, one might suspect that smaller class sizes and lower student-faculty ratios might
leadtoa higherpercentageof satisfiedgraduates,whichinturnmightleadtoincreasesinthe percentage
of alumni who donate.
First,we fita linearregressionmodel withclasssizeandstudent-facultyratioaspredictors andour fitted
regression equation is:
๐ด๐‘™๐‘ข๐‘š๐‘›๐‘– ๐‘”๐‘–๐‘ฃ๐‘–๐‘›๐‘” ๐‘Ÿ๐‘Ž๐‘ก๐‘’ฬ‚ = 39.66 + 0.17 โˆ— ๐‘ƒ๐‘’๐‘Ÿ๐‘๐‘’๐‘›๐‘ก ๐ถ๐‘™๐‘Ž๐‘ ๐‘  ๐‘†๐‘–๐‘ง๐‘’ ๐‘ข๐‘›๐‘‘๐‘’๐‘Ÿ 20ฬ‚ โˆ’ 1.7 โˆ— ๐‘†๐‘ก๐‘ข๐‘‘๐‘’๐‘›๐‘ก ๐‘“๐‘Ž๐‘๐‘ข๐‘™๐‘ก๐‘ฆ ๐‘Ÿ๐‘Ž๐‘ก๐‘–๐‘œฬ‚
Alumni GivingRate LinearRegressionAnalysis
From the results of hypothesis tests (๐ป0: ๐›ฝ0 = 0; ๐›ฝ1 = 0 ; ๐›ฝ2 = 0 ๐‘Ž๐‘›๐‘‘ ๐ป ๐‘Ž:๐›ฝ0 โ‰  0; ๐›ฝ1 โ‰  0 ; ๐›ฝ2 โ‰  0 :
significance of the coefficients) we conclude ๐›ฝ0 and ๐›ฝ2 are significant and ๐›ฝ1is insignificant.
Figure 3: Scatter plots grouped by public and private universities
From figure 3, we observe that alumni donationforprivate andpublicschoolsare significantlydifferent.
Now,we include the dummyvariable ๐‘๐‘Ÿ๐‘–๐‘Ž๐‘ฃ๐‘ก๐‘’ inour initial model. The fitted regression equations are:
Private Schools:
๐ด๐‘™๐‘ข๐‘š๐‘›๐‘– ๐‘”๐‘–๐‘ฃ๐‘–๐‘›๐‘” ๐‘Ÿ๐‘Ž๐‘ก๐‘’ฬ‚ = 43.07 + 0.08 โˆ— ๐‘ƒ๐‘’๐‘Ÿ๐‘๐‘’๐‘›๐‘ก ๐ถ๐‘™๐‘Ž๐‘ ๐‘  ๐‘†๐‘–๐‘ง๐‘’ ๐‘ข๐‘›๐‘‘๐‘’๐‘Ÿ 20ฬ‚ โˆ’ 1.4 โˆ— ๐‘†๐‘ก๐‘ข๐‘‘๐‘’๐‘›๐‘ก ๐‘“๐‘Ž๐‘๐‘ข๐‘™๐‘ก๐‘ฆ ๐‘Ÿ๐‘Ž๐‘ก๐‘–๐‘œฬ‚
Public Schools:
๐ด๐‘™๐‘ข๐‘š๐‘›๐‘– ๐‘”๐‘–๐‘ฃ๐‘–๐‘›๐‘” ๐‘Ÿ๐‘Ž๐‘ก๐‘’ฬ‚ = 36.78 + 0.08 โˆ— ๐‘ƒ๐‘’๐‘Ÿ๐‘๐‘’๐‘›๐‘ก ๐ถ๐‘™๐‘Ž๐‘ ๐‘  ๐‘†๐‘–๐‘ง๐‘’ ๐‘ข๐‘›๐‘‘๐‘’๐‘Ÿ 20ฬ‚ โˆ’ 1.4 โˆ— ๐‘†๐‘ก๐‘ข๐‘‘๐‘’๐‘›๐‘ก ๐‘“๐‘Ž๐‘๐‘ข๐‘™๐‘ก๐‘ฆ ๐‘Ÿ๐‘Ž๐‘ก๐‘–๐‘œฬ‚
From the results of hypothesis tests (๐ป0: ๐›ฝ0 = 0; ๐›ฝ1 = 0 ; ๐›ฝ2 = 0; ๐›ฝ3 = 0 ๐‘Ž๐‘›๐‘‘ ๐ป ๐‘Ž: ๐›ฝ0 โ‰  0; ๐›ฝ1 โ‰ 
0 ; ๐›ฝ2 โ‰  0 ; ๐›ฝ3 โ‰  0 ), we conclude that only ๐›ฝ0 and ๐›ฝ2 are significant. The model Adjusted R squared is
.5747, indicating the model is not much better than flipping a coin in terms of predicting power.
Residual analysis:
The QQ plot of model residuals vs fitted values indicate that normality assumption of error term is
violated. When the residuals are plotted against ๐‘ƒ๐‘’๐‘Ÿ๐‘๐‘’๐‘›๐‘ก ๐‘๐‘™๐‘Ž๐‘ ๐‘  ๐‘ ๐‘–๐‘ง๐‘’ ๐‘ข๐‘›๐‘‘๐‘’๐‘Ÿ 20, the residuals show
increasingvariance and against ๐‘†๐‘ก๐‘ข๐‘‘๐‘’๐‘›๐‘ก ๐‘“๐‘Ž๐‘๐‘ข๐‘™๐‘ก๐‘ฆ ๐‘Ÿ๐‘Ž๐‘ก๐‘–๐‘œ show constant variance. Thisis alignedwiththe
results of NCV Test (๐ป ๐‘œ: ๐œŽ๐‘’
2 = ๐œŽ2 ๐‘๐‘œ๐‘›๐‘ ๐‘ก๐‘Ž๐‘›๐‘ก ; ๐ป ๐‘Ž: ๐œŽ๐‘’
2 โ‰  ๐œŽ2), with a large ๐‘-๐‘ฃ๐‘Ž๐‘™๐‘ข๐‘’ (0.29). We conclude
that there is no issue of heteroscedasticity. The results of Durbin Watson Test indicate that there is no
first order autocorrelation (๐ท โˆ’ ๐‘Š ๐‘†๐‘ก๐‘Ž๐‘ก๐‘–๐‘ ๐‘ก๐‘–๐‘ โˆถ 1.61378 ; ๐‘๐‘ฃ๐‘Ž๐‘™๐‘ข๐‘’ โˆถ 0.172).
Alumni GivingRate LinearRegressionAnalysis
Figure 4: Residual plots
Outliers and Influential Points:
Table 2:
Measure Condition Outlier
Y Outlier Studentizedresidual | ๐‘Ÿ๐‘—| โ‰ฅ 3 Princeton University
X Outlier Leverage โ„Ž ๐‘– ๐‘— โ‰ฅ 2๐‘/๐‘› Boston College, U. of Washington, UCB
Influential Point Cookโ€™s D ๐ท๐‘–~๐น๐‘,๐‘›โˆ’๐‘ NYU, Princeton,U of Florida,U. of Norte
Dame, U. of Washington
Afterremovingthe outliersandinfluencepoints,the adjustedR-squaredimproved from57.47% to 63.67.
However, ๐›ฝ1, ๐›ฝ3 are still insignificant. Since, ๐‘ƒ๐‘’๐‘Ÿ๐‘๐‘’๐‘›๐‘ก ๐‘๐‘™๐‘Ž๐‘ ๐‘  ๐‘ ๐‘–๐‘ง๐‘’ ๐‘ข๐‘›๐‘‘๐‘’๐‘Ÿ 20 and ๐‘†๐‘ก๐‘ข๐‘‘๐‘’๐‘›๐‘ก ๐‘“๐‘Ž๐‘๐‘ข๐‘™๐‘ก๐‘ฆ ๐‘Ÿ๐‘Ž๐‘ก๐‘–๐‘œ
are highlycorrelatedandthe coefficientof ๐‘ƒ๐‘’๐‘Ÿ๐‘๐‘’๐‘›๐‘ก ๐‘๐‘™๐‘Ž๐‘ ๐‘  ๐‘ ๐‘–๐‘ง๐‘’ ๐‘ข๐‘›๐‘‘๐‘’๐‘Ÿ 20 isinsignificant,we remove this
predictorandfita newregressionmodel,withadjustedR-squaredimprovedto64.25%. Resultsof Partial
F-test (table 3) also confirm that ๐‘ƒ๐‘’๐‘Ÿ๐‘๐‘’๐‘›๐‘ก ๐‘๐‘™๐‘Ž๐‘ ๐‘  ๐‘ ๐‘–๐‘ง๐‘’ ๐‘ข๐‘›๐‘‘๐‘’๐‘Ÿ 20 is insignificant as the p-value is large.
Table 3: Partial F-Test results
Model 1: Alumni.Giving.rate ~SFratio + Private
Model 2: Alumni.Giving.rate ~Per.under.20+ SFratio + Private
Res.Df RSS Df Sum of sq F Pr(>F)
38 1991.6
37 1971.2 1 20.477 0.3844 0.5391
Alumni GivingRate LinearRegressionAnalysis
The regression equation is:
๐ด๐‘™๐‘ข๐‘š๐‘›๐‘– ๐‘”๐‘–๐‘ฃ๐‘–๐‘›๐‘” ๐‘Ÿ๐‘Ž๐‘ก๐‘’ฬ‚ = 43.36 โˆ’ 1.61 โˆ— ๐‘†๐‘ก๐‘ข๐‘‘๐‘’๐‘›๐‘ก ๐‘“๐‘Ž๐‘๐‘ข๐‘™๐‘ก๐‘ฆ ๐‘Ÿ๐‘Ž๐‘ก๐‘–๐‘œฬ‚ + 5.53 โˆ— ๐‘ƒ๐‘Ÿ๐‘–๐‘ฃ๐‘Ž๐‘ก๐‘’ฬ‚
Discussion:
For the final model, we included an additional variable ๐‘”๐‘Ÿ๐‘Ž๐‘‘_๐‘Ÿ๐‘Ž๐‘ก๐‘’, a variable part of original Americaโ€™s
Best Colleges,Year2000 Ed dataset (withcorrelationcoefficientof 0.756 with ๐ด๐‘™๐‘ข๐‘š๐‘›๐‘– ๐‘”๐‘–๐‘ฃ๐‘–๐‘›๐‘” ๐‘Ÿ๐‘Ž๐‘ก๐‘’) to
the initial data set and fitted a linear regression model with all other variables.
The model adjusted R-squaredimproves to 69.79%.
By adding an interaction parameter
๐‘†๐‘ก๐‘ข๐‘‘๐‘’๐‘›๐‘ก ๐‘“๐‘Ž๐‘๐‘ข๐‘™๐‘ก๐‘ฆ ๐‘Ÿ๐‘Ž๐‘ก๐‘–๐‘œ โˆถ ๐‘๐‘Ÿ๐‘–๐‘ฃ๐‘Ž๐‘ก๐‘’ model adjusted
R-squared improves to 71.74%. All the regression
coefficients are significant except for
๐‘†๐‘ก๐‘ข๐‘‘๐‘’๐‘›๐‘ก ๐‘“๐‘Ž๐‘๐‘ข๐‘™๐‘ก๐‘ฆ ๐‘Ÿ๐‘Ž๐‘ก๐‘–๐‘œ.
Fitted Model
๐ด๐‘™๐‘ข๐‘š๐‘›๐‘– ๐‘”๐‘–๐‘ฃ๐‘– ๐‘› ๐‘” ๐‘Ÿ๐‘Ž๐‘ก๐‘’ฬ‚
= โˆ’24.39 โˆ’ 0.04 โˆ— ๐‘†๐‘ก๐‘ข๐‘‘๐‘’๐‘›๐‘ก ๐‘“๐‘Ž๐‘๐‘ข๐‘™๐‘ก๐‘ฆ ๐‘Ÿ๐‘Ž๐‘ก๐‘–๐‘œฬ‚ + 26.27 โˆ— ๐‘ƒ๐‘Ÿ๐‘–๐‘ฃ๐‘Ž๐‘ก๐‘’ฬ‚ โˆ’ 1.52 โˆ— ๐‘†๐‘ก๐‘ข๐‘‘๐‘’๐‘›๐‘ก ๐‘“๐‘Ž๐‘๐‘ข๐‘™๐‘ก๐‘ฆ ๐‘Ÿ๐‘Ž๐‘ก๐‘–๐‘œฬ‚
โˆ— ๐‘ƒ๐‘Ÿ๐‘–๐‘ฃ๐‘Ž๐‘ก๐‘’ฬ‚ + 0.53 โˆ— ๐‘”๐‘Ÿ๐‘Ž๐‘‘_๐‘Ÿ๐‘Ž๐‘ก๐‘’
Now,we fitaregressionmodelwithout ๐‘†๐‘ก๐‘ข๐‘‘๐‘’๐‘›๐‘ก ๐‘“๐‘Ž๐‘๐‘ข๐‘™๐‘ก๐‘ฆ ๐‘Ÿ๐‘Ž๐‘ก๐‘–๐‘œ,withmuchimprovedadjustedR-squared
value of 75.76%. Residual diagnosis show that error terms follow normal distribution with constant
variance (Shapiro-Wilk Test: p-value 0.16).
Our final regression model is:
๐ด๐‘™๐‘ข๐‘š๐‘›๐‘– ๐‘”๐‘–๐‘ฃ๐‘–๐‘›๐‘” ๐‘Ÿ๐‘Ž๐‘ก๐‘’ฬ‚ = โˆ’25.32 + 26.92โˆ— ๐‘ƒ๐‘Ÿ๐‘–๐‘ฃ๐‘Ž๐‘ก๐‘’ฬ‚ โˆ’ 1.55 โˆ— ๐‘†๐‘ก๐‘ข๐‘‘๐‘’๐‘›๐‘ก ๐‘“๐‘Ž๐‘๐‘ข๐‘™๐‘ก๐‘ฆ ๐‘Ÿ๐‘Ž๐‘ก๐‘–๐‘œฬ‚ โˆ— ๐‘ƒ๐‘Ÿ๐‘–๐‘ฃ๐‘Ž๐‘ก๐‘’ฬ‚ + 0.54 โˆ— ๐‘”๐‘Ÿ๐‘Ž๐‘‘_๐‘Ÿ๐‘Ž๐‘ก๐‘’

Weitere รคhnliche Inhalte

Was ist angesagt?

Spearman Rank Correlation Presentation
Spearman Rank Correlation PresentationSpearman Rank Correlation Presentation
Spearman Rank Correlation Presentationcae_021
ย 
Lecture 9 correlation-manual calcualtion
Lecture 9 correlation-manual calcualtionLecture 9 correlation-manual calcualtion
Lecture 9 correlation-manual calcualtionDr Rajeev Kumar
ย 
Introduction to correlation and regression analysis
Introduction to correlation and regression analysisIntroduction to correlation and regression analysis
Introduction to correlation and regression analysisFarzad Javidanrad
ย 
Spearman rank correlation coefficient
Spearman rank correlation coefficientSpearman rank correlation coefficient
Spearman rank correlation coefficientKarishma Chaudhary
ย 
Applied Statistics In Business
Applied Statistics In BusinessApplied Statistics In Business
Applied Statistics In BusinessAshish Nangla
ย 
Multiple Regression Analysis (MRA)
Multiple Regression Analysis (MRA)Multiple Regression Analysis (MRA)
Multiple Regression Analysis (MRA)Naveen Kumar Medapalli
ย 
Point Bicerial Correlation Coefficient
Point Bicerial Correlation CoefficientPoint Bicerial Correlation Coefficient
Point Bicerial Correlation CoefficientSharlaine Ruth
ย 
Simple Correlation : Karl Pearsonโ€™s Correlation co- efficient and Spearmanโ€™s ...
Simple Correlation : Karl Pearsonโ€™s Correlation co- efficient and Spearmanโ€™s ...Simple Correlation : Karl Pearsonโ€™s Correlation co- efficient and Spearmanโ€™s ...
Simple Correlation : Karl Pearsonโ€™s Correlation co- efficient and Spearmanโ€™s ...RekhaChoudhary24
ย 
Lecture 8 basic concepts of correlation
Lecture 8  basic concepts of correlation Lecture 8  basic concepts of correlation
Lecture 8 basic concepts of correlation Dr Rajeev Kumar
ย 
Wilcoxon Rank-Sum Test
Wilcoxon Rank-Sum TestWilcoxon Rank-Sum Test
Wilcoxon Rank-Sum TestSahil Jain
ย 
Correlation in Statistics
Correlation in StatisticsCorrelation in Statistics
Correlation in StatisticsAvjinder (Avi) Kaler
ย 
Lesson 8 Linear Correlation And Regression
Lesson 8 Linear Correlation And RegressionLesson 8 Linear Correlation And Regression
Lesson 8 Linear Correlation And RegressionSumit Prajapati
ย 
Lesson 23 planning data analyses using statistics
Lesson 23 planning data analyses using statisticsLesson 23 planning data analyses using statistics
Lesson 23 planning data analyses using statisticsmjlobetos
ย 
Multiple linear regression II
Multiple linear regression IIMultiple linear regression II
Multiple linear regression IIJames Neill
ย 
Linear regression analysis
Linear regression analysisLinear regression analysis
Linear regression analysisNimrita Koul
ย 

Was ist angesagt? (20)

Spearman Rank Correlation Presentation
Spearman Rank Correlation PresentationSpearman Rank Correlation Presentation
Spearman Rank Correlation Presentation
ย 
Lecture 9 correlation-manual calcualtion
Lecture 9 correlation-manual calcualtionLecture 9 correlation-manual calcualtion
Lecture 9 correlation-manual calcualtion
ย 
Introduction to correlation and regression analysis
Introduction to correlation and regression analysisIntroduction to correlation and regression analysis
Introduction to correlation and regression analysis
ย 
Spearman rank correlation coefficient
Spearman rank correlation coefficientSpearman rank correlation coefficient
Spearman rank correlation coefficient
ย 
Regression Analysis
Regression AnalysisRegression Analysis
Regression Analysis
ย 
Applied Statistics In Business
Applied Statistics In BusinessApplied Statistics In Business
Applied Statistics In Business
ย 
Multiple Regression Analysis (MRA)
Multiple Regression Analysis (MRA)Multiple Regression Analysis (MRA)
Multiple Regression Analysis (MRA)
ย 
Point Bicerial Correlation Coefficient
Point Bicerial Correlation CoefficientPoint Bicerial Correlation Coefficient
Point Bicerial Correlation Coefficient
ย 
Simple Correlation : Karl Pearsonโ€™s Correlation co- efficient and Spearmanโ€™s ...
Simple Correlation : Karl Pearsonโ€™s Correlation co- efficient and Spearmanโ€™s ...Simple Correlation : Karl Pearsonโ€™s Correlation co- efficient and Spearmanโ€™s ...
Simple Correlation : Karl Pearsonโ€™s Correlation co- efficient and Spearmanโ€™s ...
ย 
Lecture 8 basic concepts of correlation
Lecture 8  basic concepts of correlation Lecture 8  basic concepts of correlation
Lecture 8 basic concepts of correlation
ย 
Wilcoxon Rank-Sum Test
Wilcoxon Rank-Sum TestWilcoxon Rank-Sum Test
Wilcoxon Rank-Sum Test
ย 
Correlation in Statistics
Correlation in StatisticsCorrelation in Statistics
Correlation in Statistics
ย 
Lesson 8 Linear Correlation And Regression
Lesson 8 Linear Correlation And RegressionLesson 8 Linear Correlation And Regression
Lesson 8 Linear Correlation And Regression
ย 
Correlation
CorrelationCorrelation
Correlation
ย 
Chi Square & Anova
Chi Square & AnovaChi Square & Anova
Chi Square & Anova
ย 
Simple linear regressionn and Correlation
Simple linear regressionn and CorrelationSimple linear regressionn and Correlation
Simple linear regressionn and Correlation
ย 
Lesson 23 planning data analyses using statistics
Lesson 23 planning data analyses using statisticsLesson 23 planning data analyses using statistics
Lesson 23 planning data analyses using statistics
ย 
Correlations using SPSS
Correlations using SPSSCorrelations using SPSS
Correlations using SPSS
ย 
Multiple linear regression II
Multiple linear regression IIMultiple linear regression II
Multiple linear regression II
ย 
Linear regression analysis
Linear regression analysisLinear regression analysis
Linear regression analysis
ย 

ร„hnlich wie Alumni Donation - Complete exploration and analysis report

Supervised Machine learning Algorithm.pptx
Supervised Machine learning Algorithm.pptxSupervised Machine learning Algorithm.pptx
Supervised Machine learning Algorithm.pptxKing Khalid University
ย 
supervised-learning.pptx
supervised-learning.pptxsupervised-learning.pptx
supervised-learning.pptxGandhiMathy6
ย 
linear_regression_notes.pdf
linear_regression_notes.pdflinear_regression_notes.pdf
linear_regression_notes.pdfTamilarasiP13
ย 
University Ranking Variable Analysis
University Ranking Variable AnalysisUniversity Ranking Variable Analysis
University Ranking Variable AnalysisAlexa Chesser
ย 
Correlation and Regression Analysis using SPSS and Microsoft Excel
Correlation and Regression Analysis using SPSS and Microsoft ExcelCorrelation and Regression Analysis using SPSS and Microsoft Excel
Correlation and Regression Analysis using SPSS and Microsoft ExcelSetia Pramana
ย 
Predicting Alumni Donation Rate
Predicting Alumni Donation RatePredicting Alumni Donation Rate
Predicting Alumni Donation RateRavish Kalra
ย 
Module 2_ Regression Models..pptx
Module 2_ Regression Models..pptxModule 2_ Regression Models..pptx
Module 2_ Regression Models..pptxnikshaikh786
ย 
Chapter 08correlation
Chapter 08correlationChapter 08correlation
Chapter 08correlationghalan
ย 
Project 3
Project 3Project 3
Project 3Mia Attruia
ย 
Pearson Product Moment Coefficient Correlation (Pearson r).pptx
Pearson Product Moment Coefficient Correlation (Pearson r).pptxPearson Product Moment Coefficient Correlation (Pearson r).pptx
Pearson Product Moment Coefficient Correlation (Pearson r).pptxChristeusVonSujero1
ย 
Correlation and Regression ppt
Correlation and Regression pptCorrelation and Regression ppt
Correlation and Regression pptSantosh Bhaskar
ย 
probable-error.pdf
probable-error.pdfprobable-error.pdf
probable-error.pdfMadhanKumar10629
ย 
1624.pptx
1624.pptx1624.pptx
1624.pptxJyoti863900
ย 
10. The Pearson r and Spearman rho correlation coefficients ar.docx
10. The Pearson r and Spearman rho correlation coefficients ar.docx10. The Pearson r and Spearman rho correlation coefficients ar.docx
10. The Pearson r and Spearman rho correlation coefficients ar.docxhyacinthshackley2629
ย 
Exercise 29Calculating Simple Linear RegressionSimple linear reg.docx
Exercise 29Calculating Simple Linear RegressionSimple linear reg.docxExercise 29Calculating Simple Linear RegressionSimple linear reg.docx
Exercise 29Calculating Simple Linear RegressionSimple linear reg.docxAlleneMcclendon878
ย 
cannonicalpresentation-110505114327-phpapp01.pdf
cannonicalpresentation-110505114327-phpapp01.pdfcannonicalpresentation-110505114327-phpapp01.pdf
cannonicalpresentation-110505114327-phpapp01.pdfJermaeDizon2
ย 
Correlation Analysis PRESENTED.pptx
Correlation Analysis PRESENTED.pptxCorrelation Analysis PRESENTED.pptx
Correlation Analysis PRESENTED.pptxHaimanotReta
ย 
Correlation.pdf
Correlation.pdfCorrelation.pdf
Correlation.pdfTamilarasiP13
ย 
Correlation.pptx
Correlation.pptxCorrelation.pptx
Correlation.pptxShivakumar B N
ย 

ร„hnlich wie Alumni Donation - Complete exploration and analysis report (20)

Supervised Machine learning Algorithm.pptx
Supervised Machine learning Algorithm.pptxSupervised Machine learning Algorithm.pptx
Supervised Machine learning Algorithm.pptx
ย 
supervised-learning.pptx
supervised-learning.pptxsupervised-learning.pptx
supervised-learning.pptx
ย 
linear_regression_notes.pdf
linear_regression_notes.pdflinear_regression_notes.pdf
linear_regression_notes.pdf
ย 
University Ranking Variable Analysis
University Ranking Variable AnalysisUniversity Ranking Variable Analysis
University Ranking Variable Analysis
ย 
Correlation and Regression Analysis using SPSS and Microsoft Excel
Correlation and Regression Analysis using SPSS and Microsoft ExcelCorrelation and Regression Analysis using SPSS and Microsoft Excel
Correlation and Regression Analysis using SPSS and Microsoft Excel
ย 
Predicting Alumni Donation Rate
Predicting Alumni Donation RatePredicting Alumni Donation Rate
Predicting Alumni Donation Rate
ย 
Module 2_ Regression Models..pptx
Module 2_ Regression Models..pptxModule 2_ Regression Models..pptx
Module 2_ Regression Models..pptx
ย 
Chapter 08correlation
Chapter 08correlationChapter 08correlation
Chapter 08correlation
ย 
Project 3
Project 3Project 3
Project 3
ย 
Pearson Product Moment Coefficient Correlation (Pearson r).pptx
Pearson Product Moment Coefficient Correlation (Pearson r).pptxPearson Product Moment Coefficient Correlation (Pearson r).pptx
Pearson Product Moment Coefficient Correlation (Pearson r).pptx
ย 
Correlation and Regression ppt
Correlation and Regression pptCorrelation and Regression ppt
Correlation and Regression ppt
ย 
probable-error.pdf
probable-error.pdfprobable-error.pdf
probable-error.pdf
ย 
1624.pptx
1624.pptx1624.pptx
1624.pptx
ย 
12943625.ppt
12943625.ppt12943625.ppt
12943625.ppt
ย 
10. The Pearson r and Spearman rho correlation coefficients ar.docx
10. The Pearson r and Spearman rho correlation coefficients ar.docx10. The Pearson r and Spearman rho correlation coefficients ar.docx
10. The Pearson r and Spearman rho correlation coefficients ar.docx
ย 
Exercise 29Calculating Simple Linear RegressionSimple linear reg.docx
Exercise 29Calculating Simple Linear RegressionSimple linear reg.docxExercise 29Calculating Simple Linear RegressionSimple linear reg.docx
Exercise 29Calculating Simple Linear RegressionSimple linear reg.docx
ย 
cannonicalpresentation-110505114327-phpapp01.pdf
cannonicalpresentation-110505114327-phpapp01.pdfcannonicalpresentation-110505114327-phpapp01.pdf
cannonicalpresentation-110505114327-phpapp01.pdf
ย 
Correlation Analysis PRESENTED.pptx
Correlation Analysis PRESENTED.pptxCorrelation Analysis PRESENTED.pptx
Correlation Analysis PRESENTED.pptx
ย 
Correlation.pdf
Correlation.pdfCorrelation.pdf
Correlation.pdf
ย 
Correlation.pptx
Correlation.pptxCorrelation.pptx
Correlation.pptx
ย 

Kรผrzlich hochgeladen

Carero dropshipping via API with DroFx.pptx
Carero dropshipping via API with DroFx.pptxCarero dropshipping via API with DroFx.pptx
Carero dropshipping via API with DroFx.pptxolyaivanovalion
ย 
Best VIP Call Girls Noida Sector 39 Call Me: 8448380779
Best VIP Call Girls Noida Sector 39 Call Me: 8448380779Best VIP Call Girls Noida Sector 39 Call Me: 8448380779
Best VIP Call Girls Noida Sector 39 Call Me: 8448380779Delhi Call girls
ย 
Determinants of health, dimensions of health, positive health and spectrum of...
Determinants of health, dimensions of health, positive health and spectrum of...Determinants of health, dimensions of health, positive health and spectrum of...
Determinants of health, dimensions of health, positive health and spectrum of...shambhavirathore45
ย 
Log Analysis using OSSEC sasoasasasas.pptx
Log Analysis using OSSEC sasoasasasas.pptxLog Analysis using OSSEC sasoasasasas.pptx
Log Analysis using OSSEC sasoasasasas.pptxJohnnyPlasten
ย 
Edukaciniai dropshipping via API with DroFx
Edukaciniai dropshipping via API with DroFxEdukaciniai dropshipping via API with DroFx
Edukaciniai dropshipping via API with DroFxolyaivanovalion
ย 
FESE Capital Markets Fact Sheet 2024 Q1.pdf
FESE Capital Markets Fact Sheet 2024 Q1.pdfFESE Capital Markets Fact Sheet 2024 Q1.pdf
FESE Capital Markets Fact Sheet 2024 Q1.pdfMarinCaroMartnezBerg
ย 
Market Analysis in the 5 Largest Economic Countries in Southeast Asia.pdf
Market Analysis in the 5 Largest Economic Countries in Southeast Asia.pdfMarket Analysis in the 5 Largest Economic Countries in Southeast Asia.pdf
Market Analysis in the 5 Largest Economic Countries in Southeast Asia.pdfRachmat Ramadhan H
ย 
Zuja dropshipping via API with DroFx.pptx
Zuja dropshipping via API with DroFx.pptxZuja dropshipping via API with DroFx.pptx
Zuja dropshipping via API with DroFx.pptxolyaivanovalion
ย 
Call Girls in Sarai Kale Khan Delhi ๐Ÿ’ฏ Call Us ๐Ÿ”9205541914 ๐Ÿ”( Delhi) Escorts S...
Call Girls in Sarai Kale Khan Delhi ๐Ÿ’ฏ Call Us ๐Ÿ”9205541914 ๐Ÿ”( Delhi) Escorts S...Call Girls in Sarai Kale Khan Delhi ๐Ÿ’ฏ Call Us ๐Ÿ”9205541914 ๐Ÿ”( Delhi) Escorts S...
Call Girls in Sarai Kale Khan Delhi ๐Ÿ’ฏ Call Us ๐Ÿ”9205541914 ๐Ÿ”( Delhi) Escorts S...Delhi Call girls
ย 
Invezz.com - Grow your wealth with trading signals
Invezz.com - Grow your wealth with trading signalsInvezz.com - Grow your wealth with trading signals
Invezz.com - Grow your wealth with trading signalsInvezz1
ย 
CHEAP Call Girls in Saket (-DELHI )๐Ÿ” 9953056974๐Ÿ”(=)/CALL GIRLS SERVICE
CHEAP Call Girls in Saket (-DELHI )๐Ÿ” 9953056974๐Ÿ”(=)/CALL GIRLS SERVICECHEAP Call Girls in Saket (-DELHI )๐Ÿ” 9953056974๐Ÿ”(=)/CALL GIRLS SERVICE
CHEAP Call Girls in Saket (-DELHI )๐Ÿ” 9953056974๐Ÿ”(=)/CALL GIRLS SERVICE9953056974 Low Rate Call Girls In Saket, Delhi NCR
ย 
Midocean dropshipping via API with DroFx
Midocean dropshipping via API with DroFxMidocean dropshipping via API with DroFx
Midocean dropshipping via API with DroFxolyaivanovalion
ย 
BabyOno dropshipping via API with DroFx.pptx
BabyOno dropshipping via API with DroFx.pptxBabyOno dropshipping via API with DroFx.pptx
BabyOno dropshipping via API with DroFx.pptxolyaivanovalion
ย 
Ravak dropshipping via API with DroFx.pptx
Ravak dropshipping via API with DroFx.pptxRavak dropshipping via API with DroFx.pptx
Ravak dropshipping via API with DroFx.pptxolyaivanovalion
ย 
BigBuy dropshipping via API with DroFx.pptx
BigBuy dropshipping via API with DroFx.pptxBigBuy dropshipping via API with DroFx.pptx
BigBuy dropshipping via API with DroFx.pptxolyaivanovalion
ย 
Vip Model Call Girls (Delhi) Karol Bagh 9711199171โœ”๏ธBody to body massage wit...
Vip Model  Call Girls (Delhi) Karol Bagh 9711199171โœ”๏ธBody to body massage wit...Vip Model  Call Girls (Delhi) Karol Bagh 9711199171โœ”๏ธBody to body massage wit...
Vip Model Call Girls (Delhi) Karol Bagh 9711199171โœ”๏ธBody to body massage wit...shivangimorya083
ย 
Call Girls Indiranagar Just Call ๐Ÿ‘— 7737669865 ๐Ÿ‘— Top Class Call Girl Service B...
Call Girls Indiranagar Just Call ๐Ÿ‘— 7737669865 ๐Ÿ‘— Top Class Call Girl Service B...Call Girls Indiranagar Just Call ๐Ÿ‘— 7737669865 ๐Ÿ‘— Top Class Call Girl Service B...
Call Girls Indiranagar Just Call ๐Ÿ‘— 7737669865 ๐Ÿ‘— Top Class Call Girl Service B...amitlee9823
ย 
Call me @ 9892124323 Cheap Rate Call Girls in Vashi with Real Photo 100% Secure
Call me @ 9892124323  Cheap Rate Call Girls in Vashi with Real Photo 100% SecureCall me @ 9892124323  Cheap Rate Call Girls in Vashi with Real Photo 100% Secure
Call me @ 9892124323 Cheap Rate Call Girls in Vashi with Real Photo 100% SecurePooja Nehwal
ย 
Sampling (random) method and Non random.ppt
Sampling (random) method and Non random.pptSampling (random) method and Non random.ppt
Sampling (random) method and Non random.pptDr. Soumendra Kumar Patra
ย 

Kรผrzlich hochgeladen (20)

Carero dropshipping via API with DroFx.pptx
Carero dropshipping via API with DroFx.pptxCarero dropshipping via API with DroFx.pptx
Carero dropshipping via API with DroFx.pptx
ย 
Best VIP Call Girls Noida Sector 39 Call Me: 8448380779
Best VIP Call Girls Noida Sector 39 Call Me: 8448380779Best VIP Call Girls Noida Sector 39 Call Me: 8448380779
Best VIP Call Girls Noida Sector 39 Call Me: 8448380779
ย 
Determinants of health, dimensions of health, positive health and spectrum of...
Determinants of health, dimensions of health, positive health and spectrum of...Determinants of health, dimensions of health, positive health and spectrum of...
Determinants of health, dimensions of health, positive health and spectrum of...
ย 
Abortion pills in Doha Qatar (+966572737505 ! Get Cytotec
Abortion pills in Doha Qatar (+966572737505 ! Get CytotecAbortion pills in Doha Qatar (+966572737505 ! Get Cytotec
Abortion pills in Doha Qatar (+966572737505 ! Get Cytotec
ย 
Log Analysis using OSSEC sasoasasasas.pptx
Log Analysis using OSSEC sasoasasasas.pptxLog Analysis using OSSEC sasoasasasas.pptx
Log Analysis using OSSEC sasoasasasas.pptx
ย 
Edukaciniai dropshipping via API with DroFx
Edukaciniai dropshipping via API with DroFxEdukaciniai dropshipping via API with DroFx
Edukaciniai dropshipping via API with DroFx
ย 
FESE Capital Markets Fact Sheet 2024 Q1.pdf
FESE Capital Markets Fact Sheet 2024 Q1.pdfFESE Capital Markets Fact Sheet 2024 Q1.pdf
FESE Capital Markets Fact Sheet 2024 Q1.pdf
ย 
Market Analysis in the 5 Largest Economic Countries in Southeast Asia.pdf
Market Analysis in the 5 Largest Economic Countries in Southeast Asia.pdfMarket Analysis in the 5 Largest Economic Countries in Southeast Asia.pdf
Market Analysis in the 5 Largest Economic Countries in Southeast Asia.pdf
ย 
Zuja dropshipping via API with DroFx.pptx
Zuja dropshipping via API with DroFx.pptxZuja dropshipping via API with DroFx.pptx
Zuja dropshipping via API with DroFx.pptx
ย 
Call Girls in Sarai Kale Khan Delhi ๐Ÿ’ฏ Call Us ๐Ÿ”9205541914 ๐Ÿ”( Delhi) Escorts S...
Call Girls in Sarai Kale Khan Delhi ๐Ÿ’ฏ Call Us ๐Ÿ”9205541914 ๐Ÿ”( Delhi) Escorts S...Call Girls in Sarai Kale Khan Delhi ๐Ÿ’ฏ Call Us ๐Ÿ”9205541914 ๐Ÿ”( Delhi) Escorts S...
Call Girls in Sarai Kale Khan Delhi ๐Ÿ’ฏ Call Us ๐Ÿ”9205541914 ๐Ÿ”( Delhi) Escorts S...
ย 
Invezz.com - Grow your wealth with trading signals
Invezz.com - Grow your wealth with trading signalsInvezz.com - Grow your wealth with trading signals
Invezz.com - Grow your wealth with trading signals
ย 
CHEAP Call Girls in Saket (-DELHI )๐Ÿ” 9953056974๐Ÿ”(=)/CALL GIRLS SERVICE
CHEAP Call Girls in Saket (-DELHI )๐Ÿ” 9953056974๐Ÿ”(=)/CALL GIRLS SERVICECHEAP Call Girls in Saket (-DELHI )๐Ÿ” 9953056974๐Ÿ”(=)/CALL GIRLS SERVICE
CHEAP Call Girls in Saket (-DELHI )๐Ÿ” 9953056974๐Ÿ”(=)/CALL GIRLS SERVICE
ย 
Midocean dropshipping via API with DroFx
Midocean dropshipping via API with DroFxMidocean dropshipping via API with DroFx
Midocean dropshipping via API with DroFx
ย 
BabyOno dropshipping via API with DroFx.pptx
BabyOno dropshipping via API with DroFx.pptxBabyOno dropshipping via API with DroFx.pptx
BabyOno dropshipping via API with DroFx.pptx
ย 
Ravak dropshipping via API with DroFx.pptx
Ravak dropshipping via API with DroFx.pptxRavak dropshipping via API with DroFx.pptx
Ravak dropshipping via API with DroFx.pptx
ย 
BigBuy dropshipping via API with DroFx.pptx
BigBuy dropshipping via API with DroFx.pptxBigBuy dropshipping via API with DroFx.pptx
BigBuy dropshipping via API with DroFx.pptx
ย 
Vip Model Call Girls (Delhi) Karol Bagh 9711199171โœ”๏ธBody to body massage wit...
Vip Model  Call Girls (Delhi) Karol Bagh 9711199171โœ”๏ธBody to body massage wit...Vip Model  Call Girls (Delhi) Karol Bagh 9711199171โœ”๏ธBody to body massage wit...
Vip Model Call Girls (Delhi) Karol Bagh 9711199171โœ”๏ธBody to body massage wit...
ย 
Call Girls Indiranagar Just Call ๐Ÿ‘— 7737669865 ๐Ÿ‘— Top Class Call Girl Service B...
Call Girls Indiranagar Just Call ๐Ÿ‘— 7737669865 ๐Ÿ‘— Top Class Call Girl Service B...Call Girls Indiranagar Just Call ๐Ÿ‘— 7737669865 ๐Ÿ‘— Top Class Call Girl Service B...
Call Girls Indiranagar Just Call ๐Ÿ‘— 7737669865 ๐Ÿ‘— Top Class Call Girl Service B...
ย 
Call me @ 9892124323 Cheap Rate Call Girls in Vashi with Real Photo 100% Secure
Call me @ 9892124323  Cheap Rate Call Girls in Vashi with Real Photo 100% SecureCall me @ 9892124323  Cheap Rate Call Girls in Vashi with Real Photo 100% Secure
Call me @ 9892124323 Cheap Rate Call Girls in Vashi with Real Photo 100% Secure
ย 
Sampling (random) method and Non random.ppt
Sampling (random) method and Non random.pptSampling (random) method and Non random.ppt
Sampling (random) method and Non random.ppt
ย 

Alumni Donation - Complete exploration and analysis report

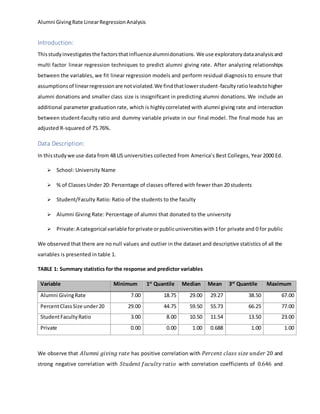
  • 1. Alumni GivingRate LinearRegressionAnalysis Introduction: Thisstudyinvestigatesthe factorsthatinfluencealumnidonations. We use exploratorydataanalysisand multi factor linear regression techniques to predict alumni giving rate. After analyzing relationships between the variables, we fit linear regression models and perform residual diagnosis to ensure that assumptionsof linearregressionare notviolated.We findthatlowerstudent-faculty ratioleadstohigher alumni donations and smaller class size is insignificant in predicting alumni donations. We include an additional parameter graduation rate, which is highlycorrelated with alumni giving rate and interaction between student-faculty ratio and dummy variable private in our final model. The final mode has an adjusted R-squared of 75.76%. Data Description: In thisstudywe use data from 48 US universities collected from Americaโ€™s Best Colleges, Year 2000 Ed. ๏ƒ˜ School: University Name ๏ƒ˜ % of Classes Under 20: Percentage of classes offered with fewer than 20 students ๏ƒ˜ Student/Faculty Ratio: Ratio of the students to the faculty ๏ƒ˜ Alumni Giving Rate: Percentage of alumni that donated to the university ๏ƒ˜ Private:A categorical variable forprivate orpublicuniversitieswith1for private and 0 for public We observed that there are no null values and outlier in the dataset and descriptive statistics of all the variables is presented in table 1. TABLE 1: Summary statistics for the response and predictor variables Variable Minimum 1st Quantile Median Mean 3rd Quantile Maximum Alumni GivingRate 7.00 18.75 29.00 29.27 38.50 67.00 PercentClassSize under20 29.00 44.75 59.50 55.73 66.25 77.00 StudentFacultyRatio 3.00 8.00 10.50 11.54 13.50 23.00 Private 0.00 0.00 1.00 0.688 1.00 1.00 We observe that ๐ด๐‘™๐‘ข๐‘š๐‘›๐‘– ๐‘”๐‘–๐‘ฃ๐‘–๐‘›๐‘” ๐‘Ÿ๐‘Ž๐‘ก๐‘’ has positive correlation with ๐‘ƒ๐‘’๐‘Ÿ๐‘๐‘’๐‘›๐‘ก ๐‘๐‘™๐‘Ž๐‘ ๐‘  ๐‘ ๐‘–๐‘ง๐‘’ ๐‘ข๐‘›๐‘‘๐‘’๐‘Ÿ 20 and strong negative correlation with ๐‘†๐‘ก๐‘ข๐‘‘๐‘’๐‘›๐‘ก ๐‘“๐‘Ž๐‘๐‘ข๐‘™๐‘ก๐‘ฆ ๐‘Ÿ๐‘Ž๐‘ก๐‘–๐‘œ with correlation coefficients of 0.646 and
  • 2. Alumni GivingRate LinearRegressionAnalysis โˆ’0.742 respectively. Further, ๐‘ƒ๐‘’๐‘Ÿ๐‘๐‘’๐‘›๐‘ก ๐‘๐‘™๐‘Ž๐‘ ๐‘  ๐‘ ๐‘–๐‘ง๐‘’ ๐‘ข๐‘›๐‘‘๐‘’๐‘Ÿ 20 and ๐‘†๐‘ก๐‘ข๐‘‘๐‘’๐‘›๐‘ก ๐‘“๐‘Ž๐‘๐‘ข๐‘™๐‘ก๐‘ฆ ๐‘Ÿ๐‘Ž๐‘ก๐‘–๐‘œ have a correlation of โˆ’0.786 which can lead to multicollinearity issues. Figure 1: Pairwise scatter plots of all the variables Figure 2: Box plot for Alumni Giving Rate, Percent class under 20 and Student-Faculty Ratio Methodology Researchshowsthat studentswhoare more satisfiedwiththeircontactwithteachersare more likelyto graduate. As a result, one might suspect that smaller class sizes and lower student-faculty ratios might leadtoa higherpercentageof satisfiedgraduates,whichinturnmightleadtoincreasesinthe percentage of alumni who donate. First,we fita linearregressionmodel withclasssizeandstudent-facultyratioaspredictors andour fitted regression equation is: ๐ด๐‘™๐‘ข๐‘š๐‘›๐‘– ๐‘”๐‘–๐‘ฃ๐‘–๐‘›๐‘” ๐‘Ÿ๐‘Ž๐‘ก๐‘’ฬ‚ = 39.66 + 0.17 โˆ— ๐‘ƒ๐‘’๐‘Ÿ๐‘๐‘’๐‘›๐‘ก ๐ถ๐‘™๐‘Ž๐‘ ๐‘  ๐‘†๐‘–๐‘ง๐‘’ ๐‘ข๐‘›๐‘‘๐‘’๐‘Ÿ 20ฬ‚ โˆ’ 1.7 โˆ— ๐‘†๐‘ก๐‘ข๐‘‘๐‘’๐‘›๐‘ก ๐‘“๐‘Ž๐‘๐‘ข๐‘™๐‘ก๐‘ฆ ๐‘Ÿ๐‘Ž๐‘ก๐‘–๐‘œฬ‚
  • 3. Alumni GivingRate LinearRegressionAnalysis From the results of hypothesis tests (๐ป0: ๐›ฝ0 = 0; ๐›ฝ1 = 0 ; ๐›ฝ2 = 0 ๐‘Ž๐‘›๐‘‘ ๐ป ๐‘Ž:๐›ฝ0 โ‰  0; ๐›ฝ1 โ‰  0 ; ๐›ฝ2 โ‰  0 : significance of the coefficients) we conclude ๐›ฝ0 and ๐›ฝ2 are significant and ๐›ฝ1is insignificant. Figure 3: Scatter plots grouped by public and private universities From figure 3, we observe that alumni donationforprivate andpublicschoolsare significantlydifferent. Now,we include the dummyvariable ๐‘๐‘Ÿ๐‘–๐‘Ž๐‘ฃ๐‘ก๐‘’ inour initial model. The fitted regression equations are: Private Schools: ๐ด๐‘™๐‘ข๐‘š๐‘›๐‘– ๐‘”๐‘–๐‘ฃ๐‘–๐‘›๐‘” ๐‘Ÿ๐‘Ž๐‘ก๐‘’ฬ‚ = 43.07 + 0.08 โˆ— ๐‘ƒ๐‘’๐‘Ÿ๐‘๐‘’๐‘›๐‘ก ๐ถ๐‘™๐‘Ž๐‘ ๐‘  ๐‘†๐‘–๐‘ง๐‘’ ๐‘ข๐‘›๐‘‘๐‘’๐‘Ÿ 20ฬ‚ โˆ’ 1.4 โˆ— ๐‘†๐‘ก๐‘ข๐‘‘๐‘’๐‘›๐‘ก ๐‘“๐‘Ž๐‘๐‘ข๐‘™๐‘ก๐‘ฆ ๐‘Ÿ๐‘Ž๐‘ก๐‘–๐‘œฬ‚ Public Schools: ๐ด๐‘™๐‘ข๐‘š๐‘›๐‘– ๐‘”๐‘–๐‘ฃ๐‘–๐‘›๐‘” ๐‘Ÿ๐‘Ž๐‘ก๐‘’ฬ‚ = 36.78 + 0.08 โˆ— ๐‘ƒ๐‘’๐‘Ÿ๐‘๐‘’๐‘›๐‘ก ๐ถ๐‘™๐‘Ž๐‘ ๐‘  ๐‘†๐‘–๐‘ง๐‘’ ๐‘ข๐‘›๐‘‘๐‘’๐‘Ÿ 20ฬ‚ โˆ’ 1.4 โˆ— ๐‘†๐‘ก๐‘ข๐‘‘๐‘’๐‘›๐‘ก ๐‘“๐‘Ž๐‘๐‘ข๐‘™๐‘ก๐‘ฆ ๐‘Ÿ๐‘Ž๐‘ก๐‘–๐‘œฬ‚ From the results of hypothesis tests (๐ป0: ๐›ฝ0 = 0; ๐›ฝ1 = 0 ; ๐›ฝ2 = 0; ๐›ฝ3 = 0 ๐‘Ž๐‘›๐‘‘ ๐ป ๐‘Ž: ๐›ฝ0 โ‰  0; ๐›ฝ1 โ‰  0 ; ๐›ฝ2 โ‰  0 ; ๐›ฝ3 โ‰  0 ), we conclude that only ๐›ฝ0 and ๐›ฝ2 are significant. The model Adjusted R squared is .5747, indicating the model is not much better than flipping a coin in terms of predicting power. Residual analysis: The QQ plot of model residuals vs fitted values indicate that normality assumption of error term is violated. When the residuals are plotted against ๐‘ƒ๐‘’๐‘Ÿ๐‘๐‘’๐‘›๐‘ก ๐‘๐‘™๐‘Ž๐‘ ๐‘  ๐‘ ๐‘–๐‘ง๐‘’ ๐‘ข๐‘›๐‘‘๐‘’๐‘Ÿ 20, the residuals show increasingvariance and against ๐‘†๐‘ก๐‘ข๐‘‘๐‘’๐‘›๐‘ก ๐‘“๐‘Ž๐‘๐‘ข๐‘™๐‘ก๐‘ฆ ๐‘Ÿ๐‘Ž๐‘ก๐‘–๐‘œ show constant variance. Thisis alignedwiththe results of NCV Test (๐ป ๐‘œ: ๐œŽ๐‘’ 2 = ๐œŽ2 ๐‘๐‘œ๐‘›๐‘ ๐‘ก๐‘Ž๐‘›๐‘ก ; ๐ป ๐‘Ž: ๐œŽ๐‘’ 2 โ‰  ๐œŽ2), with a large ๐‘-๐‘ฃ๐‘Ž๐‘™๐‘ข๐‘’ (0.29). We conclude that there is no issue of heteroscedasticity. The results of Durbin Watson Test indicate that there is no first order autocorrelation (๐ท โˆ’ ๐‘Š ๐‘†๐‘ก๐‘Ž๐‘ก๐‘–๐‘ ๐‘ก๐‘–๐‘ โˆถ 1.61378 ; ๐‘๐‘ฃ๐‘Ž๐‘™๐‘ข๐‘’ โˆถ 0.172).
  • 4. Alumni GivingRate LinearRegressionAnalysis Figure 4: Residual plots Outliers and Influential Points: Table 2: Measure Condition Outlier Y Outlier Studentizedresidual | ๐‘Ÿ๐‘—| โ‰ฅ 3 Princeton University X Outlier Leverage โ„Ž ๐‘– ๐‘— โ‰ฅ 2๐‘/๐‘› Boston College, U. of Washington, UCB Influential Point Cookโ€™s D ๐ท๐‘–~๐น๐‘,๐‘›โˆ’๐‘ NYU, Princeton,U of Florida,U. of Norte Dame, U. of Washington Afterremovingthe outliersandinfluencepoints,the adjustedR-squaredimproved from57.47% to 63.67. However, ๐›ฝ1, ๐›ฝ3 are still insignificant. Since, ๐‘ƒ๐‘’๐‘Ÿ๐‘๐‘’๐‘›๐‘ก ๐‘๐‘™๐‘Ž๐‘ ๐‘  ๐‘ ๐‘–๐‘ง๐‘’ ๐‘ข๐‘›๐‘‘๐‘’๐‘Ÿ 20 and ๐‘†๐‘ก๐‘ข๐‘‘๐‘’๐‘›๐‘ก ๐‘“๐‘Ž๐‘๐‘ข๐‘™๐‘ก๐‘ฆ ๐‘Ÿ๐‘Ž๐‘ก๐‘–๐‘œ are highlycorrelatedandthe coefficientof ๐‘ƒ๐‘’๐‘Ÿ๐‘๐‘’๐‘›๐‘ก ๐‘๐‘™๐‘Ž๐‘ ๐‘  ๐‘ ๐‘–๐‘ง๐‘’ ๐‘ข๐‘›๐‘‘๐‘’๐‘Ÿ 20 isinsignificant,we remove this predictorandfita newregressionmodel,withadjustedR-squaredimprovedto64.25%. Resultsof Partial F-test (table 3) also confirm that ๐‘ƒ๐‘’๐‘Ÿ๐‘๐‘’๐‘›๐‘ก ๐‘๐‘™๐‘Ž๐‘ ๐‘  ๐‘ ๐‘–๐‘ง๐‘’ ๐‘ข๐‘›๐‘‘๐‘’๐‘Ÿ 20 is insignificant as the p-value is large. Table 3: Partial F-Test results Model 1: Alumni.Giving.rate ~SFratio + Private Model 2: Alumni.Giving.rate ~Per.under.20+ SFratio + Private Res.Df RSS Df Sum of sq F Pr(>F) 38 1991.6 37 1971.2 1 20.477 0.3844 0.5391
  • 5. Alumni GivingRate LinearRegressionAnalysis The regression equation is: ๐ด๐‘™๐‘ข๐‘š๐‘›๐‘– ๐‘”๐‘–๐‘ฃ๐‘–๐‘›๐‘” ๐‘Ÿ๐‘Ž๐‘ก๐‘’ฬ‚ = 43.36 โˆ’ 1.61 โˆ— ๐‘†๐‘ก๐‘ข๐‘‘๐‘’๐‘›๐‘ก ๐‘“๐‘Ž๐‘๐‘ข๐‘™๐‘ก๐‘ฆ ๐‘Ÿ๐‘Ž๐‘ก๐‘–๐‘œฬ‚ + 5.53 โˆ— ๐‘ƒ๐‘Ÿ๐‘–๐‘ฃ๐‘Ž๐‘ก๐‘’ฬ‚ Discussion: For the final model, we included an additional variable ๐‘”๐‘Ÿ๐‘Ž๐‘‘_๐‘Ÿ๐‘Ž๐‘ก๐‘’, a variable part of original Americaโ€™s Best Colleges,Year2000 Ed dataset (withcorrelationcoefficientof 0.756 with ๐ด๐‘™๐‘ข๐‘š๐‘›๐‘– ๐‘”๐‘–๐‘ฃ๐‘–๐‘›๐‘” ๐‘Ÿ๐‘Ž๐‘ก๐‘’) to the initial data set and fitted a linear regression model with all other variables. The model adjusted R-squaredimproves to 69.79%. By adding an interaction parameter ๐‘†๐‘ก๐‘ข๐‘‘๐‘’๐‘›๐‘ก ๐‘“๐‘Ž๐‘๐‘ข๐‘™๐‘ก๐‘ฆ ๐‘Ÿ๐‘Ž๐‘ก๐‘–๐‘œ โˆถ ๐‘๐‘Ÿ๐‘–๐‘ฃ๐‘Ž๐‘ก๐‘’ model adjusted R-squared improves to 71.74%. All the regression coefficients are significant except for ๐‘†๐‘ก๐‘ข๐‘‘๐‘’๐‘›๐‘ก ๐‘“๐‘Ž๐‘๐‘ข๐‘™๐‘ก๐‘ฆ ๐‘Ÿ๐‘Ž๐‘ก๐‘–๐‘œ. Fitted Model ๐ด๐‘™๐‘ข๐‘š๐‘›๐‘– ๐‘”๐‘–๐‘ฃ๐‘– ๐‘› ๐‘” ๐‘Ÿ๐‘Ž๐‘ก๐‘’ฬ‚ = โˆ’24.39 โˆ’ 0.04 โˆ— ๐‘†๐‘ก๐‘ข๐‘‘๐‘’๐‘›๐‘ก ๐‘“๐‘Ž๐‘๐‘ข๐‘™๐‘ก๐‘ฆ ๐‘Ÿ๐‘Ž๐‘ก๐‘–๐‘œฬ‚ + 26.27 โˆ— ๐‘ƒ๐‘Ÿ๐‘–๐‘ฃ๐‘Ž๐‘ก๐‘’ฬ‚ โˆ’ 1.52 โˆ— ๐‘†๐‘ก๐‘ข๐‘‘๐‘’๐‘›๐‘ก ๐‘“๐‘Ž๐‘๐‘ข๐‘™๐‘ก๐‘ฆ ๐‘Ÿ๐‘Ž๐‘ก๐‘–๐‘œฬ‚ โˆ— ๐‘ƒ๐‘Ÿ๐‘–๐‘ฃ๐‘Ž๐‘ก๐‘’ฬ‚ + 0.53 โˆ— ๐‘”๐‘Ÿ๐‘Ž๐‘‘_๐‘Ÿ๐‘Ž๐‘ก๐‘’ Now,we fitaregressionmodelwithout ๐‘†๐‘ก๐‘ข๐‘‘๐‘’๐‘›๐‘ก ๐‘“๐‘Ž๐‘๐‘ข๐‘™๐‘ก๐‘ฆ ๐‘Ÿ๐‘Ž๐‘ก๐‘–๐‘œ,withmuchimprovedadjustedR-squared value of 75.76%. Residual diagnosis show that error terms follow normal distribution with constant variance (Shapiro-Wilk Test: p-value 0.16). Our final regression model is: ๐ด๐‘™๐‘ข๐‘š๐‘›๐‘– ๐‘”๐‘–๐‘ฃ๐‘–๐‘›๐‘” ๐‘Ÿ๐‘Ž๐‘ก๐‘’ฬ‚ = โˆ’25.32 + 26.92โˆ— ๐‘ƒ๐‘Ÿ๐‘–๐‘ฃ๐‘Ž๐‘ก๐‘’ฬ‚ โˆ’ 1.55 โˆ— ๐‘†๐‘ก๐‘ข๐‘‘๐‘’๐‘›๐‘ก ๐‘“๐‘Ž๐‘๐‘ข๐‘™๐‘ก๐‘ฆ ๐‘Ÿ๐‘Ž๐‘ก๐‘–๐‘œฬ‚ โˆ— ๐‘ƒ๐‘Ÿ๐‘–๐‘ฃ๐‘Ž๐‘ก๐‘’ฬ‚ + 0.54 โˆ— ๐‘”๐‘Ÿ๐‘Ž๐‘‘_๐‘Ÿ๐‘Ž๐‘ก๐‘’