Moe_Mentzel_SETAC_Pittsburgh_PesticidesInStreams_20221102_2300.pptx

We present a Northern European case study from the recent SETAC Pellston workshop on integration of global climate change (GCC) modeling into ecological risk assessment. In Northern Europe, global climate change (GCC) is expected to result in increased temperature and precipitation. The changes in weather patterns are expected to increase the occurrence of crop pests such as weeds, fungal disease and insect pests. Increased pest pressures can in turn be expected to then alter agricultural practices such as the frequency and combination of pesticide applications. Additionally, climate change may potentially have more direct effects on the environmental exposures in the transport, fate and degradation of pesticides. A Bayesian network (BN) has previously been developed as a meta-model for incorporating future climate projections and pesticide application scenarios with information from toxic effects data to support environmental risk assessment for streams in agricultural areas. This BN model was initially parameterized for a Norwegian case study with predicted environmental concentrations from a processed-based pesticide exposure model and species sensitivity distributions derived from toxicity tests data. Within the Pellston workshop, we aimed to improve the existing BN model by incorporating more recent and realistic climate change scenarios, a higher number of climate models, and better methods for regional downscaling. An exposure prediction model was run with alternative climate model that accounted for specific environmental factors linked to the study area, chemical properties of the pesticides, and more realistic pesticide application scenarios. Our experiences from this case study will aid efforts to better account for uncertainty related to climate change in exposure modeling, effect assessment, and risk characterization. The graphical display of the BN model approach can also aid communication of risk under climate change scenarios to stakeholders such as policy makers and regulators. The views expressed in this presentation are those of the authors and do not necessarily represent the views or policies of the U.S. Environmental Protection Agency.

Empfohlen
Empfohlen
Weitere ähnliche Inhalte
Ähnlich wie Moe_Mentzel_SETAC_Pittsburgh_PesticidesInStreams_20221102_2300.pptx
Ähnlich wie Moe_Mentzel_SETAC_Pittsburgh_PesticidesInStreams_20221102_2300.pptx (20)
Mehr von Jannicke Moe
Mehr von Jannicke Moe (6)
Kürzlich hochgeladen
Kürzlich hochgeladen (20)
Moe_Mentzel_SETAC_Pittsburgh_PesticidesInStreams_20221102_2300.pptx
- 1. Integration of Climate Model Projections and Pesticide Application Scenarios for Probabilistic Risk Assessment with a Bayesian Network Approach Jannicke Moe1, Sophie Mentzel1, Rasmus Benestad2, John F. Carriger3, John D. Hader4, Taro Kunimitsu5, Rory Nathan6, Rik Oldenkamp7, Andy Pitman8, Wayne G. Landis9 (1) Norwegian Institute for Water Research (NIVA), (2) Norwegian Meteorological Institute, (3) U.S. Environmental Protection Agency, Cincinnati, OH, (4) Stockholm University, Sweden, (5) Center for International Climate Research, Norway, (6) University of Melbourne, Australia, (7) Radboud University Nijmegen, Netherlands, (8) University of New South Wales, Australia, (9) Western Washington University, USA SETAC North America 43rd Annual Meeting, Pittsburgh 13-17 November 2022 Session 5.06: Continuing Discussions on Incorporating Climate Change Model Predictions into Ecological Risk Assessments Presentation 5.06.T-04
- 2. SETAC Pellston WORKSHOP Integrating Global Climate Change into Ecological Risk Assessment A case study from the SETAC Pellston Workshop Oslo, 20-23 June 2022:
- 3. Background for the workshop • Ecosystem damage by pollutants, together with habitat fragmentation and unsustainable use of natural resources, will increase ecosystem vulnerability to climate change globally, even within protected areas – Intergovernmental Panel on Climate Change (2022), 6th Assessment Report • Still, potential influence of climate change is often ignored in assessments of chemical pollution and risk – E.g. European Environment Agency (2018). Chemicals in European waters. • Better integration of climate science and risk assessment approaches needs – Suitable methodology – Handling of uncertainty – More collaboration across disciplines – climate modelling and ecotoxicology
- 4. Uncertainty wihtin one scenario Uncertainty across scenarios Uncertainty assessment in climate modelling vs. environmental risk assessment The Norwegian Centre for Climate Services (2017)
- 5. Uncertainty wihtin one scenario Uncertainty across scenarios Uncertainty assessment in climate modelling vs. environmental risk assessment https://www.setac.org/page/SETACTechPapers Environmental Risk Assessment of Chemicals (2018) PEC (single value) HC5, AF, PNEC (single values) Risk Quotient RQ = PEC/PNEC (single value) Descriptive? Binary? (yes/no) The Norwegian Centre for Climate Services (2017)
- 6. What is required for better integration of GCC & ERA? Ideally, we should • Use ensembles of Global Circulation Models, not single models – Projections from 30-100 models • Generate robust "climate information" from these projections – Probability distributions characterised by statistical properties • Downscale the climate information to the assessment region – Empirical-statistical and/or dynamical downscaling methods • Integrate with exposure and/or effect assessment, using probablistic methods – Bayesian networks (BN) as a tool for probabilistic modelling and communication
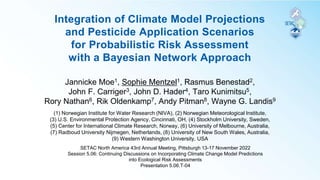
- 7. Approach: connecting climate information to pesticide exposure assessment with a Bayesian network model
- 8. Main components of a Bayesian network model Placeholder - Replace with more relevant figure from current case study Add notes
- 9. Case study: agricultural streams in South-East Norway • Case study of ECORISK2050 - Environmental risks of chemicals in the future – European Union Innovative Training Network – https://ecorisk2050.eu/ • Representing Northern Europe – Temperate / Subarctic climate zone • Pesticide application and run-off to streams • Purpose: Novel tools for risk assessment – Quantification of uncertainty in each step – Effects: probability distribution of PNEC or EC50 – Risk: probability of risk quotient (RQ) >1, or other threshold Add notes
- 10. Case study: pesticide exposure components • Pesticide exposure model – World Integrated System for Pesticide Exposure (WISPE) – Effects of temperature and precipitation on pesticide transportation, degradation etc. • Pesticides: – 2 herbicides (spring) – 2 fungicides (fall) • Pesticide application scenarios – Reference = 100% – Worst case: 150% (increased pest) – Best case: 50% (EU green deal) Add notes Check / fix
- 11. Case study: previous use of climate models Add notes • Use of existing climate projections – Source: EU project GENESIS (2009–2014) (https://cordis.europa.eu/project/id/226536) – 1 GHG emission scenario: A1B (IPCC 2000) – 2 Global circulation models: ECHAM5-r3 + HADCM3-Q0 – 1 Regional downscaling: SMHI-RCA3 – Daily projections for years 2000-2100 • All used as input for WISPE – Daily temperature, precipitation, etc. • Shortcomings – Old climate projections – Only one climate scenario – Only two climate models
- 12. SETAC Pellston Workshop on GCC & ERA: new approaches to integrating climate projections • Opportunity: new climate projections available from large ensemble of climate models – Norwegian Centre for Climate Services • Challenge: running process-based pesticide model (WISPE) for 100-1000 climate files – 4 scenarios x 100 GCMs x 2 downscaling methods x ... • Alternative to re-running of WISPE: – Re-use the existing WISPE model input & output – Explore the main relationships between climate, pesticide application and exposure – Quantify the functional relationships by equations or conditional probability tables for the BN model Placeholder, find original/better figure
- 13. Bayesian network model: main modules Add notes Online user interface to BN model under development: https://demo.hugin.com/example/PesticidesInStreams
- 14. BN model under development: tentative structure Update figure: - higher resolution - Add dashed arrows Online user interface to BN model under development: https://demo.hugin.com/example/PesticidesInStreams
- 15. BN model under development: example of use Update figure: - Update climate scenarios - higher resolution - Fix label nodes - Fix RQ states - Etc. Hide climate variables monitors (2) Selected pesticide application rate (1) Selected climate scenario and prediction period (3) Predicted Risk Quotient (probability distribution)
- 16. Ongoing & future work 1) Further analysis of functional relationships from simulations – E.g. effects of precipitation on probability & amount of run-off 2) Propose impacts of GCC on pesticide application – E.g. regional changes in growing season or pest pressures 3) Derive relevant climate information as probability distributions, in collaboration with climate modellers – E.g. probability of days with heavy precipitation (Benestad et al. 2019) – Sensitivity analysis: identify key variables, define boundaries etc. 4) Connect climate information to future climate scenarios 5) Develop a public online user interface to the BN model – Purpose: demonstration and exploration Add figures from Rik? Add something from John H?
- 17. Thank You to Our Sponsors
- 18. • Benestad R., et al. 2019. Using statistical downscaling to assess skill of decadal predictions. Tellus A: Dynamic Meteorology and Oceanography, 71(1), 1652882. DOI: http://doi.org/10.1080/16000870.2019.1652882 • Deser, C., Knutti, R., Solomon, S. et al. 2012. Communication of the role of natural variability in future North American climate. Nature Clim Change 2, 775–779. https://doi.org/10.1038/nclimate1562 • Mentzel, S. et al. 2002a. XXXX • Mentzel, S. et al. 2002b. XXXX • Moe, S.J., R.E. Benestad, W.G. Landis. 2022. Robust risk assessments require probabilistic approaches. IEAM XXX • NCCS [Norwegian Centre for Climate Services] 2017. Climate in Norway 2100 – a knowledge base for climate adaptation. NCCS report no. 1/2017 References To be completed
Hinweis der Redaktion
- Temperature increase in Europe since 1991 is >2x temperture increase globally: >0.5 degrees per decade https://www.nrk.no/nyheter/klima-og-miljo-1.12193804
- Source: https://www.met.no/kss/_/attachment/download/e1d26477-1c7c-4912-8af9-a2b20a0c084f:c615e5a9799582b64d52542878edf0d607d515dc/klimarapport-2100-engelsk-web-0160517.pdf
- For this case study, we have only attempted to link the climate information to exposure assessment. Any potential impacts of GCC on pesticide effects have been ignored so far. The roman numbers (I-VII) indicate the flow of information through the BN model, after it has been fully quantified and can be run for alternative scenarios (of climate, pesticide application etc.). However, the process of developing and quantifying the BN model goes in the opposite direction: starting with the variables needed for risk characterisation (VI,VII) and working our way backwards via pesticide exposure (V) and related physical/chemical processes (III-IV), to relevant regional climate information (II), and finally towards global emission scenarios and circulation models (I). Next: Illustrate what a BN is A brief presentation of the case study Explain the develoment of the BN, the current state and the next steps.
- https://www.nrk.no/nyheter/klima-og-miljo-1.12193804
- Obtaining new climate projections is easy Problem: connecting the climate projections to exposure via a process-based model Very high