1. M:FoodMicrobiology
&Safety
Mitochondrial DNA Fragmentation as a Molecular
Tool to Monitor Thermal Processing of
Plant-Derived, Low-Acid Foods, and Biomaterials
Jane M. Caldwell, Ilenys M. P´erez-D´ıaz, KP Sandeep, Josip Simunovic, Keith Harris, Jason A. Osborne, and Hosni M. Hassan
Abstract: Cycle threshold (Ct) increase, quantifying plant-derived DNA fragmentation, was evaluated for its utility
as a time-temperature integrator. This novel approach to monitoring thermal processing of fresh, plant-based foods
represents a paradigm shift. Instead of using quantitative polymerase chain reaction (qPCR) to detect pathogens, identify
adulterants, or authenticate ingredients, this rapid technique was used to quantify the fragmentation of an intrinsic
plant mitochondrial DNA (mtDNA) gene over time-temperature treatments. Universal primers were developed which
amplified a mitochondrial gene common to plants (atp1). These consensus primers produced a robust qPCR signal in
10 vegetables, 6 fruits, 3 types of nuts, and a biofuel precursor. Using sweet potato (Ipomoea batatas) puree as a model low-
acid product and simple linear regression, Ct value was highly correlated to time-temperature treatment (R2
= 0.87); the
logarithmic reduction (log CFU/mL) of the spore-forming Clostridium botulinum surrogate, Geobacillus stearothermophilus
(R2
= 0.87); and cumulative F-value (min) in a canned retort process (R2
= 0.88), all comparisons conducted at 121 °C.
D121 and z-values were determined for G. stearothermophilus ATCC 7953 and were 2.71 min and 11.0 °C, respectively.
D121 and z-values for a 174-bp universal plant amplicon were 11.3 min and 9.17 °C, respectively, for mtDNA from sweet
potato puree. We present these data as proof-of-concept for a molecular tool that can be used as a rapid, presumptive
method for monitoring thermal processing in low-acid plant products.
Keywords: mitochondrial DNA, quantitative PCR, thermal processing
Practical Application: This method could be used as another tool for thermal process validation and monitoring.
It is especially useful for thermal processes over 100 °C, since temperatures above boiling rapidly damage DNA. Its
advantages over enzymatic assays are that mtDNA is highly stable and can be stored at freezing temperatures for long
periods. Mitochondrial DNA can be used for all plant products tested. Processors will be able to validate processes and
track process deviations using rapid molecular methods. Processors can use this presumptive test prior to shipping out a
product.
Introduction
Mitochondria are organelles that supply power in the form
of ATP to eukaryotic cells. Foodstuffs, such as vegetables, nuts,
and fruits contain multiple intracellular copies of nonnuclear
DNA, mitochondrial DNA (mtDNA), which can be ampli-
fied via quantitative polymerase chain reaction (qPCR). Each
mitochondrion possesses its own genome in multiple copies
(Anderson and others 1981; Foury and others 1998). These
properties make mitochondrial DNA sequences (mtDNA) ex-
cellent targets for qPCR amplification in terms of specificity,
sensitivity, and robustness due to multiple copies per cell (ap-
proximately 1000) (Bogenhagen and Clayton 1974; Gerber and
others 2001; Andreasson and others 2002). Rapidly dividing,
continuous cell lines, such as HeLa cells, were found to have
MS 20150201 Submitted 2/3/2015, Accepted 5/13/2015. Authors Caldwell,
Sandeep, Simunovic, and Harris are with Dept. of Food, Bioprocessing, and Nutrition
Sciences, North Carolina State Univ., Raleigh, NC 27695, U.S.A. Author P´erez-
D´ıaz is with USDA-Agriculture Research Service, SAA, Food Science Research
Unit, 322 Schaub Hall-NCSU, Raleigh, NC 27695, U.S.A. Author Osborne is
with Dept. of Statistics, North Carolina State Univ., Raleigh, NC 27695, U.S.A.
Author Hassan is with Prestage Dept. of Poultry Science, North Carolina State
Univ., Raleigh, NC 27695, U.S.A. Direct inquiries to author Caldwell (E-mail:
jane.caldwell@transagra.com).
four times the amount of mtDNA as mouse L cells (Bogen-
hagen and Clayton 1974). Therefore, the advantages of targeting
mtDNA in living and respiring plant-derived foods with qPCR are
substantial.
mtDNA genes are used as identifiers in many scientific disci-
plines. They have been adopted for bar-coding almost all groups
of higher animals (http://www.barcoding.si.edu/). mtDNA is also
used in human typing for forensic analysis (Hopwood and others
1996; Andreasson and others 2002; Budowle and others 2003) us-
ing tissues such as bones, teeth, and hair shafts for DNA extraction.
mtDNA primers/probes have been developed for source track-
ing fecal contaminates in wastewater influents and effluents using
multiplex qPCR (Caldwell and others 2007; Caldwell and Levine
2009; Caldwell and others 2011). In the food industry, PCR-
based mtDNA analyses were used in the authentication of meats
and to trace contamination of other animals in the food prod-
ucts (Meyer and Candrian 1996; Lahiff and others 2001; Zhang
and others 2007; Fujimura and others 2008). The development of
these molecular tools has improved the monitoring of food quality,
preventing fraudulent description of food content, and identifying
adulterants. The commercial success of using mtDNA as identifiers
in heterogeneous food matrices led to the idea of using intrinsic
foodstuff mtDNA as indicators of thermal processing efficacy.
The drastic effect of high temperature on DNA degradation
is well established. Above 100 °C, denaturation, depurination,
C 2015 Institute of Food Technologists R
doi: 10.1111/1750-3841.12937 Vol. 00, Nr. 0, 2015 r Journal of Food Science M1
Further reproduction without permission is prohibited
2. M:FoodMicrobiology
&Safety
mtDNA fragmentation as thermal monitor . . .
deamination, and loss of secondary structure occurs (Gryson
2010). However, autoclaving a foodstuff at 121 °C for 15 min
does not destroy all DNA available for PCR (Lipp and others
1999). Other researchers have reported reduced recovery of DNA
via qPCR from cornmeal boiled for 60 min at 100 °C (Murray and
others 2007). Increased Ct (threshold cycles) values occurred in
DNA from heat-treated corn grits and corn flour when compared
to untreated corn and resulted in distortions of qPCR assays for
detection of genetically modified organisms (Moreano and others
2005). Therefore, DNA is degraded but still detectable by qPCR,
when using thermal processing techniques suitable for preserving
vegetables and fruits.
The effect of heat treatments on the quantification and detec-
tion of meat DNA by qPCR was found to be dependent on the
temperature and duration of the treatment, as well as the size of
the amplicon (Sakalar and others 2012). Smaller amplicons were
less likely to be affected by heat treatment and the degree of
DNA fragmentation was directly correlated to time and tempera-
ture (Sakalar and others 2012). A relationship between amplicon
size and detection after heat treatment or mechanical processing
was cited in other meat assays (Hird and others 2006) and plant
products, such as soybeans, maize, peas, and white potatoes (Bauer
and others 2003; Kharazmi and others 2003; Hrncirova and others
2008).
Thermal validation and monitoring can employ microbial cul-
ture methods for verification of sterility (Pflug and others 1980;
Smith and Kopelman 1982; Marcy 1997; Guan and others 2003).
For low-acid products (pH 4.6 to 6.0) the target organism is
the Clostridium botulinum spore (Pflug and others 1985) due to
its heat resistance and the catastrophic effects of its toxin when
ingested. The minimum botulinum cook has been determined
based on a D-value of 0.21 min at 121 °C (Esty and Meyer 1922;
Townsend and others 1938; Stumbo 1965). For the canning indus-
try to achieve a 12-log reduction (12D) for a low-acid product,
the convention is to round up to an F0 of 3 min (Tucker and
others 2008), F being the cumulative time-temperature treatment
at 121 °C. Destruction of spore-forming C. botulinum surrogates
such as Geobacillus stearothermophilus have been used to monitor
heat processes in low-acid foods such as sweet potato puree (Smith
and Kopelman 1982; Brinley and others 2007; Steed 2010). Prob-
lems with using a culture approach include tracking and recovering
surrogate spores, and time required to culture (48 h). Molecular
methods, such as qPCR, are able to detect spores and vegetative
bacteria but are unable to differentiate between live and dead cells.
Other biological techniques such as enzymes have been used or
proposed as time-temperature indicators: Beta-glucosidase from
Pyrococcus furiosus (Yen 2009), alpha-amylase from B. licheniformis
(De Cordt and others 1994; Guiavarch and others 2004) or B.
subtilis (Guiavarch and others 2005), algal R-phycoerythrin (Smith
and others 2002; Orta-Ramirez and others 2001), glucose oxidase
(Reyes-De-Corcuera and others 2005), and endogenous muscle
proteins such as lactate dehydrogenase in meats (Veeramuthu and
others 1998) and alkaline phosphatase and lactoperoxidase in milk
(Claeys and others 2004). Advantages of using endogenous DNA,
intrinsic to the plant food, over enzymes are many. DNA is more
stable than protein enzymes and can be stored for long time periods
at −20 °C. Therefore, one can return and assay the process at a later
date, thus having a record of past events. Most enzyme techniques
are extrinsic to the process and invasive. Enzymes must be added
or containerized then recovered from the system. A great deal of
energy is exerted to find the proper carrier for the exogenous
enzyme (De Cordt and others 1994; Guiavarch and others 2004;
Table 1–Initial quantitative PCR primers tested.
Primer name Sequence
174F (forward) 5 –TTTCCGCGATAATGGAATGCACGC-3
174R (reverse) 5 –TCCGATCGTTTAGCCGCTCTTTCT-3
108F (forward) 5 –CGCCTTTGCTCAATTTGGCTCAGA-3
108R (reverse) 5 –GGCAGTGGTGCATATTGTGGTTGT-3
81F (forward) 5 –CGCCTTTGCTCAATTTGGCTCAGA-3
81R (reverse) 5 –AGTACTTCTGTCAGCCTTGCACCT-3
141F (forward) 5 –GAATTTGCCAGCGGTGTGAAAGGA-3
141R (reverse) 5 –TCCCGCAGGAACATCCACAATAGA-3
Reyes-De-Corcuera and others 2005; Wang and others 2010).
Endogenous enzymes are specific to the product and not universal
like DNA.
Quantitative PCR has several advantages over culture tech-
niques and conventional PCR: it is rapid (4 to 6 h), does not
require gels or plates and is directly measurable in real time. For
this study, all mtDNA qPCR assays developed met minimum in-
formation for publication of quantitative real-time PCR experi-
ments (MIQE) guidelines (Bustin and others 2009) which features
a quality control checklist. Conformity to MIQE guidelines makes
qPCR operator- and laboratory-independent and allows compar-
isons between results from different production runs and different
locations.
Because of the many advantages of using intrinsic mtDNA from
foodstuffs directly, we propose monitoring and process validation
of thermally processed low-acid plant foods using mitochondrial
DNA fragmentation via qPCR by graphing its thermal destruction
over time. This approach to monitoring food safety represents
a paradigm shift by using qPCR to quantify the fragmentation
of foodstuff mtDNA over time due to thermal processing, and
compare the kinetics of this protocol to the D- and z-values of
spore-forming bacteria.
Materials and Methods
Primer design and validation
Primers were designed using consensus sequences to target a
wide variety of plant foods. Four sets of qPCR primers were de-
signed with Primer Quest software (http://scitools.idtdna.com/
Primerquest/) targeting the Ipomoea batatas F1-ATPase alpha
subunit (atp1) mitochondrial gene (GenBank AY596672.1).
Amplicons for primer sets ranged from 81 to 174 base
pairs (Table 1). Four primer sets were purchased from IDT
(http://www.idtdna.com). Oligonucleotide primers were recon-
stituted in TE buffer (pH 7.5) and stored at -20 °C prior to use. All
primer sets matched the atp1 gene with 100% identity, not only
in I. batatas, but in a wide range of common fruits and vegetables
when subjected to NCBI BLAST searches
Standard curve
Standard curves were generated using gBlocksTM
Gene Frag-
ments (https://www.idtdna.com/pages/products/genes/gblocks
-gene-fragments) which are double-stranded, sequence-verified
oligonucleotides of the atp1 gene. Tenfold serial dilutions of atp1
copies (108
to 101
) were performed and PCR amplification effi-
ciency (E) was determined using the slope of the standard curve:
E= (10−1/slope
) − 1.
M2 Journal of Food Science r Vol. 00, Nr. 0, 2015
3. M:FoodMicrobiology
&Safety
mtDNA fragmentation as thermal monitor . . .
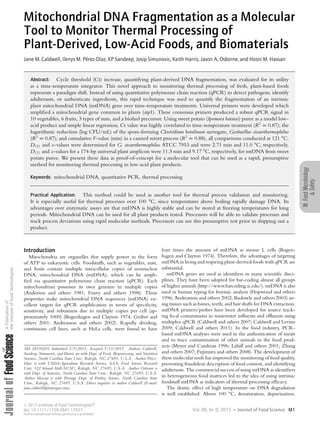
Data analysis of the qPCR standard curve was performed us-
ing goodness-of-fit linear regression correlation coefficient (R2
)
(Figure 1).
Assessing universality of primers
The atp1 gene was found to be highly conserved among plant
species. Primers were created which could be used universally to
test plant-based foods, both singly and in mixtures, such as soups
(Table 1). Fresh, uncooked fruits, vegetables, and nuts were pur-
chased from a retail grocery store and processed immediately by
grinding in a Hamilton Beach coffee mill. The mill was thorough
cleaned with distilled water and 70% ethanol between samples and
reps to prevent DNA cross-contamination. Three separate individ-
uals were used for each variety of plant tested. Six reps were tested
in all, 3 uncooked controls and 3 autoclave treatments (20 min at
121 °C). The tissue culture protocol of the MasterPure DNA pu-
rification kit (Epicentre, Madison, Wis., U.S.A.) was used. DNA
was quantified and qualified using a spectrophotometer (Nan-
odrop, Wilmington, Del., U.S.A.). DNA was normalized to 5 to
10 ng/well using the qPCR assay as below. Each sample was run
in duplicate wells. Mean Ct values for uncooked and autoclaved
plant materials were recorded as well as the increase of Ct due to
autoclave treatment and the slope of the line formed by the graph
of the 2 values (Table 2).
Sweet potato puree
Sweet potato puree was prepared according to the method of
Truong and Walter 1994. Briefly, sweet potatoes were cured and
stored at 13 to 16 °C and 80% to 90% relative humidity prior to use.
Roots were washed and peeled by immersion in a boiling solution
of 5.5% NaOH for 4 min. Peeled roots were hand trimmed and
cut into slices, then steam-cooked for 20 min in a thermo-screw
cooker (Rietz Manufacturing co., Santa Rosa, Calif., U.S.A.) and
reduced in size in a hammer mill (Model D, Fitzpatrick Co.,
Chicago, Ill., U.S.A.) with a 0.15 cm screen. The puree was stored
in polyethylene bags at −20 °C until used in thermal trials.
Sporulation
Lyophilized G. stearothermophilus (NRRL No. B-1102, equiv-
alent to ATCC 7953) was obtained from the ARS Culture Col-
lection (USDA-ARS; Peoria, Ill., U.S.A.), reconstituted, veri-
fied by microscopy and Gram-staining, and placed in freezer
stocks containing 20% glycerol. To sporulate, 10 mL BHI broth
Log10copy number mtDNA gene
0 2 4 6 8 10
Ct
0
5
10
15
20
25
30
35
40
y = -3.1909 + 38.091
R2
= 0.9884
Figure 1–Mitochondrial DNA qPCR standard curve for 174 bp amplicon.
(Becton Dickinson, Sparks, Md., U.S.A.) was inoculated directly
from freezer stocks or 1% volume from liquid culture and incu-
bated overnight at 55 °C, static. Bacillus heat resistant agar contain-
ing 13 g nutrient broth, 0.51 g MgSO4(7H2O), 0.97 g KCl, 0.2
g CaCl2(2H2O), 0.003 MnSO4(H2O), 0.00055 g FeSO4(7H2O),
and 15 g agar brought up to 1 L with distilled water and auto-
claved (Stam 2008), was spread with 100 μL overnight culture.
Over 20 plates were spread in this fashion. Plates were incubated
at 55 °C for 5 d. Spores were harvested by applying 10 mL cold,
sterile, distilled H2O containing 0.1% Tween 80 (Sigma-Aldrich;
St. Louis, Mo., U.S.A.) directly to each plate and scraping with
a sterile cell scraper (van Melis and others 2011). The resulting
liquid, containing both vegetative cells and spores, was aspirated
from plates via modified pipette tip and placed in 50 mL centrifuge
tubes and spun at 6000× g for 10 min at 4 °C. Enzymatic clean-
ing to eliminate vegetative cells (modified from Foegeding and
Busta 1983) was performed by adding lysozyme (200 mg/mL) to
each 200 mL spore pellet and incubating at 45 °C for 30 min
with occasional vortexing, then adding trypsin (final volume; 100
mg/mL) and incubating at 45 °C for an additional 2 h with oc-
casional vortexing. Spore solutions were rinsed 10× with 25 mL
cold water/0.1% Tween 80 (6000× g for 10 min at 4 °C). After
a final spin, spores were re-suspended in 10 mL water/Tween 80
solution. Spores were evaluated by dark phase microscopy with a
target ratio of spores to vegetative cells of 9:1 or greater. Spores
were stored at 4 °C long term, but centrifuged and re-suspended
weekly to maintain and prevent germination.
Hot oil bath trials
In an effort to mimic and quantify values in a 12D thermal
process, the reduction curve of G. stearothermophilus (C. botulinum
surrogate) spores with resulting D- and z-values were compared
to Ct values of sweet potato puree in a hot oil bath at the
following temperatures: 116, 121, 123, and 126 °C. A hot oil
bath (EW-111, Neslab Instruments, Newington, N.H., U.S.A.)
filled with 8 L white mineral oil (Therminol XP, Solutia, Inc, St.
Louis, Mo., U.S.A.) was used to maintain each target tempera-
ture for substances placed in a thermal death tube (TDT). This
laboratory system was used to replicate conditions in an industrial
retort, heat exchanger, or microwave thermal process. The TDT
was composed of a ¾ inch aluminum screw post (Screwpost.com,
Muskegon, Mich., U.S.A.) cut to size and filed for smoothness,
¼ inch nylon machine screws, Viton fluoroelastomer O-ring gas-
kets (screw size #6) and Viton flat washers size #6 (all parts from
McMaster-Carr, Atlanta, Ga., U.S.A.). Oil bath temperature was
monitored using a type J-K-T microprocessor thermometer ther-
mocouple (HH23A, Omega, Stamford, Conn., U.S.A.) and type T
1/8” diameter insertion probe (50335-T; Atkins Technical, Inc.;
Gainesville, FL, U.S.A.). Come up time (CUT) for TDTs was
determined for all target temperatures by inserting and sealing
a 0.0095 inch diameter probe into the vessels (30 s). In each
TDT, 100 μL of 1:4 diluted puree or 100 μL of G. stearother-
mophilus spores (ca. 108
CFU/mL) were inserted and sealed. For
G. stearothermophilus spores, samples were heated for 0, 4, 8, and
12 min at 116 °C; 0, 0.5, 1, 2, 4, 8, 16, and 20 min at 121 °C; 0,
1, 2, and 4 min at 123 °C; 0, 0.5, 1, 2, and 4 min at 126 °C, all
heat treatments beginning after CUT. Samples for diluted purees
were heated for 0, 12, 24, 48, and 60 min at 116 °C and 0, 4, 8,
12, and 18 min at 121, 123, and 126 °C, also taking into account
the CUT. Three replicates were run per time point: 3 TDTs were
placed in a metal tea strainer to facilitate removal of samples from
hot oil. Strainers containing TDTs were taken out of oil bath and
Vol. 00, Nr. 0, 2015 r Journal of Food Science M3
4. M:FoodMicrobiology
&Safety
mtDNA fragmentation as thermal monitor . . .
Table 2–Universality of primers (174 bp amplicon) and demonstration of mtDNA fragmentation (increase in Ct value) across
different plant materials after autoclave treatment.
Mean uncooked Mean autoclaved
Sample Ct Ct Difference Slope
Vegetables
White potato 19.73 ± 0.45∗∗ 32.77 ± 0.40 13.04 0.65
Sweet potato puree 24.06 ± 0.18 33.00 ± 0.07 8.90 0.45
Tomato 18.86 ± 0.12 32.27 ± 0.75 13.41 0.67
Green pepper 19.45 ± 0.28 35.66 ± 1.89 16.21 0.81
Red pepper 18.99 ± 0.20 34.63 ± 1.17 15.65 0.78
Jalapeno pepper 19.96 ± 0.23 35.66 ± 0.45 15.70 0.79
Carrot 15.71 ± 0.07 32.45 ± 0.14 16.74 0.84
Green bean 22.45 ± 0.17 32.38 ± 0.27 9.93 0.50
Corn 22.40 ± 0.30 27.24 ± 0.31 4.84 0.24
Cucumber 18.47 ± 0.12 29.88 ± 0.15 11.40 0.57
Biofuels
Switch grass 28.26 ± 0.16 34.69 ± 0.23 6.43 0.32
Fruits
Apple 22.95 ± 0.73 36.27 ± 1.95 13.32 0.67
Blueberry 25.88 ± 2.18 35.51 ± 3.60 9.63 0.48
Peach 20.93 ± 0.17 37.52 ± 0.49 16.60 0.83
Strawberry 23.27 ± 0.18 33.17 ± 0.80 9.90 0.50
Pineapple 22.97 ± 0.70 33.31 ± 2.72 10.35 0.52
Grape 27.95 ± 0.18 32.11 ± 1.11 4.16 0.21
Nuts
Peanut∗ 17.00 ± 0.21 23.10 ± 0.92 6.10 0.32
Almond 18.31 ± 0.18 27.25 ± 0.17 8.94 0.45
Pecan 25.86 ± 0.27 31.43 ± 0.28 5.57 0.28
∗
Roasted at 167 °C for 19 min. All others autoclaved at 121 °C for 20 min. ∗∗
Standard deviation.
immediately placed in an ice slurry for 30 s to quickly cool them.
Strainers were stored at room temperature until ready for DNA
extraction or culture plating. Total amount of sweet potato puree
recovered from hot oil bath treatment was determined from an
initial sample of 100 μL.
The D-value (decimal reduction time) is defined as the time in
minutes at a given temperature that results in a one log reduction in
microbial count (Sandeep, personal communication; Pflug 1990).
Given the equation:
N = N010−t/D
T,
where N0 and N are the initial and final number of microor-
ganisms, respectively, the D-value at a given temperature (DT) is
calculated by graphing the log10 number of microorganisms over
time (min) and determining the slope: slope = − 1/DT.
The z-value is the temperature change required for a one log
change in the D-value of a microorganism (Sandeep, personal
communication; Pflug 1990). Given the equation
DT = Dref 10Tref−T/z
the z-value is calculated by graphing log D-value (s) versus tem-
perature and determining the slope: slope = − 1/z.
G. stearothermophilus spores were serially diluted and plated with
a spiral plater (Spiral Biotech Inc., Norwood, Mass., U.S.A.) or
a simplified agar plate technique (Jett and others 1997); both on
BHI agar (Becton Dickinson). After 24 h incubation at 55 °C,
colonies were enumerated with an automated spiral plate counter
(Q-count, Spiral Biotech Inc) or counted manually. The lower
detection limits were 4 × 10²
and 1 × 10³
CFU/mL for the spiral
plate and simplified agar technique, respectively.
Ct values were converted to log10 copy numbers using the linear
relationship determined empirically from the standard curve of the
174 bp amplicon (Figure 1):
y = −3.1909x + 38.091,
where y is the Ct value and x is the log10 copy number. A flow
chart (Figure 2), illustrates the steps to determine and compare the
D- and z-values of the G. stearothermophilus spores with mtDNA
fragmentation ( Ct converted to log10 copy number) of the low-
acid purees.
Retort trials
Sweet potato puree was produced as before and placed in
68.3 × 101.6 mm cans outfitted with T-type C-2 tube and
rod thermocouples (Ecklund-Harrison Technologies, Fort Myers,
Fla., U.S.A.). Colorimetric G. stearothermophilus ampoules (Raven
ProSpore; Mesa Laboratories, Inc., Lakewood, Colo., U.S.A.) were
placed in the center of each can, adjacent to the thermocou-
ple probes. Cans were sealed with a double seam using an auto-
mated can sealer (Dixie Canner Co., Athens, Ga., U.S.A.). Total
weights of puree and size of head space were similar between all
cans in each run. Canned sweet potato puree was loaded into a
Model PR-900 pilot retort (Stock sterilisationstechnik, Herman-
stock Maschf.; Neumunster, West Germany) with thermocouples
attached to a recording device and run in one of 2 full water
immersion protocols listed below. Protocol 00 was a substandard
treatment not meant to kill spores (Appendix A: Supporting In-
formation). Protocol 01 was a > 6D protocol meant to eliminate
all G. stearothermophilus test spores (Appendix B: Supporting In-
formation). Each protocol was run in triplicate using 3 cans per
run. Puree was sampled from the center of each can by carefully
removing the top layers with a spatula and taking a 500 μL aliquot
next to the thermocouple probe. DNA was extracted from this
centrally located aliquot and atp1 qPCR protocol run as before.
M4 Journal of Food Science r Vol. 00, Nr. 0, 2015
5. M:FoodMicrobiology
&Safety
mtDNA fragmentation as thermal monitor . . .
ProSpore (Mesa Laboratories) ampoules were incubated at 55 °C
for 48 h as recommended by the supplier, and then assessed for
colorimetric change. F-values were determined from the time-
temperature data collected. F-value was calculated as follows:
F = 10((T−121.1)/10)
t,
where T is temperature in °C and t is time in minutes. Ct values
were correlated to F-values of all runs.
Retort data statistics
To determine the cumulative F-value that corresponds to a
given Ct value, the method of inverse prediction was used. This
methodology enables the assessment of uncertainty associated with
estimation of an unknown cumulative F-value. A linear regression
of Y = CT on X = cum F was fit (with R2
= 0.875) to m =
21 bivariate measurements, (y1; x1), . . . , (y21; x21). The estimated
value of X = X0 that corresponds to a given measurement of y =
y0 is given by
ˆX0 =
y0 − ˆβ0
ˆβ1
,
where( ˆβ0, ˆβ1) denote the estimated intercept and slope from the
regression. The standard error for this nonlinear function of re-
gression coefficients may be approximated by
Figure 2–Flow chart of mitochondrial DNA fragmentation protocol.
Vol. 00, Nr. 0, 2015 r Journal of Food Science M5
6. M:FoodMicrobiology
&Safety
mtDNA fragmentation as thermal monitor . . .
Table 3–Inverse prediction statistics for retort process validation
showing samples needed for low standard errors.
99% Confidence
levels
Samples needed Standard error (%) Upper Lower
32 2.3 4.66 5.33
64 1.6 4.76 5.23
128 1.2 4.83 5.16
256 0.8 4.88 5.11
SE( ˆX0) =
MS(E)
ˆβ2
1
1
m
+
( ˆX0 − ¯X)
2
(Xi − ¯X)
2
,
where MS(E) denotes the error mean square from the regres-
sion. This error mean square is an estimate of the error vari-
ance in a single measurement of Y. An approximate, symmetric
100(1 − alpha)% confidence interval (Neter and others 1983) for
the average X0 that would give rise to Y0, is given simply by
ˆX0 ± t(α/2, m − 2)SE( ˆX0).
An alternative procedure is to find the values of X which satisfy
the inequality
y0 − ( ˆβ0 + ˆβ1x0)
SE( ˆβ0 + ˆβ0 + ˆβ1x0)
2
≤ t(α/2, m − 2)2
.
These values may be obtained using the quadratic formula and
constitute an asymmetric confidence interval. This is the method
used by the JMP statistical software package (SAS; Cary, NC,
U.S.A.). For the pilot data, with m = 21, the computations were
carried out using SAS (and checked for agreement with JMP), and
then different numbers of subsamples N at a given value of y0 =
26.2 were considered (corresponding to a cumulative F-value of
5 min). For N (subsample), the MS(E) term in the formulas above
was replaced by MS(E)/N, and 99% confidence intervals are given
in Table 3.
DNA extraction
Total DNA from treated sweet potato puree was extracted by
either a MoBioPowerSoil
R
DNA isolation kit (Carlsbad, Calif.,
U.S.A.) or MasterPure DNA extraction kit (Epicentre, Madison,
Wis., U.S.A.), both used according to manufacturer’s recommen-
dations. DNA samples were analyzed by spectrophotometer (Nan-
odrop, Wilmington, Del., U.S.A.) for quantity and quality (260
& 280 nm). For qPCR, DNA was normalized by concentration:
between 5 and 10 ng/μL per reaction.
qPCR
qPCR was run in 25 μL total volume with 2X IQ SYBR Green
supermix (SYBR Green I dye, 50 U/mL iTaq DNA polymerase,
0.4 mM each of dATP, dCTP, dGTP, and dTTP, 6 mM MgCl2,
40 mMTris-HCl, pH 8.4, 100 mM KCl, 20 nM fluorescein; Bio-
Rad, Hercules, Calif., U.S.A.), 300 nM final concentration each
for forward and reverse primers (F1 atp1), vegetable puree DNA
(5 to 10 ng/reaction) and RT-PCR water (Ambion, Austin, Tex.,
U.S.A.) to final volume. Amplifications were performed in a MyiQ
(BioRad) thermal cycler with the following conditions: 95.0 °C
for 3 min; 40 cycles of 95.0 °C for 30 s, 60.0 °C for 30 s,
72.0 °C for 30 s; with FAM channel optics on during exten-
sion stage. MIQE standards were employed for the optimization
and validation of the qPCR assay (Bustin and others 2009). No
template (NTC) and positive controls were used for all assays. For
a sample to be considered positive, its Ct value must be less than
all negative control reactions and its corresponding amplification
curve had to exhibit the 3 distinct phases of real-time PCR: lag,
linear, and plateau. Internal amplification controls were not em-
ployed as no PCR inhibition was apparent. The positive control
was used to normalize data between assays. Ct values were used to
create D- and z-values across target temperatures indicated. These
values were compared to similar values for spore death.
Results and Discussion
Universal primers
More than 3 million mtDNA sequences are available at the Na-
tional Center for Biotechnology Information genome web page
(3,181,082 sequences as of June 2014) (www.ncbi.nlm.nih.gov)
including partial mtDNA genomes for sweet potato, carrot, potato,
green beans, strawberry, apple, and other common fruits and veg-
etables. The results of the comparative analysis between the rape-
seed and Arabidopsis mitochondrial genomes suggest that sequences
among higher plants are highly conserved (Handa 2003), thus hav-
ing many similar sequences to target for consensus qPCR. The
goal was to create a set of primers based on consensus sequences
which would allow universal amplification of plant mtDNA. The
ATP synthase F1 alpha sequence (GenBank AY596672.1) was tar-
geted. This gene’s enzyme catalyzes the final step during oxidative
phosphorylation and is highly conserved in eukaryotes (Millar and
others 2011).
Primer sets were tested empirically using qPCR with melt curve
analysis. Each primer set produced amplicons of expected lengths
when run in 1% agarose gels (data not shown). All amplicons were
sequenced and exhibited 100% identity to the atp1 mitochondrial
gene under NCBI BLAST analysis. A test comparing autoclaved
(121 °C for 20 min) versus nonautoclaved sweet potato puree
DNA was run with each primer set. Primer set 174 (Table 1)
was chosen as the preferable pair because it exhibited the greatest
difference in Ct values between the 2 samples (9 Ct difference ver-
sus 8, 5, & 5 for amplicon lengths of 141, 108, and 81 base pairs,
respectively). This was expected as longer amplicons would be sta-
tistically more likely to experience degradation and fragmentation
than shorter ones.
Universal primers for plant products were created using con-
sensus sequences in the atp1 mitochondrial gene creating a 174
bp amplicon. Therefore, this qPCR protocol could be used for
all fruits and vegetable without the necessity of creating a new
set of primers for each product. The universality of these primers
was confirmed by surveying a variety of vegetables, fruits, nuts,
and biofuel precursor (Table 2). The Ct values were determined
for fresh and autoclaved product to assure a significant increase
and a measurable outcome for each. The qPCR assay utilizes a
scale of 0 to 40 for Ct values. The lower the Ct value, the greater
numbers of the sequence of interest and the more robust the as-
say. A Ct value in the teens and low twenties is deemed robust.
For uncooked plant products, Ct values were in this range. The
exceptions were switch grass, which has a high cellulose content
and was milled to 3 mm, and grapes (both Ct = 28). The drying
procedure, followed by milling probably fragmented the mtDNA
in the switch grass. Many of the fruits, including grapes have high
sugar and pectin contents. Lower, more robust, Ct values were
M6 Journal of Food Science r Vol. 00, Nr. 0, 2015
7. M:FoodMicrobiology
&Safety
mtDNA fragmentation as thermal monitor . . .
obtained with pectin-containing fruits at a later date, using a dif-
ferent DNA extraction kit which eliminated pectin (MasterPure
Plant leaf DNA purification kit; Epicentre) (data not shown). Au-
toclaved Ct values were obtained for all plant products tested and
were well below the maximum of 40; the cut off target cited in the
literature and the lower sensitivity of the generated standard curve
was ca. 35 cycles. Differences between uncooked and autoclaved
Cts ranged from 4 to 17 for grape and carrot, respectively. The Ct
value represents copy number of gene fragments as illustrated by
the standard curve (Figure 1). In an optimized qPCR assay near
100% efficiency, an increase in Ct of 2.5 represents a 1-log reduc-
tion in copy number. Therefore, the mtDNA gene copies were
fragmented and copy number available for amplification reduced
by autoclave treatment (121 °C for 20 min). This 4 to 17 increase
in Ct values represents a 1.6- to 6.8-log copy number reduction
of the atp1 gene due to fragmentation.
In commercial applications, DNA extraction methods and time-
temperature correlations would have to be determined for each
plant product and its thermal process. However, this is relatively
simple to determine empirically.
MIQE standards
A standard curve for the universal primers was developed as
required by MIQE standards (Bustin and others 2009) (Figure 1).
The PCR efficiency was 106%, goodness-of-fit linear regression
correlation coefficient (R2
= 0.9884), linear range of detection
from log10 8.0 to log10 1.0 copy numbers with 10 copies
(corresponding to Ct ca. 35 cycles) the limit of detection. These
parameters were all within acceptable ranges in MIQE standards.
Correlation between Ct values and thermal death time
To compare the Ct values directly to time-temperature and
spore destruction, a hot oil bath was used to reach temperatures
above the boiling point of water and to give the operator complete
control of hold and cooling times, having determined the CUT
for the system. The Ct value of sweet potato puree had a high
correlation to time (min) at 121 °C in simple linear regression
(R2
= 0.87) (Figure 3). Variability at each time point was due to
DNA extraction efficiency, operator error in pipetting and small
sample size. The largest factor in variation would be pipetting
error due to dilutions needed to normalize each sample to 5 to
10 ng/μL. While DNA can be solubilized in water, it is a long,
sticky molecule and tends to form microscopy clumps resulting in
a nonhomogeneous solution. Buffers such as Tris-EDTA (pH 7.5
to 8.0) are used to create a more homogeneous DNA solution.
However, these diluents interfere with downstream applications
of DNA such as qPCR. In these assays, RT-PCR grade water
(Ambion) was used for all dilutions. Final DNA concentrations
from extractions ranged from 5 to 500 ng/L. This necessitated the
use of different dilutions to normalize DNA sample concentrations
prior to qPCR. Less operator handling after DNA extraction
would reduce variability. Using a 96-well format with automated
DNA and qPCR systems, operator error would be reduced and
mean N values could be increased to reduce standard errors.
Figure 3–Sweet potato puree mtDNA fragmentation as measured by
Ct value of 174 bp amplicon in hot oil bath (121 °C).
Figure 4–Mitochondrial DNA fragmentation in hot oil bath
(121 °C) versus spore counts.
Vol. 00, Nr. 0, 2015 r Journal of Food Science M7
8. M:FoodMicrobiology
&Safety
mtDNA fragmentation as thermal monitor . . .
G. stearothermophilus was used as a spore surrogate for C. bo-
tulinumin a reduction curve. The mean Ct values and log CFU/mL
were analyzed by simple linear regression (R2
= 0.87). This study
shows that a linear response exists when spores were in the range
log 8.0 to 2.0, with log 2.0 being the lowest level of detection
(Figure 4). Because it correlates with spore death, Ct could be
used as a rapid, presumptive test to assay a product before it is
shipped from the factory.
Retort data
Pilot-scale retort data show a high correlation between Ct and
cumulative F-values of low acid sweet potato puree (R2
= 0.88)
(Figure 5). Data points below the cumulative F-value of 3 min
tested positive by Prospore GS ampoules (Mesa Laboratories)
and above this value tested negative (>6D reduction of GS
process). Retort processes are notorious for long CUT and cool
down times. Since this was a non-continuous process, cumulative
Figure 5–Comparison of mitochondrial DNA fragmentation
with cumulative F values with two retort processes using
canned sweet potato puree.
Figure 6–Calculation of D-values for timed oil bath
treatments.
M8 Journal of Food Science r Vol. 00, Nr. 0, 2015
9. M:FoodMicrobiology
&Safety
mtDNA fragmentation as thermal monitor . . .
F-values are permitted. This is a total system approach that uses
not just the hold time at target temperature, but the total heating
profile. Using inverse prediction statistics, it was determined that
for retort process validation, 32 samples would be required for
a 2.3% standard error with a cumulative F value between 4.66
and 5.33 min for a 99% confidence interval (Table 3). This range
of cumulative F-values corresponds to the FDA recommended
time (5 min) to eliminate biological indicator spores at 121 °C
(http://www.fda.gov/RegulatoryInformation/Guidances/ucm
071261.htm).
Comparison of D- and z-values
D121 and z-values determined in hot oil bath for G. stearother-
mophilus ATCC 7953 (GS) spores were 2.71 min and 11.0 °C
(Figure 6 and 7), respectively. These values were slightly higher
than a commercial product using the same ATCC strain for au-
toclave validation (Prospore, Mesa Laboratories) which cited a
D121 of 1.8 min and a z-value of 7.4 °C under saturated steam.
Other D- and z-values for G. stearothermophilus spores cited in
the literature and on corporate spore supplier web pages are D120
from 1.5 to 3 min with z-value of greater than or equal to 6 °C
(Namsa, Northwood, Ohio, U.S.A.) and D121 of ca. 2 min in wa-
ter (Lundahl 2003). Both of these cited values were based on an
initial population of 106
spores. Head and others (2007) found that
D- and z-values varied widely based on the initial concentration
of spores (103
versus 106
) when treated with superheated steam.
While the TDT employed in our assay is a pressurized container,
one would not expect the same time-temperature treatment in a
Figure 7–Calculation of z-value for Geobacillus
stearothermophilus using D-values from.
Figure 8–Sweet potato puree D-values in hot oil bath based on
mtDNA fragmentation using log10 copy number.
Vol. 00, Nr. 0, 2015 r Journal of Food Science M9
10. M:FoodMicrobiology
&Safety
mtDNA fragmentation as thermal monitor . . .
Figure 9–Calculation of z-value for sweet potato puree
mtDNA fragmentation using D-values from Figure 8.
hot oil bath as pressurized, saturated stream in an autoclave. Based
on precautionary notes in commercial spore technical data sheets
(Prospore, Namsa) and values in the literature, spore D- and z-
values can vary widely due to type of heat treatment (wet versus
dry), initial concentration of spores, and spore carrier or media
(Head and others 2007). As an added precaution, a safety factor
is added to empirically derived data, that is, total death time is
rounded up, to ensure complete destruction of spores (Tucker and
others 2008).
D121 and z-values for Ct values from a 174-bp universal plant
amplicon were 11.3 min and 17.8 °C (Figure 8 and 9), respec-
tively, for mtDNA from sweet potato puree heated in a hot oil
bath. Variability at each time point was due to DNA extraction
efficiency, operator error in pipetting during dilutions and small
sample size. Variability was analyzed in depth in the hot oil bath
discussion. Due to the conversion of Ct to log10 copy number of
amplicon the Ct-D121 value (11.3 min) was much higher than the
G. stearothermophilus D121 (2.71 min). G. stearothermophilus spores
have a D121 value approximately 10× greater than C. botulinum
(D121 = 0.21 min; Esty and Meyer 1922; Townsend and others
1938; Stumbo 1965), the spore of concern in low acid, canned
or aseptically packaged foods. The Ct-D121 value of sweet potato
puree mtDNA is approximately 4× greater than the G. stearother-
mophilus indicator spore. Because of its higher D121 value, it might
be difficult to predict the FDA recommended F-value for steril-
ization (F0 = 5 min) using a log function of Ct value. However,
sterilization in the pharmaceutical industry requires higher val-
ues (F0 > 12 min) where G. stearothermophilus spores leave no
measurable outcome (Lundahl 2003).
When compared directly, the increase in Ct value had nearly a
1:1 ratio with G. stearothermophilus destruction at 121 °C in hot oil
bath treatments (ratio = 0.97) (Figure 4). A one-unit increase in Ct
was calculated as 3.5 min at 121 °C (data not shown) compared
to a 1-log reduction of G. stearothermophilus at 2.71 min. The
destruction of mtDNA as measured by log10 copy number was
not a first-order relationship but a simple inverse relationship with
time-temperature. Therefore, the use of Ct values directly will
have greater utility than conversion to log values.
Conclusions
Fragmentation of mtDNA, as measured by Ct, of low-acid foods
at high temperature has a high correlation to time-temperature
(Figure 3); cumulative F-values (Figure 5) and reduction curves of
spore surrogates (Figure 4). This assay represents a rapid, inexpen-
sive, quantitative method that can be used to test low-acid foods
in continuous-flow and batch thermal systems for heating efficacy
and microbial safety. It is especially useful for thermal processes
over 100 °C, since temperatures above boiling can rapidly damage
DNA. Its advantages over enzymatic assays are that mtDNA is
highly stable and can be stored at freezing temperatures for long
periods. Because of the stability of DNA in a food matrix, the
product can be stored for many months at −20 °C and assayed
later if questions arise. This is an advantage over enzymes and
can be used as a process library if a past production needs to be
re-analyzed. Unlike endogenous enzymes, mtDNA is universally
found in all foodstuffs. mtDNA can be used for all plant products
tested. Processors will be able to track process deviations using
rapid molecular methods. Processors can use this presumptive test
prior to shipping out a product. This method uses no probes, de-
vices or other additives to the continuous-flow or batch systems
for monitoring purposes. It utilizes equipment already available in
an industrial microbiological testing lab. This method will meet
MIQE standards and will be operator-friendly, requires minimal
training, and has a 4 h turn-around time. This method can be
standardized for consistency between labs and results are operator-
independent. Quantitative PCR is a protocol approved by USDA
and FDA for detection of bacteria; therefore process authorities
are familiar with the technique and are more apt to approve a new
use. Both DNA extraction and qPCR have been combined and
automated commercially, lending this analysis to high through-
put.
This approach to monitoring food safety represents a paradigm
shift in the use of qPCR. The fastest moving food particles or a
cold spot in a thermal process can be assayed directly, by intrinsic
mtDNA, providing a rapid test for thermal efficacy. We propose
monitoring and validating the efficacy of thermal processes of
low-acid plant foods by using mitochondrial DNA fragmentation
detection by qPCR.
Acknowledgments
The authors would like to acknowledge Janet Hayes for lab
management, ordering supplies and troubleshooting equipment;
Sandra Parker for secretarial, grant, and travel assistance; Bernard
Eckhardt for IT support; Dr. Van Den Truong for supplying
sweet potato puree; Michael Bumgardner, Jack Canady, and Karl
Hedrick for their expert engineering acumen; and Joy Smith for
statistical analysis. This research was funded by USDA-NIFA grant
(2012-67017-30179). The use of trade names in this publication
does not imply endorsement by the North Carolina Agricultural
Research Service of the products named nor criticism of similar
ones not mentioned. An international and United States patent
application has been filed for this process. Mention of a trademark
or proprietary product does not constitute a guarantee or warranty
of the product by the U. S. Department of Agriculture or North
M10 Journal of Food Science r Vol. 00, Nr. 0, 2015
11. M:FoodMicrobiology
&Safety
mtDNA fragmentation as thermal monitor . . .
Carolina Agricultural Research Service, nor does it imply approval
to the exclusion of other products that may be suitable.
References
Anderson S, Bankier AT, Barrell BG, deBruijn MHL, Coulson AR, Drouin J, Eperon IC,
Nierlich DP, Roe BA, Sanger F, Schreier PH, Smith AJH, Staden R, Young IG. 1981.
Sequence and organization of the human mitochondrial genome. Nature 290:457–65.
Andreasson H, Gyllensten U, Allen M. 2002. Real-time DNA quantification of nuclear and
mitochondrial DNA in forensic analysis. Biotechniques 33(2):402–11.
Bauer T, Weller P, Hammes WP, Hertel C. 2003. The effect of processing parameters on DNA
degradation in food. Eur Food Res Technol 217:338–43.
Bogenhagen D, Clayton DA. 1974. The number of mitochondrial deoxyribonucleic acid
genomes in mouse L and human HeLa cells. J BiolChem 249:7991–95.
Brinley TA, Dock CN, Truong VD, Coronel P, Kumar P, Simunovic J, Sandeep KP, Cartwright
GD, Swartzel KR, Jaykus LA. 2007. Feasibility of utilizing bioindicators for testing microbial
inactivation in sweetpotato purees processed with a continuous-flow microwave system. J
Food Sci 72:E235–42.
Budowle B, Allard MW, Wilson MR, Chakraborty R. 2003. Forensics and mitochondrial DNA:
applications, debates, and foundations. Annu Rev Genomics Hum Genet 4:119–41.
Bustin SA, Benes V, Garson JA, Hellemans J, Huggett J, Kubista M, Mueller R, Nolan T, Pfaffl
MW, Shipley GL, Vandesompele J, Wittwer CT. 2009. The MIQE Guidelines: minimum
information for publication of quantitative real-time pcr experiments. Clin Chem 55:611–22.
Caldwell JM, Levine JF. 2009. Domestic wastewater influent profiling using mitochondrial
real-time PCR for source tracking animal contamination. J Microbiol Methods 77:17–22.
Caldwell JM, Raley ME, Levine JF. 2007. Mitochondrial multiplex real-time PCR as a source
tracking method in fecal-contaminated effluents. Environ SciTechnol 41:3277–83.
Caldwell JM, Villemur R, Payment P. 2011. Mitochondrial DNA as source tracking markers of
fecal contamination, In Harwood V, Hagedorn C, and Blanch A, editors. Microbial source
tracking: methods, applications, and case studies. New York: Springer Science and Business
Media. p 229–50.
Claeys WL, Smout C, VanLoey AM, Hendrick ME. 2004. From time temperature integrator
kinetics to time temperature integrator tolerance levels: heat-treated milk. BiotechnolProg
20:1–12.
DeCordt SF, Hendrick ME, Maesmans GJ, Tobback PP. 1994. Convenience of immobilized
Bacillus licheniformis alpha-amylase as time-temperature-integrator (TTI). J Chem Technol
Biotechnol 59:193–9.
Esty JR, Meyer KF. 1922. The heat resistance of the spores of B. botulinus and allied anaerobes
XI. J Infectious Dis 31:650–63.
Foegeding PM, Busta FF. 1983. Hypochlorite injury of Clostridium botulinum spores alters ger-
mination responses. Appl Environ Microbiol 45:1360–68.
Foury F, Roganti T, Lecrenier N, Purnelle B. 1998. The complete sequence of the mitochondrial
genome of Saccharomyces cerevisiae. FEBS Lett 440:325–31.
Fujimura T, Matsumoto T, Tanabe S, Morimatsu F. 2008. Specific discrimination of chicken
DNA from other poultry DNA in processed foods using the polymerase chain reaction. Biosci
Biotechnol Biochem 72:909–13.
Gerber AS, Loggins R, Kumar S, Dowling TE. 2001. Does nonneutral evolution shape observed
patterns of DNA variation in animal mitochondrial genomes? Annu Rev Genet 35:539–66.
Gryson N. 2010. Effect of food processing on plant DNA degradation and PCR-based GMO
analysis: a review. Anal Bioanal Chem 396:2003–22.
Guan D, Gray P, Kang DH, tang J, Shafer B, Ito K, Younce F, Tang TCS. 2003. Microbiological
validation of microwave-circulated water combination heating technology by inoculated pack
studies. J Food Sci 63:1428–32.
Guiavarch Y, Van Loey A, Zuber F, Hendrick M. 2004. Development characterization and use
of a high-performance enzymatic time-temperature integrator for the control of sterilization
process’ impacts. Biotechnol Bioneng 88(1):15–25.
Guiavarch Y, Zuber F, Van Loey A, Hendrick M. 2005. Combined use of two single-component
enzymatic time-temperature integrators: application to industrial continuous rotary processing
of canned ravioli. J Food Prot 68:375–83.
Handa H. 2003. The complete nucleotide sequence and RNA editing content of the mito-
chondrial genome of rapeseed (Brassica napus L.): comparative analysis of the mitochondrial
genomes of rapeseed and Arabidopsis thaliana. Nuc Acids Res 31(20):5907–16.
Head DS, Cenkowski S, Holley R, Blank G. 2007. Effects of superheated steam on Geobacillus
stearothermophilus spore viability. J Appl Microbiol 104:1213–20.
Hird H, Chisholm J, Sanchez A, Hernandez M, Goodier R, Schneede K, Boltz C, Popping
B. 2006. Effect of heat and pressure processing on DNA fragmentation and implications
for the detection of meat using a real-time polymerase chain reaction. Food Addit Contam
23:645–50.
Hopwood AJ, Mannucci A, Sullivan KM. 1996. DNA typing from human faeces. Intl J Legal
Med 108(5):237–43.
Hrncirova Z, Bergerova E, Siekel P. 2008. Effects of technological treatment on DNA degrada-
tion in selected food matrices of plant origin. J Food Nutr Res 47:23–28.
Jett BD, Hatter KL, Huycker MM, Gilmore MS. 1997. Simplified agar plate method for quan-
tifying viable bacteria. BioTechniques 23:648–50.
Kharazmi M, Bauer T, Hammes WP, Hertel C. 2003. Effect of food processing on the fate of
DNA with regard to degradation and transformation capability of Bacillus subtilis. Syst Appl
Microbiol 26:495–501.
Lahiff S, Glennon M, O’Brien L, Lyng J, Smith T, Maher M, Shilton N. 2001. Species-specific
PCR for the identification of ovine, porcine and chicken species in meta and bone meal
(MBM). Mol Cell Probes 15(1):27–35.
Lipp M, Brodmann P, Pietsch P, Pauwels J, Anklam E, B¨orchers T, Braunschweiger G, Busch
U, Eklund E, Eriksen FD, Fagan J, Fellinger A, Gaugitsch H, Hayes D, Hertel C, H¨ortner
H, Joudrier P, Kruse L, Meyer R, Miraglia M, M¨uller W, Phillipp P, P¨opping B, Rentsch R,
Wurtz A. 1999. IUPAC collaborative trial study of a method to detect genetically modified
soy beans and maize in dried powder. J AOAC Intl 82(4):923–8.
Lundahl G. 2003. A method of increasing test range and accuracy of bioindicators: Geobacillus
stearothermophilus spores. PDA J Pharm Sci Technol 57:249–62.
Marcy JE. 1997. Biological validation. Food Technol 51:48–52.
Meyer R, Candrian U. 1996. PCR-based DNA analysis for the identification and characteriza-
tion of food components. Food Sci Technol-Lebensm-WissTechnol 29:1–9.
Millar AH, Whelan J, Soole KL, Day DA. 2011. Organization and regulation of mitochondrial
respiration in plants. Annu Rev Plant Biol 62:79–104.
Moreano F, Busch U, Engel KH. 2005. Distortion of genetically modified organism quantifi-
cation in processed foods: influence of particle size compositions and heat-induced DNA
degradation. J Agric Food Chem 53:9971–79.
Murray SR, Butler RC, Hardacre AK, Timmerman-Vaughan GM. 2007. Use of quantitative
real-time PCR to estimate maize endogenous DNA degradation after cooking and extrusion
or in food products. J Agric Food Chem 55:2231–39.
Neter J, Wasserman W, Kutner M. 1983. Simultaneous inferences and other topics in regression
analysis-1. Appl Linear Regression Models 150–53.
Orta-Ramierez A, Merrill JE, Smith DM. 2001. Sucrose, sodium dodecyl sulfate, urea and 2-
mercaptoethanol affect the thermal inactivation of R-phycoerythrin. J Food Prot 64:1806–11.
Pflug IJ. 1990. Microbiology and engineering of sterilization processes. Environmental Steril-
ization Laboratory; Minneapolis, MN, 7th ed.
Pflug IJ, Odlaug TE, Christensen R. 1985. Computing a minimum public health sterilizing
value for food and pH values from 4.6 to 6.0. J Food Prot 48:848–50.
Pflug IJ, Smith G, Holcomb R, Blanchett R. 1980. Measuring sterilizing values in containers of
food using thermocouples and biological indicators units. J Food Prot 43:119–23.
Reyes-de-Corcuera JI, Cavalieri RP, Powers JR, Tang J, Kang DH. 2005. Enzyme-
electropolymer-based amperometric biosensors: an innovative platform for time-temperature
integrators. J Agric Food Chem 53:8866–73.
Sakalar E, Abasiyanik MF, Bektik E, Tayyrov A. 2012. Effect of heat processing on DNA
quantification of meat species. J Food Sci 77:N40–44.
Smith GM, Kopelman M. 1982. Effect of environmental conditions during heating on com-
mercial spore strip performance. Appl Environ Microbiol 44:12–18.
Smith SE, Orta-Ramirez A, Ofoli RY, Ryser ET, Smith DM. 2002. R-phycoerythrin as a
time-temperature integrator to verify the thermal processing adequacy of beef patties. J Food
Prot 65:814–19.
Stam CN. 2008. Development of novel biological indicators to evaluate the efficacy of microwave
processing. Doctoral Disseration. NCSU Food Science; Raleigh, NC.
Steed LE. 2010. Development and validation of processes for continuous flow microwave pro-
cessing of foods containing sweet potato particulates. Doctoral Disseration. NCSU Food
Science; Raleigh, NC.
Stumbo CR. 1965. Thermobacteriology in food processing. 1st ed. 111 Fifth Ave, New York,
Academic Press.
Townsend CT, Esty JR, Baselt FC. 1938. Heat-resistance studies on spores of putrefactive
anaerobes in relation to determination of safe processes for canned foods. Food Res 3:
323–46.
Truong VD, Walter VM, Jr. 1994. Physical and sensory properties of sweetpotato puree texturized
with cellulose derivatives. J Food Sci 59:1175–80.
Tucker G, Shaw H, Christian G, Gaze J. 2008. History of the minimum botulinum cook for
low-acid canned foods. Campden & Chorleywood Food Research Association Group. R &
D report no. 260. Doc Ref:FMT/REP/90194/1.
van Melis CCJ, Nierop Groot MN, Tempelaars MH, Moezelaar R, Abee T. 2011. Character-
ization of germination and outgrowth of sorbic acid-stressed Bacillus cereus ATCC 14579
spores: phenotype and transcriptome analysis. Food Microbiol 28:275–83.
Veeramuhu GJ, Price JF, Davis CE, Booren AM, Smith DM. 1998. Thermal inactivation of Es-
cherichia coli O157:H7, Salmonella senftenberg, and enzymes with potential as time-temperature
indicators in ground turkey thigh meat. J Food Prot 61:171–75.
Wang JP, Deng L, Li Y, Xu XM, Gao Y, Nahimana H, Chen HQ, Jin ZY, Kim JM, He
LF. 2010. Konjacglucomannan as a carrier material for time-temperature integrator. Food
SciTechnolInt 16:127–34.
Yen CY. 2009. Development and testing of enzymatic time-temperature integrator devices under
isothermal and non-isothermal conditions. Masters Thesis. NCSU Food Science; Raleigh,
NC.
Zhang CL, Fowler MR, Scott NW, Lawson G, Slater A. 2007. A TaqMan real-time PCR system
for the identification and quantification of bovine DNA in meats, milks and cheeses. Food
Control 18:1149–58.
Supporting Information
Additional Supporting Information may be found in the online
version of this article at the publisher’s website:
Appendix A. Protocol 00: Full water immersion
Appendix B. Protocol 01: Full water immersion
Vol. 00, Nr. 0, 2015 r Journal of Food Science M11