
Empfohlen
Empfohlen
Weitere ähnliche Inhalte
Andere mochten auch
Andere mochten auch (14)
Ähnlich wie Preventing Illness and Promoting Healthy Aging in Thames Valley
Ähnlich wie Preventing Illness and Promoting Healthy Aging in Thames Valley (20)
Kürzlich hochgeladen
Kürzlich hochgeladen (20)
Preventing Illness and Promoting Healthy Aging in Thames Valley
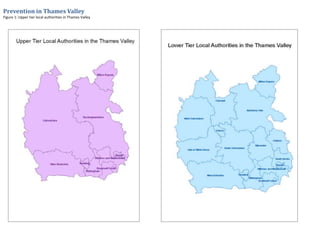
- 1. Prevention in Thames Valley Figure 1: Upper tier local authorities in Thames Valley
- 2. Population Thames Valley has a population of 1,770,800 people (2014) and expected to grow to 1,893,000 persons by 2024 with the greatest increase in the 65 and over age groups. Similar figures for CCGs in Thames Valley are also available. 6.0% 4.0% 2.0% 0.0% 2.0% 4.0% 6.0% 0-4 5-9 10-14 15-19 20-24 25-29 30-34 35-39 40-44 45-49 50-54 55-59 60-64 65-69 70-74 75-79 80-84 85-89 90+ % of total resident population Projected population age and sex breakdown for Thames Valley for 2014, 2019 and 2024 2014 Males 2014 Females 2019 Males 2019 Females 2024 Males 2024 Females Source:ONS, Subnational Population Projections for CCGs in England, 2014 based Figure 3: Population pyramid for Thames Valley – 2014, 2019, 2024
- 3. Population (continued) The smallest population growth is expected in the 15-44 years age group for CCGs across Thames Valley and indeed a slight decline in this age group for Thames Valley as a whole over the next 10 years. 3.7% 5.8% -1.5% 5.8% 8.0% 12.1% 17.3% 6.9% 7.2% -0.5% 8.1% 10.1% 36.2% 42.0% -5% 0% 5% 10% 15% 20% 25% 30% 35% 40% 45% 50% 55% All Ages 0-14 15-44 45-64 65-74 75-84 85+ % change from 2014 5 year change (2019) 10 year change (2024) Projected 5 and 10 year resident population change from 2014 by age group Thames Valley Source:ONS, Subnational Population Projections for CCGs in England, 2014 based Figure 4: Projected 5 and 10 year resident population change from 2014 by age band in Thames Valley
- 4. Life expectancy: Reflecting the lower levels of deprivation in Thames Valley, life expectancy is higher than England with the exception of Slough and Reading where life expectancy for men is lower than England and similar to England for women. Despite life expectancy being higher than the national average there is variation in life expectancy by deprivation. Figure 7: Life expectancy at birth (Female) for local authorities in Thames Valley
- 5. Figure 8: Life expectancy at birth (Male) for local authorities in Thames Valley Life expectancy (cont.)
- 6. Figure 9: Gap in life expectancy at birth between local authorities and England as a whole (Female) Life expectancy (cont.)
- 7. Figure 10: Gap in life expectancy at birth between local authorities and England as a whole (Male) Life expectancy (cont.)
- 8. Life expectancy gap by deprivation Within areas there is a gap in life expectancy by deprivation with lower life expectancy in more deprived populations. The figures below show this gradient across the South East and are available for local areas from http://fingertips.phe.org.uk/ Figure 11: Life expectancy at birth (Male) by deprivation decile, South East
- 9. Figure 12: Life expectancy at birth (Female) by deprivation decile, South East Life expectancy gap by deprivation (cont.)
- 10. The segment tool explores the conditions that account for this gap in life expectancy in male and female populations in Oxfordshire, as an example, indicating the areas where action is most needed to address the inequalities in life expectancy locally. Circulatory conditions account for over a fifth of the gap in life expectancy in men but a much smaller proportion in women. The segment tool can be accessed at http://www.lho.org.uk/LHO_Topics/Analytic_Tools/Segment/TheSegmentTool.aspx to examine the contributors to the gap in life expectancy in your area Figure 13: Causes for the gap in life expectancy between the least and most deprived in Oxfordshire Segmenting life expectancy by cause of death
- 11. Disability Proportion of people reporting living with disability or long term health problems is significantly lower than for England as is the rate of Disability living Allowance claimants, with the highest rate of claimants in Reading and Slough. This could be expected to have an impact on service use in these areas. Figure 14: Long-term health problems or disability by CCG in Thames Valley Figure 15: Disability benefits claimants by local authority in Thames Valley