
Empfohlen
Weitere ähnliche Inhalte
Mehr von JAKPATAPP
Mehr von JAKPATAPP (20)
Kürzlich hochgeladen
Kürzlich hochgeladen (20)
E books vs. Print books - Survey Result
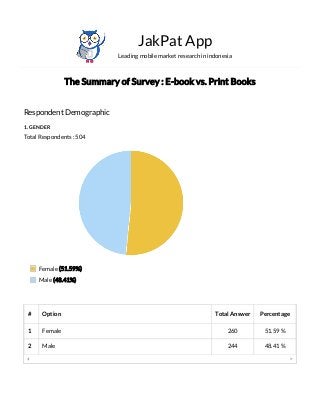
- 1. The Summary of Survey : E-book vs. Print Books Respondent Demographic 1. GENDER Total Respondents : 504 JakPat App Leading mobile market research in indonesia # Option Total Answer Percentage 1 Female 260 51.59 % 2 Male 244 48.41 % Female (51.59%) Male (48.41%)
- 2. 2. AGE Total Respondents : 504 # Option Total Answer Percentage 1 18-29 438 86.9 % 2 30-39 66 13.1 % 18-29 (86.9%) 30-39 (13.1%)
- 3. 3. SOCIOECONOMIC STATUS (SES) Total Respondents : 504 Middle 1 (B+) (30.75%) Upper 2 (A) (28.77%) Upper 1 (A+) (21.63%) Middle 2 (B) (13.1%) Lower 1 (C+) (5.16%) Lower 2 (C) (0.6%)
- 4. 4. CURRENT LOCATION (PROVINCE) Total Respondents : 504 # Option Total Answer Percentage 1 Middle 1 (B+) 155 30.75 % 2 Upper 2 (A) 145 28.77 % 3 Upper 1 (A+) 109 21.63 % 4 Middle 2 (B) 66 13.1 % 5 Lower 1 (C+) 26 5.16 % 6 Lower 2 (C) 3 0.6 % Jawa Barat (19.64%) Jawa Timur (12.9%) DI Yogyakarta (11.71%) DKI Jakarta (11.71%)
- 5. Jawa Tengah (11.11%) Sulawesi Selatan (9.13%) Sumatera Utara (8.53%) Sumatera Selatan (7.94%) Banten (3.37%) Bali (1.98%) Kalimantan Timur (1.79%) Sulawesi Utara (0.2%) Lampung (0%) Maluku (0%) Jambi (0%) Kepulauan Bangka Belitung (0%) Papua (0%) Sulawesi Tenggara (0%) Nusa Tenggara Barat (0%) Bengkulu (0%) Sumatera Barat (0%) Sulawesi Barat (0%) Kalimantan Utara (0%) Riau (0%) Sulawesi Tengah (0%) Gorontalo (0%) Kalimantan Tengah (0%) Maluku Utara (0%) Nanggroe Aceh Darussalam (0%) Papua Barat (0%) Kepulauan Riau (0%) Kalimantan Selatan (0%) Nusa Tenggara Timur (0%) Kalimantan Barat (0%)
- 6. # Option Total Answer Percentage 1 Jawa Barat 99 19.64 % 2 Jawa Timur 65 12.9 % 3 DI Yogyakarta 59 11.71 % 4 DKI Jakarta 59 11.71 % 5 Jawa Tengah 56 11.11 % 6 Sulawesi Selatan 46 9.13 % 7 Sumatera Utara 43 8.53 % 8 Sumatera Selatan 40 7.94 % 9 Banten 17 3.37 % 10 Bali 10 1.98 % 11 Kalimantan Timur 9 1.79 % 12 Sulawesi Utara 1 0.2 % 13 Lampung 0 0 % 14 Maluku 0 0 % 15 Jambi 0 0 % 16 Kepulauan Bangka Belitung 0 0 % 17 Papua 0 0 % 18 Sulawesi Tenggara 0 0 % 19 Nusa Tenggara Barat 0 0 % 20 Bengkulu 0 0 %
- 7. 21 Sumatera Barat 0 0 % 22 Sulawesi Barat 0 0 % 23 Kalimantan Utara 0 0 % 24 Riau 0 0 % 25 Sulawesi Tengah 0 0 % 26 Gorontalo 0 0 % 27 Kalimantan Tengah 0 0 % 28 Maluku Utara 0 0 % 29 Nanggroe Aceh Darussalam 0 0 % 30 Papua Barat 0 0 % 31 Kepulauan Riau 0 0 % 32 Kalimantan Selatan 0 0 % 33 Nusa Tenggara Timur 0 0 % 34 Kalimantan Barat 0 0 %
- 8. Survey Result 1. HOW MANY BOOKS HAVE YOU READ IN THE PAST 12 MONTHS? Single Answer, Total Respondents : 504 2-3 (31.35%) 4-5 (19.25%) 11 or more books (19.05%) 6-10 (11.51%) 1 (10.71%) 0 (8.13%)
- 9. # Option Total Answer Percentage 1 2-3 158 31.35 % 2 4-5 97 19.25 % 3 11 or more books 96 19.05 % 4 6-10 58 11.51 % 5 1 54 10.71 % 6 0 41 8.13 %
- 10. 2. HAVE YOU PURCHASED AN E-BOOK OR A PRINTED BOOK WITHIN THE PAST 12 MONTHS? Single Answer, Total Respondents : 504 # Option Total Answer Percentage 1 Yes, I've purchased only printed books. 222 44.05 % 2 No, I haven't purchased any books. 170 33.73 % 3 Yes, I've purchased both e-books and printed books. 86 17.06 % 4 Yes, I've purchased only e-books. 26 5.16 % Yes, I've purchased only printed books. (44.05%) No, I haven't purchased any books. (33.73%) Yes, I've purchased both e-books and printed books. (17.06%) Yes, I've purchased only e-books. (5.16%)
- 11. 3. HOW MANY BOOKS (ELECTRONIC OR PRINTED) HAVE YOU PURCHASED WITHIN THE PAST 12 MONTHS? Single Answer, Total Respondents : 334 2-3 (38.62%) 4-5 (23.35%) 11 or more (13.77%) 6-10 (10.48%) 1 (10.48%) 0 (3.29%)
- 12. 4. DO YOU PREFER TO READ E-BOOKS OR PRINTED BOOKS? Single Answer, Total Respondents : 504 # Option Total Answer Percentage 1 2-3 129 38.62 % 2 4-5 78 23.35 % 3 11 or more 46 13.77 % 4 6-10 35 10.48 % 5 1 35 10.48 % 6 0 11 3.29 % Printed books (54.56%) No preference; they're the same (30.36%) E-books (15.08%)
- 13. 5. WHY DO YOU PREFER E-BOOKS? Multiple Answer, Total Respondents : 76 # Option Total Answer Percentage 1 Printed books 275 54.56 % 2 No preference; they're the same 153 30.36 % 3 E-books 76 15.08 % 0 % 20 % 40 % 60 % 80 % 100 % 1 2 3 4 5 6 portability - I can easily bring my books with me when I'm traveling or moving around (76.32%) storage - I don't need to worry about finding space to keep them (63.16%) ease of purchase - e-books are easier to get and buy (36.84%) environmental impact - e-books do not waste much natural resources (36.84%) price - e-books are usually cheaper than the printed versions (26.32%)
- 15. 6. WHY DO YOU PREFER PRINTED BOOKS? Multiple Answer, Total Respondents : 275 # Option Total Answer Percentage 1 portability - I can easily bring my books with me when I'm traveling or moving around58 76.32 % 2 storage - I don't need to worry about finding space to keep them 48 63.16 % 3 ease of purchase - e-books are easier to get and buy 28 36.84 % 4 environmental impact - e-books do not waste much natural resources 28 36.84 % 5 price - e-books are usually cheaper than the printed versions 20 26.32 % 6 Other option 4 5.26 % Other Option # Answer Total Answer Percentage 1 bisa download gratis 1 1.32 % 2 banyak ebook gratis 1 1.32 % 3 Bisa di search untuk mencari informasi nya 1 1.32 % 4 buku elektronik bisa didapatkan gratis 1 1.32 % 1 2
- 16. 0 % 20 % 40 % 60 % 80 % 100 % 3 4 5 6 tangibility - I like having the physical item in my hands. (76.73%) library - I like adding books to my personal library collection. (46.55%) accomplishment - I feel like I've accomplished something when I get to physically see how many pages of a book I've read. (33.82%) pass-it-on - I can give a book to someone else whereas I wouldn't be able to do that with an e-book. (29.09%) multi-purpose - I can use books for many other purposes after I'm done reading them. (20%) aroma - I like how books smell. (18.55%)
- 17. 7. WHICH WOULD YOU SAY YOU OWN MORE OF? Single Answer, Total Respondents : 153 # Option Total Answer Percentage 1 tangibility - I like having the physical item in my hands. 211 76.73 % 2 library - I like adding books to my personal library collection. 128 46.55 % 3 accomplishment - I feel like I've accomplished something when I get to physically see how many pages of a boo93 33.82 % 4 pass-it-on - I can give a book to someone else whereas I wouldn't be able to do that with an e-book.80 29.09 % 5 multi-purpose - I can use books for many other purposes after I'm done reading them.55 20 % 6 aroma - I like how books smell. 51 18.55 % about the same (54.25%) printed books (35.95%) e-books (9.8%)
- 18. 8. IF PRICES FOR E-BOOKS AND PRINTED BOOKS ARE THE SAME, WHICH WOULD YOU PREFER TO BUY? Single Answer, Total Respondents : 504 # Option Total Answer Percentage 1 about the same 83 54.25 % 2 printed books 55 35.95 % 3 e-books 15 9.8 % # Option Total Answer Percentage 1 Printed book 400 79.37 % 2 E-book 104 20.63 % Printed book (79.37%) E-book (20.63%)