
Empfohlen
Weitere ähnliche Inhalte
Andere mochten auch
Andere mochten auch (12)
Ähnlich wie Financial report 2011
Ähnlich wie Financial report 2011 (9)
Mehr von Isaac_Schools_5
Mehr von Isaac_Schools_5 (20)
Kürzlich hochgeladen
Kürzlich hochgeladen (20)
Financial report 2011
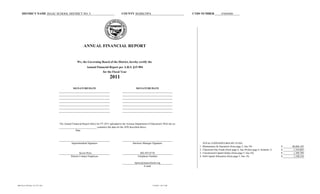
- 1. DISTRICT NAME ISAAC SCHOOL DISTRICT NO. 5 COUNTY MARICOPA CTDS NUMBER 070405000 ANNUAL FINANCIAL REPORT We, the Governing Board of the District, hereby certify the Annual Financial Report per A.R.S. §15-904 for the Fiscal Year 2011 SIGNATURE/DATE SIGNATURE/DATE The Annual Financial Report file(s) for FY 2011 uploaded to the Arizona Department of Education's Web site on contain(s) the data for the AFR described above. Date Superintendent Signature Business Manager Signature TOTAL EXPENDITURES BY FUND 1. Maintenance & Operation (from page 2, line 34) $ 40,860,185 2. Classroom Site Funds (from page 4, line 49 plus page 4, footnote 1) $ 1,354,805 Kevin Price 602-455-6710 3. Unrestricted Capital Outlay (from page 5, line 10) $ 1,389,709 District Contact Employee Telephone Number 4. Soft Capital Allocation (from page 5, line 19) $ 1,100,236 kprice@isaacschools.org E-mail ADE/AG 41-202 Rev. 8/11-FY 2011 11/9/2011 10:13 AM
- 2. DISTRICT NAME ISAAC SCHOOL DISTRICT NO. 5 COUNTY MARICOPA CTDS NUMBER 070405000 MAINTENANCE UNRESTRICTED SOFT CAPITAL AND OPERATION CAPITAL OUTLAY ALLOCATION FUNDS AVAILABLE FUND 001 FUND 610 FUND 625 ACTUAL ACTUAL ACTUAL Beginning Fund Balance (1) 1. 3,293,921 5,712,209 6,243,866 1. REVENUE 1000 Local 1110 Property Taxes 2. 12,776,228 66,192 130,766 2. (1) Includes the Maintenance and Operation Fund revolving account cash balance on hand of $5,000 at 7/1/10 or 1140 Penalties and Interest on Taxes 3. 0 3. $5,000 at 6/30/11, as applicable. 1280 Revenue in Lieu of Taxes 4. 111,263 0 0 4. (2) The amount of Government Property Lease Excise Tax revenue included on line 18 is $0 . 1310 Tuition from Individuals 5. 0 0 5. 1320 Tuition from Other Arizona Districts 6. 0 0 6. 1330 Tuition from Out-of-State Districts 7. 0 0 7. 1340 Tuition from Other Private Sources (Other than Individuals) 8. 0 0 8. 1350 Tuition from Other Government Sources Within Arizona 9. 0 0 9. 1360 Tuition from Other Government Sources Outside Arizona 10. 0 0 10. 1410 Transportation Fees from Individuals 11. 0 0 0 11. 1420 Transportation Fees from Other Arizona Districts 12. 0 0 0 12. 1430 Transportation Fees from Out-of-State Districts 13. 0 0 0 13. 1440 Transportation Fees from Other Private Sources (Other than Individuals) 14. 0 0 0 14. 1450 Transportation Fees from Other Government Sources Within Arizona 15. 0 0 0 15. 1460 Transportation Fees from Other Government Sources Outside Arizona 16. 0 0 0 16. 1500 Investment Income 17. 0 58,893 65,228 17. Other (Specify) (2) refund prior yr; stale warrant 18. 7,552 0 24,327 18. Subtotal (lines 2-18) 19. 12,895,043 125,085 220,321 19. 2000 Intermediate 2110 County School Fund 20. 0 0 0 20. 2120 County Equalization Assistance 21. 2,833,112 147,265 24,230 21. 2210 Special County School Reserve Fund 22. 0 0 0 22. Other (Specify) 23. 0 0 0 23. Subtotal (lines 20-23) 24. 2,833,112 147,265 24,230 24. 3000 State 3110 State Equalization Assistance 25. 23,962,499 1,135,825 1,133,202 25. 3120 Additional State Aid 26. 528,638 10,087 18,119 26. Other (Specify) 27. 0 0 0 27. Subtotal (lines 25-27) 28. 24,491,137 1,145,912 1,151,321 28. 4000 Federal 4100 Unrestricted Revenue Received Directly from the Federal Government 29. 0 29. 4200 Unrestricted Revenue Received from the Federal Government through the State 30. 0 30. 4500 Restricted Revenue Received from the Federal Government through the State 31. 328,330 0 0 31. 4700 Revenue Received from the Federal Government through Other Intermediate Agencies 32. 0 32. 4800 Revenue in Lieu of Taxes 33. 0 33. 4900 Revenue for/on Behalf of the District 34. 0 34. Other (Specify) 35. 0 35. Subtotal (lines 29-35) 36. 328,330 0 0 36. Total Fund Revenue (lines 19, 24, 28, and 36) 37. 40,547,622 1,418,262 1,395,872 37. 5200 Fund Transfers-In 38. 0 0 0 38. Other (Specify) 39. 0 0 0 39. TOTAL FUNDS AVAILABLE (lines 1 and 37 through 39) 40. 43,841,543 7,130,471 7,639,738 40. Total Maintenance and Operation Expenditures (p. 2, line 34) 41. 40,860,185 41. Total Capital Expenditures (p. 5, lines 10 and 19) 42. 1,389,709 1,100,236 42. 6900 Other Financing Uses and Other Items 43. 350,000 0 0 43. TOTAL EXPENDITURES AND OTHER USES (lines 41 or 42 plus 43) 44. 41,210,185 1,389,709 1,100,236 44. ENDING FUND BALANCE (line 40 minus line 44) (1) 45. 2,631,358 5,740,762 6,539,502 45. . ADE/AG 41-202 Rev. 8/11-FY 2011 11/9/2011 10:13 AM Page 1 of 9
- 3. DISTRICT NAME ISAAC SCHOOL DISTRICT NO. 5 COUNTY MARICOPA CTDS NUMBER 070405000 MAINTENANCE AND OPERATION FUND (001)—EXPENDITURES Employee Purchased Services Debt Service Totals % Increase/ Expenditures Salaries Benefits 6300, 6400, Supplies and Miscellaneous Decrease in Budget Actual Prior Year Actual 6100 6200 6500 6600 6800 Actual 100 Regular Education 1000 Classroom Instruction 1. 10,542,252 2,883,280 12,043 372,274 8,661 15,795,642 13,818,510 15,314,858 -9.8% 1. 2000 Support Services 2100 Students 2. 1,023,182 308,699 7,310 7,215 0 1,340,729 1,346,406 1,384,719 -2.8% 2. 2200 Instructional Staff 3. 696,974 203,775 27,593 19,193 650 950,357 948,185 1,097,198 -13.6% 3. 2300 General Administration 4. 213,022 359,393 51,015 4,048 24,289 604,130 651,767 546,285 19.3% 4. 2400 School Administration 5. 2,032,337 492,024 0 3,642 838 2,483,651 2,528,841 2,555,556 -1.1% 5. 2500 Central Services 6. 1,489,046 618,802 409,796 312,130 12,481 2,607,531 2,842,255 2,378,941 19.5% 6. 2600 Operation & Maintenance of Plant 7. 2,440,493 753,463 2,374,062 1,534,232 2,497 7,360,937 7,104,747 7,066,849 0.5% 7. 2900 Other 8. 0 0 0 0 0 0 0 0 0.0% 8. 3000 Operation of Noninstructional Services 9. 0 0 0 61,000 0 61,000 61,000 111,000 -45.1% 9. 5000 Debt Service (1) 10. 0 0 0 0 0.0% 10. 610 School-Sponsored Cocurricular Activities 11. 0 0 0 0 0 0 0 0 0.0% 11. 620 School-Sponsored Athletics 12. 49,035 8,003 6,419 11,129 265 87,000 74,851 84,971 -11.9% 12. 630 Other Instructional Programs 13. 0 0 0 0 0 0 0 0 0.0% 13. 700, 800, 900 Other Programs 14. 0 0 0 0 0 0 0 0 0.0% 14. Regular Education Subsection Subtotal (lines 1-14) 15. 18,486,341 5,627,439 2,888,238 2,324,863 49,681 31,290,977 29,376,562 30,540,377 -3.8% 15. 200 Special Education 1000 Classroom Instruction 16. 2,067,914 672,490 269,258 1,459 60 3,095,131 3,011,181 3,713,272 -18.9% 16. 2000 Support Services 2100 Students 17. 797,797 205,719 1,487,667 5,037 0 2,586,818 2,496,220 1,995,912 25.1% 17. 2200 Instructional Staff 18. 0 0 43,341 0 0 45,520 43,341 43,277 0.2% 18. 2300 General Administration 19. 0 0 0 0 0 0 0 0 0.0% 19. 2400 School Administration 20. 0 0 0 0 0 0 0 0 0.0% 20. 2500 Central Services 21. 0 0 0 0 0 0 0 0 0.0% 21. 2600 Operation & Maintenance of Plant 22. 0 0 0 0 0 0 0 0 0.0% 22. 2900 Other 23. 0 0 0 0 0 0 0 0 0.0% 23. 3000 Operation of Noninstructional Services 24. 0 0 0 0 0 0 0 0 0.0% 24. Subtotal (lines 16-24) 25. 2,865,711 878,209 1,800,266 6,496 60 5,727,469 5,550,742 5,752,461 -3.5% 25. 300 Special Education Disability ESEA, Title VIII (from Supplement, page 1, line 10) 26. 0 0 0 0 0 0 0 0 0.0% 26. 400 Pupil Transportation 27. 519,050 173,399 183,972 105,297 8 981,754 981,726 1,276,982 -23.1% 27. 510 Desegregation (from Districtwide Desegregation Expenditures, page 2, line 44) 28. 3,800,914 1,150,241 0 0 0 4,951,155 4,951,155 4,951,155 0.0% 28. 520 Special K-3 Program Override (from Supplement, page 1, line 20) 29. 0 0 0 0 0 0 0 0 0.0% 29. 530 Dropout Prevention Programs 1000 Classroom Instruction 30. 0 0 0 0 0 0 0 0.0% 30. 2000-3000 Support Serv. & Oper. of Noninstructional Serv. 31. 0 0 0 0 0 0 0 0.0% 31. Subtotal (lines 30 and 31) 32. 0 0 0 0 0 0 0 0 0.0% 32. 540 Joint Career and Technical Education and Vocational Education Center (from Supplement, page 1, line 30) 33. 0 0 0 0 0 0 0 0 0.0% 33. Total Expenditures (lines 15, 25-29, 32, and 33) 34. 25,672,016 7,829,288 4,872,476 2,436,656 49,749 42,951,355 40,860,185 42,520,975 -3.9% 34. (1) Function code 5000, object code 6820-Judgments Against the District should be used to report actual expenditures for excessive property tax valuation judgments paid in FY 2011 . ADE/AG 41-202 Rev. 8/11-FY 2011 11/9/2011 10:13 AM Page 2 of 9
- 4. DISTRICT NAME ISAAC SCHOOL DISTRICT NO. 5 COUNTY MARICOPA CTDS NUMBER 070405000 A. ENROLLMENT OF GIFTED PUPILS BY GRADE (A.R.S. §15-779.02) Areas of Identification [A.R.S. §15-203(A)(15)] GRADE K 1 2 3 4 5 6 7 8 9 10 11 12 TOTAL 1. Quantitative Reasoning 0 0 0 1 5 4 11 18 21 0 0 0 0 60 1. 2. Verbal Reasoning 0 0 0 0 0 1 0 0 3 0 0 0 0 4 2. 3. Nonverbal Reasoning 0 2 9 9 12 13 9 13 17 0 0 0 0 84 3. 4. Total Duplicated Enrollment (lines 1-3) 0 2 9 10 17 18 20 31 41 0 0 0 0 148 4. B. ENROLLMENT OF GIFTED PUPILS BY ETHNICITY Total Number D. MAINTENANCE AND OPERATION EXPENDITURES FOR GIFTED PUPILS (ELEMENTARY, SECONDARY, AND TOTAL) Gifted Pupils Actual Expenditures for all Gifted Programs: 1. White, not Hispanic 0 K-8 $ 0 2. Black, not Hispanic 1 9-12 $ 0 3. Hispanic 124 Total $ 0 4. American Indian/Alaskan Native 0 5. Asian or Pacific Islander 3 E. MAINTENANCE AND OPERATION DETAIL BY OBJECT CODE 6. Total Unduplicated Enrollment (lines 1-5) 128 BUDGET ACTUAL 1. Utilities 2,360,034 2,122,369 1. C. M&O AND SCA FUND SPECIAL EDUCATION PROGRAMS BY TYPE 2. Tuition Out Debt Service 6565 0 0 2. PROGRAM PROGRAM 3. Audit Services - Nonfederal (1) 6350 35,500 27,500 3. 200 TOTAL 200 TOTAL BUDGET BUDGET ACTUAL ACTUAL F. MAINTENANCE AND OPERATION EXPENDITURES FOR CAREER LADDER PROGRAM 1. Autism 474,252 474,252 271,913 271,913 1. Actual Expenditures made in FY 2011 $ 0 2. Emotional Disability 383,647 383,647 350,655 350,655 2. 3. Hearing Impairment 161,043 161,043 88,383 88,383 3. G. MAINTENANCE AND OPERATION EXPENDITURES FOR OPTIONAL PERFORMANCE INCENTIVE PROGRAM 4. Other Health Impairments 0 0 0 0 4. Actual Expenditures made in FY 2011 $ 0 5. Specific Learning Disability 1,679,552 1,679,552 1,522,893 1,522,893 5. 6. Mild, Moderate or Severe Mental Retardation 602,318 602,318 581,820 581,820 6. H. MAINTENANCE AND OPERATION EXPENDITURES FOR PERFORMANCE PAY 7. Multiple Disabilities 35,677 35,677 34,606 34,606 7. Actual Expenditures made in FY 2011 $ 0 8. Multiple Disabilities with Severe Sensory Impair. 0 0 0 0 8. 9. Orthopedic Impairment 0 0 0 0 9. 10. Developmental Delay 176,120 176,120 175,465 175,465 10. I. TUITION Tuition Expenditures 11. Preschool Severe Delay 215,630 215,630 307,306 307,306 11. 12. Speech/Language Impairment 1,220,957 1,220,957 1,308,307 1,308,307 12. Operations Capital Debt Total 13. Traumatic Brain Injury 0 0 0 0 13. 1. Type 03 districts-Tuition to Other Arizona Districts 14. Visual Impairment 66,150 66,150 58,343 58,343 14. for high school students only (objects 6561 & 6565) 0 0 0 0 1. 15. Subtotal (lines 1-14) 5,015,346 5,015,346 4,699,691 4,699,691 15. 2. Tuition to Other Arizona Districts not included on line 1 16. Gifted Education 0 0 0 0 16. (object 6561) 0 0 0 2. 17. Remedial Education 0 0 0 0 17. 3. Tuition to Out-of-State Districts (object 6562) 0 0 0 3. 18. ELL Incremental Costs 0 0 0 0 18. 4. Tuition to Private Schools (object 6563) 269,258 0 269,258 4. 19. ELL Compensatory Instruction 712,121 712,121 851,051 851,051 19. 5. Tuition to Ed ServicesCoopsIGAs (object 6564) 0 0 0 5. 20. Vocational and Technological Education 0 0 0 0 20. 6. Tuition Other (object 6569) 0 0 0 6. 21. Career Education 0 0 0 0 21. 7. Total (lines 1-6) 0 0 0 0 7. 22. Total (lines 15-21) 5,727,467 5,727,467 5,550,742 5,550,742 22. (1) Enter the FY 2011 M&O expenditures related to audits of nonfederal funds on line E.3. Districts may also include additional federal audit expenditures incurred as a result of ARRA-SFSF monies received on line E.3. The total federal audit service expenditures made in FY 2011 from all funds were $ 0 ADE/AG 41-202 Rev. 8/11-FY 2011 11/9/2011 10:13 AM Page 3 of 9
- 5. DISTRICT NAME ISAAC SCHOOL DISTRICT NO. 5 COUNTY MARICOPA CTDS NUMBER 070405000 CLASSROOM SITE FUNDS (011, 012, AND 013) —REVENUES, EXPENDITURES, AND FUND BALANCES Beginning Purchased Services Total Expenditures % Increase/ Ending Revenues and Expenditure Function Codes Fund Actual Salaries Employee Benefits 6300, 6400, Supplies Other Interest Decrease in Fund Budget Actual Prior Year Actual Balance Revenues 6100 6200 6500 (1) 6600 6850 (2) Actual Balance Classroom Site Fund 011 - Base Salary Revenues CSF Allocation (20%) 1. 327,703 1. (1) For FY 2011, the district received Classroom Site Fund revenue of Interest Income 2. 250 2. 0 and expended 0 in Fund 010, Total Revenues (lines 1 and 2) 3. 327,953 3. object code 6590 for Classroom Site Fund pass-through payments to Expenditures district-sponsored charter schools. This amount is not included in the 100 Regular Education amounts reported for Fund 013. 1000 Classroom Instruction 4. 168,170 30,857 416,076 199,027 338,932 -41.3% 4. 2100 Support Services - Students 5. 0 0 0 0 0 0.0% 5. (2) Include amounts expended for registered warrant expense in Funds 011, 2200 Support Services - Instructional Staff 6. 0 0 0 0 0 0.0% 6. 012, and 013 on lines 16, 32, and 48, respectively. Program 100 Subtotal (lines 4-6) 7. 168,170 30,857 416,076 199,027 338,932 -41.3% 7. 200 Special Education 1000 Classroom Instruction 8. 0 0 0 0 0 0.0% 8. 2100 Support Services - Students 9. 0 0 0 0 0 0.0% 9. 2200 Support Services - Instructional Staff 10. 0 0 0 0 0 0.0% 10. Program 200 Subtotal (lines 8-10) 11. 0 0 0 0 0 0.0% 11. 1000 Classroom Instruction 12. 0 0 0 0 52,217 -100.0% 12. 2100 Support Services - Students 13. 0 0 0 0 0 0.0% 13. 2200 Support Services - Instructional Staff 14. 0 0 0 0 0 0.0% 14. Other Programs Subtotal (lines 12-14) 15. 0 0 0 0 52,217 -100.0% 15. Total Classroom Site Fund 011 - Base Salary 16. (135,545) 327,953 168,170 30,857 0 416,076 199,027 391,149 -49.1% (6,619) 16. Classroom Site Fund 012 - Performance Pay Revenues CSF Allocation (40%) 17. 655,406 17. Interest Income 18. 500 18. Total Revenues (lines 17 and 18) 19. 655,906 19. Expenditures 100 Regular Education 1000 Classroom Instruction 20. 553,878 94,709 1,411,546 648,587 917,438 -29.3% 20. 2100 Support Services - Students 21. 0 0 0 0 0 0.0% 21. 2200 Support Services - Instructional Staff 22. 0 0 0 0 0 0.0% 22. Program 100 Subtotal (lines 20-22) 23. 553,878 94,709 1,411,546 648,587 917,438 -29.3% 23. 200 Special Education 1000 Classroom Instruction 24. 0 0 0 0 0 0.0% 24. 2100 Support Services - Students 25. 0 0 0 0 0 0.0% 25. 2200 Support Services - Instructional Staff 26. 0 0 0 0 0 0.0% 26. Program 200 Subtotal (lines 24-26) 27. 0 0 0 0 0 0.0% 27. 1000 Classroom Instruction 28. 0 0 0 0 0 0.0% 28. 2100 Support Services - Students 29. 0 0 0 0 0 0.0% 29. 2200 Support Services - Instructional Staff 30. 0 0 0 0 0 0.0% 30. Other Programs Subtotal (lines 28-30) 31. 0 0 0 0 0 0.0% 31. Total Classroom Site Fund 012 - Performance Pay 32. 340,305 655,906 553,878 94,709 0 1,411,546 648,587 917,438 -29.3% 347,624 32. Classroom Site Fund 013 - Other Revenues CSF Allocation (40%) 33. 655,406 33. Interest Income 34. 500 34. Total Revenues (lines 33 and 34) 35. 655,906 35. Expenditures 100 Regular Education 1000 Classroom Instruction 36. 428,582 78,609 0 0 965,879 507,191 696,167 -27.2% 36. 2100 Support Services - Students 37. 0 0 0 0 0 0 0 0.0% 37. 2200 Support Services - Instructional Staff 38. 0 0 0 0 0 0 0 0.0% 38. Program 100 Subtotal (lines 36-38) 39. 428,582 78,609 0 0 965,879 507,191 696,167 -27.2% 39. 200 Special Education 1000 Classroom Instruction 40. 0 0 0 0 0 0 0 0.0% 40. 2100 Support Services - Students 41. 0 0 0 0 0 0 0 0.0% 41. 2200 Support Services - Instructional Staff 42. 0 0 0 0 0 0 0 0.0% 42. Program 200 Subtotal (lines 40-42) 43. 0 0 0 0 0 0 0 0.0% 43. 530 Dropout Prevention Programs 1000 Classroom Instruction 44. 0 0 0 0 0 0 0 0.0% 44. 1000 Classroom Instruction 45. 0 0 0 0 0 0 0 0.0% 45. 2100, 2200 Support Serv. Students & Instructional Staff 46. 0 0 0 0 0 0 0 0.0% 46. Other Programs Subtotal (lines 45 and 46) 47. 0 0 0 0 0 0 0 0.0% 47. Total Classroom Site Fund 013 - Other 48. (24,725) 655,906 428,582 78,609 0 0 0 965,879 507,191 696,167 -27.2% 123,990 48. Total Classroom Site Funds (lines 16, 32, and 48) 49. 180,035 1,639,765 1,150,630 204,175 0 0 0 2,793,501 1,354,805 2,004,754 -32.4% 464,995 49. ADE/AG 41-202 Rev. X/11-FY 2011 11/9/2011 10:13 AM Page 4 of 9
- 6. DISTRICT NAME ISAAC SCHOOL DISTRICT NO. 5 COUNTY MARICOPA CTDS NUMBER 070405000 UNRESTRICTED CAPITAL OUTLAY (610) and SOFT CAPITAL ALLOCATION (625) FUNDS—EXPENDITURES Library Books, All Other All Other Totals % Textbooks, & Redemption of Object Codes Object Codes Increase/ Expenditures Rentals Instructional Aids Property Principal Interest (UCO & SCA-type (M&O-type Budget Actual Prior Year Actual Decrease 6440 6641-6643 6700 6830 6840, 6850 excluding 6900) excluding 6900) (2) in Actual Unrestricted Capital Outlay Override (1) 1. 0 0 0 0 0 0 0 0 0 0.0% 1. Unrestricted Capital Outlay Fund 610 1000 Instruction 2. 0 0 0 0 0 0 18,857 -100.0% 2. 2000 Support Services 2100, 2200 Students and Instructional Staff 3. 0 0 47,338 0 49,500 47,338 3,484 1258.7% 3. 2300, 2400, 2500, 2900 Administration 4. 150,108 586,778 0 0 3,355,761 736,886 461,084 59.8% 4. 2600 Operation & Maintenance of Plant 5. 0 113,329 0 112,300 113,329 26,708 324.3% 5. 2700 Student Transportation 6. 0 4,582 0 145,000 4,582 150,258 -97.0% 6. 3000 Operation of Noninstructional Services 7. 0 13,403 0 50,000 13,403 11,733 14.2% 7. 4000 Facilities Acquisition and Construction 8. 0 385,811 88,360 760,000 474,171 634,786 -25.3% 8. 5000 Debt Service 9. 0 0 0 0 0 0.0% 9. Total Unrestricted Capital Outlay Fund (lines 2-9) 10. 150,108 0 1,151,241 0 0 88,360 4,472,561 1,389,709 1,306,910 6.3% 10. Soft Capital Allocation Fund 625 1000 Instruction 11. 0 236,012 178,693 0 0 1,806,613 414,705 421,409 -1.6% 11. 2000 Support Services 2100, 2200 Students and Instructional Staff 12. 0 685,531 0 0 0 818,770 685,531 644,535 6.4% 12. 2300, 2400, 2500, 2900 Administration 13. 0 0 0 0 0 0 0 581,814 -100.0% 13. 2600 Operation & Maintenance of Plant 14. 0 0 0 0 0 0 447,360 -100.0% 14. 2700 Student Transportation 15. 0 0 0 0 0 0 0 0.0% 15. 3000 Operation of Noninstructional Services 16. 0 0 0 0 0 0 0 0.0% 16. 4000 Facilities Acquisition and Construction 17. 0 0 0 0 0 0 85,127 -100.0% 17. 5000 Debt Service 18. 0 0 0 0 0 0.0% 18. Total Soft Capital Allocation Fund (lines 11-18) 19. 0 921,543 178,693 0 0 0 0 2,625,383 1,100,236 2,180,245 -49.5% 19. (1) Amounts in the Unrestricted Capital Outlay Override, line 1 above, must also be included in the Unrestricted Capital Outlay Fund (610) individual line items. (2) Laws 2010, 7th Special Session, Ch. 8, §14, allowed school districts to use soft capital allocation monies for any operating or capital expenditures in FY 2011. Therefore, this column should include any M&O-type expenditures made from the Soft Capital Allocation Fund. CAPITAL ASSETS AS OF JUNE 30, 2011 Land and Improvements $9,393,002 1. Buildings and Improvements $74,041,036 2. Furniture, Equipment, Vehicles, and Technology $9,044,287 3. Construction in Progress $1,986,379 4. Total $94,464,704 5. ADE/AG 41-202 Rev. 8/11-FY 2011 11/9/2011 10:13 AM Page 5 of 9
- 7. DISTRICT NAME ISAAC SCHOOL DISTRICT NO. 5 COUNTY MARICOPA CTDS NUMBER 070405000 CAPITAL FUNDS (630, 690, and 695) —EXPENDITURES Library Books, Totals Employee Textbooks, & Redemption Other All Other Expenditures Salaries Benefits Instructional Aids Property of Principal Interest Object Codes Budget Actual 6100 6200 6641-6643 6700 6830 6850 (excluding 6900) Bond Building Fund 630 1000 Instruction 1. 0 0 0 0 1. 2000 Support Services 2100, 2200 Students and Instructional Staff 2. 0 0 0 0 2. 2300, 2400, 2500, 2900 Administration 3. 0 0 0 0 3. 2600 Operation & Maintenance of Plant 4. 0 0 0 0 4. 2700 Student Transportation 5. 0 0 0 0 5. 3000 Operation of Noninstructional Services 6. 0 0 0 0 6. 4000 Facilities Acquisition and Construction 7. 0 0 0 0 0 0 7. 5000 Debt Service 8. 0 0 0 0 8. Total Bond Building Fund (lines 1-8) 9. 0 0 0 0 0 0 0 0 9. Building Renewal Fund 690 1000 Instruction 10. 0 0 0 0 10. 2000 Support Services 2100, 2200 Students and Instructional Staff 11. 0 0 0 0 11. 2300, 2400, 2500, 2900 Administration 12. 0 0 0 0 12. 2600 Operation & Maintenance of Plant 13. 0 0 0 0 260,462 0 13. 2700 Student Transportation 14. 0 0 0 0 14. 3000 Operation of Noninstructional Services 15. 0 0 0 0 15. 4000 Facilities Acquisition and Construction 16. 0 0 0 0 0 0 16. 5000 Debt Service 17. 0 0 0 0 17. Total Building Renewal Fund (lines 10-17) 18. 0 0 0 0 0 0 260,462 0 18. New School Facilities Fund 695 1000 Instruction 19. 0 0 0 0 0 19. 2000 Support Services 2100, 2200 Students and Instructional Staff 20. 0 0 0 0 0 20. 2300, 2400, 2500, 2900 Administration 21. 0 0 0 0 21. 2600 Operation & Maintenance of Plant 22. 0 0 0 0 22. 2700 Student Transportation 23. 0 0 0 0 23. 3000 Operation of Noninstructional Services 24. 0 0 0 0 24. 4000 Facilities Acquisition and Construction 25. 0 0 0 0 0 0 25. 5000 Debt Service 26. 0 0 0 0 26. Total New School Facilities Fund (lines 19-26) 27. 0 0 0 0 0 0 0 0 0 27. ADE/AG 41-202 Rev. 8/11-FY 2011 11/9/2011 10:13 AM Page 6 of 9
- 8. DISTRICT NAME ISAAC SCHOOL DISTRICT NO. 5 COUNTY MARICOPA CTDS NUMBER 070405000 Capital Funds (630, 690, and 695) BUDGET ACTUAL DEBT SERVICE ADJACENT WAYS Bond Building Fund 630 FUND 700 FUND 620 Beginning Fund Balance 1. 0 1. BUDGET ACTUAL BUDGET ACTUAL Revenues 2. 0 2. Beginning Fund Balances 1. 53,452 602,186 1. Other Financing Sources 3. 0 3. Total Available (lines 1-3) 4. 0 4. Revenues & Other Sources Expenditures 1110 Property Taxes 2. 80,578 187,847 2. Renovation 5. 0 0 5. 1280 Revenue in Lieu of Taxes 3. 0 1,716 3. New Construction 6. 0 0 6. 1300 Tuition 4. 0 4. Other 7. 0 0 7. 1400 Transportation Fees 5. 0 5. Total Expenditures (lines 5-7) 8. 0 0 8. 1500 Investment Income 6. 1,082 7,086 6. Other Financing Uses 9. 0 0 9. Other Local ______________ 7. 0 0 7. Ending Fund Balance (line 4 minus lines 8 and 9) 10. 0 10. State ______________ 8. 0 8. 5100 Issuance of Bonds 9. 0 9. Building Renewal Fund 690 5200 Fund Transfers-In 10. 0 0 10. Beginning Fund Balance 11. 261,820 11. Total Revenues & Other Sources Revenues 12. 2,757 12. (lines 2-10) 11. 81,660 196,649 11. Total Available (lines 11 and 12) 13. 264,577 13. Total Available Expenditures (lines 1 and 11) 12. 135,112 798,835 12. Renovation 14. 0 0 14. Other 15. 260,462 0 15. Expenditures & Other Uses Total Expenditures (lines 14 and 15) 16. 260,462 0 16. 6830 Redemption of Principal 13. 0 0 13. Ending Fund Balance (line 13 minus line 16) 17. 264,577 17. 6840-6850 Interest 14. 0 0 14. 6100-6800 Other Expenditures 15. 0 138,649 15. New School Facilities Fund 695 Total Expenditures (lines 13-15) 16. 0 0 803,901 138,649 16. Beginning Fund Balance 18. 3,103 18. 6930 Fund Transfers-Out 17. 0 0 17. Revenues 19. (3,103) 19. 6940 Pymt. to Escrow Agent for Def. of Debt 18. 0 18. Total Available (lines 18 and 19) 20. 0 20. Total Expenditures & Other Uses Expenditures (lines 16-18) 19. 0 138,649 19. New Construction 21. 0 0 21. Other 22. 0 0 22. Ending Fund Balances Total Expenditures (lines 21 and 22) 23. 0 0 23. (line 12 minus line 19) 20. 135,112 660,186 20. Ending Fund Balance (line 20 minus line 23) 24. 0 24. BUDGET ACTUAL Funds 630 and 695 Instructional Improvement Fund 020 1. New construction cost per square foot $ 0 Beginning Fund Balance 1. 404,693 1. 2. Land acquisition costs $ 0 Revenues 2. 269,127 2. Total Available (lines 1 and 2) 3. 673,820 3. Expenditures Teacher Compensation Increases 4. 175,000 164,060 4. Class Size Reduction 5. 0 0 5. Dropout Prevention Programs 6. 0 0 6. Instructional Improvement Programs 7. 186,000 0 7. Total Expenditures (lines 4-7) 8. 361,000 164,060 8. Ending Fund Balance (line 3 minus line 8) 9. 509,760 9. ADE/AG 41-202 Rev. 8/11-FY 2011 11/9/2011 10:13 AM Page 7 of 9
- 9. DISTRICT NAME ISAAC SCHOOL DISTRICT NO. 5 COUNTY MARICOPA CTDS NUMBER 070405000 FEDERAL AND STATE PROJECTS FUND TRANSFERS BEGINNING (OUT) TO ENDING FUND FUND BALANCE REVENUE INDIRECT COSTS EXPENDITURES BALANCE FEDERAL PROJECTS ACTUAL ACTUAL ACTUAL BUDGET ACTUAL ACTUAL 100-130 ESEA Title I - Helping Disadvantaged Children 1. 2,193,672 5,026,564 (296,185) 7,649,149 6,032,067 891,984 1. 140-150 ESEA Title II - Prof. Development and Technology 2. (133,304) 752,631 (71,797) 1,179,157 645,956 (98,426) 2. 160 ESEA Title IV - 21st Century Schools 3. (128,871) 575,542 (800) 501,040 448,785 (2,914) 3. 170-180 ESEA Title V - Promote Informed Parent Choice 4. 0 0 0 0 0 0 4. 190 ESEA Title III - Limited English & Immigrant Students 5. (119,764) 549,620 (11,913) 1,372,831 585,451 (167,508) 5. 200 ESEA Title VII - Indian Education 6. 0 0 0 0 0 0 6. 210 ESEA Title VI - Flexibility and Accountability 7. 0 0 0 0 0 0 7. 220 IDEA Part B 8. (606,372) 1,378,318 (15,761) 1,608,662 1,340,620 (584,435) 8. 230 Johnson-O'Malley 9. 0 0 0 0 0 0 9. 240 Workforce Investment Act 10. 0 0 0 0 0 0 10. 250 AEA-Adult Education 11. 0 0 0 0 0 0 11. 260-270 Vocational Education - Basic Grants 12. 0 0 0 0 0 0 12. 280 ESEA Title X - Homeless Education 13. (11,219) 15,219 0 4,124 4,000 0 13. 290 Medicaid Reimbursement 14. 302,241 303,604 0 250,000 266,762 339,083 14. 3___ E-Rate 15. 329,431 709,490 0 275,000 386,064 652,857 15. 3___ Impact Aid 16. 0 0 0 0 0 16. 300-399 Other Federal Projects (exclude E-Rate & Impact Aid) 17. (970) 1,045,370 0 2,299,917 1,085,155 (40,755) 17. Total Federal Project Funds (lines 1-17) 18. 1,824,844 10,356,358 (396,456) 15,139,880 10,794,860 989,886 18. STATE PROJECTS 400 Vocational Education 19. 0 0 0 0 0 19. 410 Early Childhood Block Grant 20. 0 259,200 259,200 168,384 90,816 20. 420 Ext. School Yr. - Pupils with Disabilities 21. 0 0 0 0 0 21. 425 Adult Basic Education 22. 0 0 0 0 0 22. 430 Chemical Abuse Prevention Programs 23. 0 0 0 0 0 23. 435 Academic Contests 24. 0 0 0 0 0 24. 445 Dropout Prevention Program (grades 4-12) 25. 0 0 0 0 0 25. 450 Gifted Education 26. 12,243 0 12,243 3,739 8,504 26. 455 Family Literacy Pilot Program 27. 0 0 0 0 0 27. 460 Environmental Special Plate 28. 0 0 0 0 0 28. 465-499 Other State Projects 29. 483 232,361 223,281 223,281 9,563 29. Total State Project Funds (lines 19-29) 30. 12,726 491,561 494,724 395,404 108,883 30. Total Federal and State Projects (lines 18 and 30) 31. 1,837,570 10,847,919 (396,456) 15,634,604 11,190,264 1,098,769 31. ADE/AG 41-202 Rev. 8/11-FY 2011 11/9/2011 10:13 AM Page 8 of 9