Scale Up Performance with Intel® Development
•
2 gefällt mir•768 views

A walk through the scaled up performance from Intel Cluster Studio XE & Intel Parallel Studio XE

Empfohlen
Empfohlen
Weitere ähnliche Inhalte
Was ist angesagt?
Was ist angesagt? (20)
Andere mochten auch
Andere mochten auch (16)
Ähnlich wie Scale Up Performance with Intel® Development
Ähnlich wie Scale Up Performance with Intel® Development (20)
Mehr von Intel IT Center
Mehr von Intel IT Center (18)
Scale Up Performance with Intel® Development
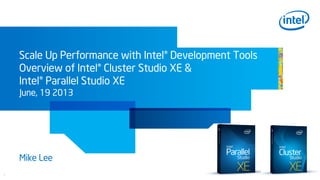
- 1. 1 Scale Up Performance with Intel® Development Tools Overview of Intel® Cluster Studio XE & Intel® Parallel Studio XE June, 19 2013 Mike Lee
- 2. 2 vision span from few cores to many cores with consistent models, languages, tools, and techniques 2
- 3. 3 Multicore CPU Multicore CPU Intel® MIC architecture coprocessor Source Compilers Libraries, Parallel Models 3
- 4. 4 Multicore CPU Multicore CPU Intel® MIC architecture coprocessor Source Compilers Libraries, Parallel Models Game Changer “Unparalleled productivity… most of this software does not run on a GPU” - Robert Harrison, NICS, ORNL “R. Harrison, “Opportunities and Challenges Posed by Exascale Computing - ORNL's Plans and Perspectives”, National Institute of Computational Sciences, Nov 2011” 4
- 5. 5 Intel® Inspector XE, Intel® VTune™ Amplifier XE, Intel® Advisor Intel® C/C++ and Fortran Compilers w/OpenMP Intel® MKL, Intel® Cilk Plus, Intel® TBB, and Intel® IPP Intel® Parallel Studio XE + Intel® Trace Analyzer and Collector + Intel® MPI Library 5
- 6. 6 Intel® Inspector XE, Intel® VTune™ Amplifier XE, Intel® Advisor Intel® C/C++ and Fortran Compilers w/OpenMP Intel® MKL, Intel® Cilk Plus, Intel® TBB, and Intel® IPP Intel® Parallel Studio XE Intel® Trace Analyzer and Collector 6
- 7. 7 • Industry-leading performance from advanced compilers • Comprehensive libraries • Parallel programming models • Insightful analysis tools More Cores. Wider Vectors. Performance Delivered. Intel® Parallel Studio XE 2013 and Intel® Cluster Studio XE 2013 Serial Performance Scaling Performance Efficiently Task & Data Parallel Performance Distributed Performance Multicore Many-core 128 Bits 256 Bits 512 Bits 50+ cores More Cores Wider Vectors
- 8. 8 Support for Latest Intel Processors and Coprocessors Intel® Ivy Bridge microarchitecture Intel® Haswell microarchitecture Intel® Xeon Phi™ coprocessor Intel® C++ and Fortran Compiler ✔ AVX ✔ AVX2, FMA3 ✔ IMCI Intel® TBB library ✔ ✔ ✔ Intel® MKL library ✔ AVX ✔ AVX2, FMA3 ✔ Intel® MPI library ✔ ✔ ✔ Intel® VTune™ Amplifier XE† ✔ Hardware Events ✔ Hardware Events ✔ Hardware Events Intel® Inspector XE ✔ Memory & Thread Checks ✔ Memory & Thread ✔ Memory & Thread†† † Hardware events for new processors added as new processors ship. †† Analysis runs on multicore processors, provides analysis for multicore and many-core processors.
- 9. 9 A Family of Parallel Programming Models Developer Choice Intel® Cilk™ Plus C/C++ language extensions to simplify parallelism Open sourced Also an Intel product Intel® Threading Building Blocks Widely used C++ template library for parallelism Open sourced Also an Intel product Domain-Specific Libraries Intel® Integrated Performance Primitives Intel® Math Kernel Library Established Standards Message Passing Interface (MPI) OpenMP* Coarray Fortran OpenCL* Research and Development Intel® Concurrent Collections Offload Extensions Intel® SPMD Parallel Compiler Choice of high-performance parallel programming models Applicable to Multicore and Many-core Programming Delivered with Intel® Cluster Studio XE
- 10. 10 Phase Product Feature Benefit Build Intel® MPI Library High Performance Message Passing (MPI) Library • Enabling High Performance Scalability, Interconnect Independence, Runtime Fabric Selection, and Application Tuning Capability Intel® Composer XE C/C++ and Fortran compilers and performance libraries • Intel® Threading Building Blocks • Intel® Cilk™ Plus • Intel® Integrated Performance Primitives • Intel® Math Kernel Library • Enabling solution to achieve the application performance and scalability benefits of multicore and forward scale to many-core Verify Intel® Inspector XE Memory & threading dynamic analysis for code quality Static Security Analysis for code quality • Increased productivity, code quality, and lowers cost, finds memory, threading , and security defects before they happen • Now MPI enabled at every cluster node Verify & Tune Intel® Trace Analyzer & Collector MPI Performance Profiler for understanding application correctness & behavior • Analyze performance of MPI programs and visualize parallel application behavior and communications patterns to identify hotspots Tune Intel® VTune™ Amplifier XE Performance Profiler for optimizing application performance and scalability • Remove guesswork, saves time, makes it easier to find performance and scalability bottlenecks • Now MPI enabled at every cluster node Intel® Cluster Studio XE Tools to Scale Forward, Scale Faster – for HPC Clusters Embargoed Until
- 11. 11 Intel ® Composer XE – HPC Compilers & Libraries Great Application Performance Serial or Parallel Programming Scale Forward & Flexibility Target Multicore & Manycore Systems on Linux*, Windows*, and OSX* Standards Driven Compilers Acclaimed Fortran and C++ Compilers. Remarkable performance improvements with just a simple recompile Parallel Programming Models & Libraries Intel® TBB, Intel® Cilk™ Plus, Intel® OpenMP, Intel® Coarray Fortran, Intel® IPP & Intel® MKL
- 12. 12 Improved Compiler and Library Performance
- 13. 13 13 Intel® Cilk™ Plus • 3 simple keywords & array notations for parallelism • Support for task and data parallelism • Semantics similar to serial code • Simple way to parallelize your code • Sequentially consistent, low overhead, powerful solution Intel® Threading Building Blocks • Parallel algorithms and data structures • Scalable memory allocation and task scheduling • Synchronization primitives • Rich feature set for general purpose parallelism • Available as open source or commercial license Language extensions to simplify task/data parallelism Widely used C++ template library for task parallelism Compilers & LibrariesIntel® Cilk™ Plus & Intel® Threading Building Blocks Composibility Utilize appropriate parallelism model in the same application with both Intel® Cilk™ Plus & Intel® Threading Building Blocks. Simplify Parallelism Implement parallelism through open sourced models with simple language extensions/keywords & template libraries Scale Forward & Flexibility Target Multicore & Manycore Systems on Linux*, Windows*, and OSX*
- 14. 14 14 Compilers & LibrariesIntel® OpenMP OpenMP* 4.0 RC1 & TR1 Intel® C++ and Fortran Compiler adds support for SIMD extensions and target extensions. 16 Years and Counting… Intel supports and advances standards to advance the HPC industry Available Now in Intel® Compilers Intel® Fortran Composer XE 2013 Update 2 (version 13.1) Intel® C++ Composer XE Update 2 (version 13.1) Welcome OpenMP 4.0!
- 15. 15 “Fast and accurate state of the art general purpose CFD solvers is the focus at S & I Engineering Solutions Pvt, Ltd. Scalability and efficiency are key to us when it comes to our choice and use of MPI Libraries. The Intel® MPI Library has enabled us to scale to over 10k cores with high efficiency and performance.” Nikhil Vijay Shende, Director,S & I Engineering Solutions, Pvt. Ltd. Full Hybrid Support Finely tuned control over threaded and OpenMP* hybrid regions for multicore and manycore systems Sustainable Scalability Take advantage of reduced memory overhead and native fabric support resulting in lower latencies and higher bandwidth Optimized Performance Automatically employ optimized collectives via cluster- and application-level tuning Intel® MPI Library – Flexible, Efficient & Scalable
- 16. 16 Intel® MPI Library – Flexible, Efficient & Scalable
- 17. 17 “Intel MKL is indispensable for any high- performance user” Prof. Jack Dongarra, Innovative Computing Lab, University of Tennessee Flexible, Scalable and Compatible Standard APIs for C & Fortran, Compatible with Present & Future Processors/Coprocessors, Compilers, OS’s, linking and threading models. Vectorized and Threaded Replace code with one of thousands of highly optimized functions for science, engineering and financial apps Comprehensive Math Functionality A wealth of threaded and vectorized complex math functions to accelerate a wide variety of software applications. Intel® Math Kernel Library – Performance Ready to Use
- 18. 18 Intel® Math Kernel Library – Performance Ready to Use
- 19. 19 Extensive & Rich Library Thousands of optimized functions covering frequently used fundamental algorithms including those for creating digital media, enterprise, data, embedded, communications, and scientific / technical applications. Optimized for Performance Using Intel® Streaming SIMD Extensions (Intel® SSE) and Intel® Advanced Vector Extensions (Intel® AVX) instruction will perform faster than what an optimized compiler can produce alone. Engineered to Save Time A Library of Highly Optimized Algorithmic Building Blocks for Media and Data Applications Intel® Integrated Performance Primitives – Performance Ready to Use
- 20. 20 Intel® Integrated Performance Primitives – Performance Ready to Use
- 21. 21 Intel ® Advisor XE – Data Driven Threading Design Simplifies and Speeds Threading Design Best Results with Parallelism Design Insight and Analysis Evaluate Return on Investment Performance benefit vs. the cost of transitioning to parallelism Simplifies adding Parallelism Shorter learning curve for parallelism by helping to identify and experiment with parallel opportunities Step-by-step Threading Guidance From surveying code, finding the best implementation, to checking correctness.
- 22. 22 Intel ® Advisor XE – Data Driven Threading Design Add Parallelism with Less Effort, Less Risk and More Impact
- 23. 23 Optimize Serial & Parallel Peformance Premier Performance Profiler Easy Performance optimization can be difficult, but the performance profiling tool you use shouldn’t be. Rich Set of Performance Profiles Collect a rich set of performance data for hotspots, threading, locks & waits, DirectX*, bandwidth and more. Mine Results & Understand Good data is not enough. Powerful analysis lets you sort, filter and visualize results on the timeline and on your source. Intel® VTune™ Amplifier XE - Performance Profiler “Last week, Intel® VTune™ Amplifier XE helped us find almost 3X performance improvement. This week it helped us improve the performance another 3X.” Claire Cates, Principal Developer, SAS Institute Inc
- 24. 24 Intel® VTune™ Amplifier XE - Performance Profiler Where is my application… Spending Time? Wasting Time? Waiting Too Long? • Focus tuning on functions taking time • See call stacks • See time on source • See cache misses on your source • See functions sorted by # of cache misses • See locks by wait time • Red/Green for CPU utilization during wait Advanced Profiling For Scalable Multicore Performance
- 25. 25 Intel ® Inspector XE – Dynamic Analysis Deliver More Reliable Applications Detect Memory & Threading Errors Flexible to Fit Workflow Inspect C, C++, C(#, F#, and Fortran. No special builds required. Inspects all code even without source Find Errors Early in Development Cycle Easy to use tool for serial and parallel applications enhances productivity, cut cost and speed time-to-results. Memory & Threading Errors Leaks, corruption, allocation/de-allocation, API mismatches, data races in stack and heap, deadlocks, and thread & sync API errors“We struggled for a week with a crash situation, …we ran Intel® Inspector XE and immediately found the array out of bounds that occurred long before the actual crash. We could have saved a week!” Mikael Le Guerroué, Senior Codec Architecture Engineer, Envivio
- 26. 26 Intel ® Trace Analyzer and Collector Profile MPI Communications Understand MPI Application Behavior Flexible to Fit Workflow Use at compile, link or run to capture trace data for your application. Powerful Analysis Find temporal dependencies in your code: bottlenecks, hotspots, and load balancing issues correctness checking Low Overhead & Effective Visualization Visualize and understand parallel application behavior at minimal cost to concentrate on relevant information quickly
- 27. 27 Learn More Copyright © 2012 Intel Corporation. All rights reserved. Intel, the Intel logo, Intel Sponsors of Tomorrow., and the Intel Sponsors of Tomorrow. logo are trademarks of Intel Corporation in the U.S. and other countries. Intel® Software Development Tools software.intel.com Free 30 Day Trials! Intel® Xeon® Processors & Intel® Xeon Phi™ Coprocessors www.intel.com/hpc Intel® Cluster Ready software.intel.com/cluster- ready http://software.intel.com/mic-developer Programming Resources – Forums, papers, trainings & labs
- 28. 28 INFORMATION IN THIS DOCUMENT IS PROVIDED “AS IS”. NO LICENSE, EXPRESS OR IMPLIED, BY ESTOPPEL OR OTHERWISE, TO ANY INTELLECTUAL PROPERTY RIGHTS IS GRANTED BY THIS DOCUMENT. INTEL ASSUMES NO LIABILITY WHATSOEVER AND INTEL DISCLAIMS ANY EXPRESS OR IMPLIED WARRANTY, RELATING TO THIS INFORMATION INCLUDING LIABILITY OR WARRANTIES RELATING TO FITNESS FOR A PARTICULAR PURPOSE, MERCHANTABILITY, OR INFRINGEMENT OF ANY PATENT, COPYRIGHT OR OTHER INTELLECTUAL PROPERTY RIGHT. Software and workloads used in performance tests may have been optimized for performance only on Intel microprocessors. Performance tests, such as SYSmark and MobileMark, are measured using specific computer systems, components, software, operations and functions. Any change to any of those factors may cause the results to vary. You should consult other information and performance tests to assist you in fully evaluating your contemplated purchases, including the performance of that product when combined with other products. Copyright © , Intel Corporation. All rights reserved. Intel, the Intel logo, Xeon, Xeon Phi, Core, VTune, and Cilk are trademarks of Intel Corporation in the U.S. and other countries. Optimization Notice Intel’s compilers may or may not optimize to the same degree for non-Intel microprocessors for optimizations that are not unique to Intel microprocessors. These optimizations include SSE2, SSE3, and SSSE3 instruction sets and other optimizations. Intel does not guarantee the availability, functionality, or effectiveness of any optimization on microprocessors not manufactured by Intel. Microprocessor-dependent optimizations in this product are intended for use with Intel microprocessors. Certain optimizations not specific to Intel microarchitecture are reserved for Intel microprocessors. Please refer to the applicable product User and Reference Guides for more information regarding the specific instruction sets covered by this notice. Notice revision #20110804 Legal Disclaimer & Optimization Notice Copyright© 2012, Intel Corporation. All rights reserved. *Other brands and names are the property of their respective owners. 28 New Product
- 29. 29 Thank you