Qualaxy Dashboard - KPI Monitoring & Reporting
•
0 likes•98 views

Visual KPI management tool to monitor the performance of your workshop and quickly identify areas for improvement.

Recommended
Recommended
More Related Content
More from Infodream
More from Infodream (13)
Recently uploaded
Recently uploaded (20)
Qualaxy Dashboard - KPI Monitoring & Reporting
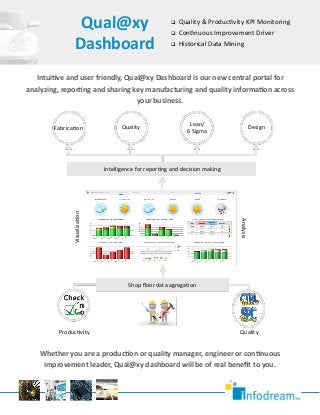
- 1. Intuitive and user friendly, Qual@xy Dashboard is our new central portal for analyzing, reporting and sharing key manufacturing and quality information across your business. Whether you are a production or quality manager, engineer or continuous improvement leader, Qual@xy dashboard will be of real benefit to you. Qual@xy Dashboard Quality & Productivity KPI Monitoring Continuous Improvement Driver Historical Data Mining Fabrication Quality Lean/ 6 Sigma Design Intelligence for reporting and decision making Shop floor data agregation QualityProductivity Analysis Visualization
- 2. 5 Key Features Infodream Inc. 999 Third Ave, Suite 700 Seattle, WA 98104 http://infodreamgroup.com/ 1. All key data in one place Qual@xy Dashboard brings together manufacturing data from all our shop floor software into one central dashboard. The concept is simple: A single tool for analyzing, visualizing and reporting key shop floor performance data for the complete enterprise at any level – from global business to low level product and process analysis. 2. Personalized, clear and visual reporting Qual@xy a visual tool. Clear color coded icons, charts and tables display whether targets are being met, and if not, where attention is needed. Users can define their own personal homepage and report templates to display only the information of interest. 3. Drive continuous improvement Qual@xy Dashboard is 100% focused on supporting your continuous improvement activities. Instantly see the performance of different business units, processes, machines and products. Qual@xy automatically identifies and prioritizes where improvements are needed and drill down functions allow you to quickly navigate from high level business reporting to low level detailed analysis drastically reducing manual analysis time. 4. Historical data mining The other key aspect of Qual@xy Dashboard is historical data mining which allows you to quickly retrieve raw data and detailed reports for production batches and serialized products. 5. Qual@xy for everyone Qual@xy Dashboard provides key data for many people within an organization ranging from business managers to process specialists. Therefore, in addition to coming as part of the standard SPC Vision and Check’n Go packages, it is available as a stand-alone web application. This provides a cost effective solution to increase the number of business users who will benefit from the dashboard features.