SlideShare ist ein Scribd-Unternehmen logo
1 von 7
Downloaden Sie, um offline zu lesen
Page 1
MARKET RESEARCH REPORTS TO DEFINE THE RIGHT STRATEGY
AND EXECUTE THROUGH TO THE SUCCESS
Click here to buy the report
Medical Ceramics – A Global Market Overview
“The report reviews, analyzes and projects the global market for Medical Ceramics for the period 2014-2022.”
Published: February 2017
Report Code: CP006
Pages: 312
Charts: 193
Price: $4500 Single User License, $7200 Enterprise License
SUMMARY
Ceramics constitute a family of materials that are produced by firing
non-metallic materials at high temperatures. Two of the most
common materials that can be utilized for manufacturing ceramics
include alumina and zirconia. These can be fabricated in such a way
as to increase their biocompatibility, following which they are called
medical ceramics or bioceramics and find application in the medical
industry. These materials are extensively employed in surgical
implants, prosthetics and a number of medical tools and devices.
The non-toxic nature and high mechanical strength of medical
ceramics, coupled with negligible or no tissue reaction are the
major characteristics that render them to be used in medical
applications. On the basis of type, medical ceramics are classified,
in this report, as Bioactive, Bioinert and Bioresorbable, with
Bioinert being the largest, as also the fastest growing category. In
comparison to metal and polymer materials, these ceramics are
inorganic, non-metallic solids that have strong compressive
strength and are brittle. Zirconia (ZrO2) and alumina (Al2O3) form
the two most widely used bioinert ceramics owing to their
chemical stability. Bioinert ceramics find application in bone tissue
applications due to their features, such as biocompatibility, non-
toxicity, non-inflammatory, non-allergic, non-carcinogenicity and
bio-functionality. These ceramics find wide use in dental and
orthopedic implants and demand for them in these areas is likely
to maintain rapid growth.
This global report analyzes the key applications of medical ceramics
including Dental Implants, Implantable Electronic Devices,
Orthopedic Implants, Surgical & Diagnostic Instruments and Other.
The global markets for the above-mentioned applications are
analyzed in terms of value in USD for 2014-2022 analysis period.
Accounting for an estimated share of 31.2% equating to US$4.2
billion in 2016, Dental Implants represent the largest application
area for Medical Ceramics globally, demand for which is forecast to
be US$4.5 billion in 2017 and is projected to reach US$6.2 billion by
2022 to reflect the fastest CAGR of 6.7% between 2017 and 2022.
The worldwide market for Medical Ceramics has been categorized
into five major regions namely North America, Europe, Asia-
Pacific, Latin America and Rest of World. The regional markets
further analyzed for 13 independent countries across North
America – The United States and Canada; Europe – France,
Germany, Italy, and the United Kingdom; Asia-Pacific – China,
India, Japan and South Korea; Latin America – Argentina, Brazil
and Mexico. The market for medical ceramics is analyzed in terms
of value in USD for each region by key country, ceramic type and
key applications.
This 312 page global medical ceramics market report includes 193
charts (includes a data table and graphical representation for each
chart), supported with meaningful and easy to understand
graphical presentation, of market numbers. This report profiles 44
key global players and 58 major players across North America –
24; Europe – 25; Asia-Pacific – 8 and Rest of World – 1. The
research also provides the listing of the companies engaged in
R&D, manufacturing and supply of medical ceramics. The global
list of companies covers the address, contact numbers and the
website addresses of 90 companies.
Global Medical Ceramics Market Analysis (2014-2022) in USD Million
2014 2018 2022
Page 2
Medical Ceramics – A Global Market Overview
February 2017 |312 Pages | 193 Charts | Price $4050
Click here to buy the report
SAMPLE COMPANY PROFILE
COORSTEK, INC. (UNITED STATES)
14143 Denver West Pkwy, Suite 400 Golden Colorado 80401
United States
Phone: 303 271 7000
Fax: 303-271-7009
Email: info@coorstek.com
Website: www.coorstek.com
Business Overview
Established in 1910 and based in Golden, Colorado, CoorsTek Inc.,
(CoorsTek) is one of the leading developer and manufacturer of
ceramics for semiconductor, oil and gas, electronics, energy,
medical, machinery, armor and defense markets. The company
offers analytical laboratory services such as brazing, bonding, and
joining services; custom components and assemblies; grinding,
lapping, and polishing services; laser machining services;
metalizing services; precision machine-to-print services; and
manufacturing consulting services. CoorsTek’s products include
rings, computer peripheral components, desiccator plates, ESD-
safe materials, food and beverage components, bonding tools,
hydro cyclone linings, implantable ceramics, knife blades, laser
equipment components, metallized ceramics, nozzles, optical
components, pulsation equipment, range igniters, semiconductor
components, tubes and rods, substrates, valves, wire
components, and X-ray tubes. The company operates research &
development centers across three continents and 600,000 square
meters of manufacturing space in over 50 manufacturing centers
worldwide, serving 10,000 customers with export locations
covering Europe, North America, South America, and Asia.
Product Portfolio
Product Type/uses
Implantable
Components
CoorsTek offers high-purity CeraSurf®-p medical ceramic
components and multi-material assemblies combining high-
performance ceramics, metals, and polymers to ensure
compatibility and longevity for implantable application.
Ceramic hip implant
components
CeraSurf®-p ceramic hip implant femoral heads and acetabular
liners (cups) demonstrate extreme durability and longevity
Neobone™ ceramic
bone substitute
NeoBone™ hydroxyapatite synthetic bone substitute is a
highly functional synthetic bone filler. Its porous, yet rigid
structure facilitates the penetration of tissue and provides
structure to aid in new tissue formation.
Engineered ceramics Ceramic materials are designed for optimal performance in
medical device applications including: biocompatibility,
superior chemical resistance, high strength & rigidity, thermal
stability, excellent high-temperature electrical resistivity.
Types include ceraPure custom medical ceramic components,
ceramic balls & ball blanks, laser ceramic components, valves
and valve components and micro dispense nozzles
Durable ceramic
materials & precision
CoorsTek provides an array of hard, durable, inert, and
corrosion-resistant components for pharmaceutical
manufacturing. Types include ceramic blades & sharpeners,
ceramic catalyst support media, grinding media, labware,
ceramic chemical converters, supports, gauzes, and ferrules,
tubes & rods, valves and valve components, pulsation
equipment and hard face seal components
…………………….more
SAMPLE TABLE/CHART
Glance at 2017 Global Medical Ceramics Market Share (%) by Geographic
Region – North America, Europe, Asia-Pacific, Latin America and Rest of World
Asia-Pacific Medical Ceramics Market Analysis (2014-2022) by Application –
Dental Implants, Implantable Electronic Devices, Orthopedic Implants,
Surgical & Diagnostic Instruments and Other Applications in USD Million
KEY PLAYERS PROFILED
· Advanced Industrial Ceramics
· Berkeley Advanced Biomaterials, Inc.
· Coorstek Medical LLC
· Coorstek, Inc.
· Depuy Synthes, Inc.
· Ferro-Ceramic Grinding, Inc.
· International Ceramic Engineering
· Kuraray Co., Ltd.
· Kyocera Corporation
· Lucideon Limited
· Micro Ceramics Limited
· Morgan Advanced Materials PLC
· Murata Manufacturing Company, Ltd.
· Noritake Co., Limited
· Precision Ferrites & Ceramics
· Refractron Technologies Corporation
· Saint-Gobain Ceramics & Plastics, Inc.
· Stryker Corporation
· Superior Technical Ceramics Corporation
· T.Q. Abrasive Machining Company
· TRS Technologies, Inc.
· Zimmer Biomet Holdings, Inc.
…………………….more
2014 2018 2022
Page 3
Medical Ceramics – A Global Market Overview
February 2017 |312 Pages | 193 Charts | Price $4050
Click here to buy the report
TABLE OF CONTENTS
PART A: GLOBAL MARKET PERSPECTIVE ........ 1
1. INTRODUCTION ..................................................1
Chart 1: Trending of Medical Ceramics Market (2014, 2017
and 2022) by Ceramic Type .............................................. 1
Chart 2: Trending of Medical Ceramics Market (2014, 2017
and 2022) by Application.................................................. 2
Chart 3: Trending of Medical Ceramics Market (2014, 2017
and 2022) by Geographic Region...................................... 3
1.1 Product Outline.................................................... 4
1.1.1 An Overview of Medical Ceramics .................... 4
Table 1: Some of the Important Clinical Applications of
Bioceramics...................................................................... 5
1.1.2 Classification of Medical Ceramics.................... 5
Table 2: Types of Bioceramic-Tissue interactions ............. 5
1.1.2.1 Bioactive Ceramics......................................... 6
Table 3: Bioactive Ceramic Mechanical Properties in
Comparison to Natural Bone and AW-GC......................... 6
1.1.2.2 Bioinert Ceramics........................................... 8
Table 4: A Comparison of Mechanical Properties of PSZs
with New Alumina Ceramic (Grain size < 2 μm)................ 9
1.1.2.3 Bioresorbable Ceramics ............................... 11
Table 5: Some of Important Biomedical Applications of
Bioceramics.....................................................................14
2. MEDICAL CERAMICS APPLICATION – A MARKET
SNAPSHOT............................................................15
2.1 Dental Implants ................................................. 15
Chart 4: Global Trending (2017-2022) of Medical Ceramic
Applications in Dental Implants.......................................15
2.1.1 Ceramics as Dental Implant Coatings.............. 15
Table 6: Ceramic Coatings in Various Forms of Dental
Implants and their Chemical Composition.......................15
2.1.2 Ceramics as Dental Implant Materials ............ 16
2.2 Implantable Electronic Devices.......................... 19
Chart 5: Global Trending (2017-2022) of Medical Ceramic
Applications in Implantable Electronic Devices ...............19
2.3 Orthopedic Implants.......................................... 21
Chart 6: Global Trending (2017-2022) of Medical Ceramic
Applications in Orthopedic Implants ...............................21
2.3.1 First Generation Ceramics............................... 21
2.3.2 Second Generation Ceramics.......................... 22
2.4 Surgical & Diagnostic Instruments ..................... 24
Chart 7: Global Trending (2017-2022) of Medical Ceramic
Applications in Surgical & Diagnostic Instruments...........24
2.5 Other Applications............................................. 26
Chart 8: Global Trending (2017-2022) of Medical Ceramics
in Other Applications.......................................................26
3. KEY MARKET TRENDS........................................27
3.1 Medical Ceramics Market: Buffeted by Challenges,
Buoyed by Opportunities......................................... 27
3.2 3D Printed Assisting in Developing Bioceramic
Implants for Repairing Bones................................... 29
3.3 Hip Joint Replacements Augmented with Ceramic
Materials.................................................................. 30
3.4 Titanium Loses the Dental Implants Race to
Zirconia.................................................................... 32
3.5 Innovative Biomaterials for Orthopedic Implants....33
4. KEY GLOBAL PLAYERS........................................35
Advanced Industrial Ceramics (United States).................35
Apc International, Ltd. (United States) ............................36
Avx Corporation (United States)......................................37
Barat Ceramics GmbH (Germany)....................................38
Berkeley Advanced Biomaterials, Inc. (United States) .....39
Ceramtec GmbH (Germany) ...........................................40
Ceraroot S.L (Spain).........................................................41
Coorstek, Inc. (United States)..........................................42
Coorstek Medical Llc (United States)...............................43
Dentsply Sirona (United States).......................................44
Depuy Synthes, Inc. (United States).................................45
Doxa Ab (Sweden)...........................................................45
Exxelia Temex (France)....................................................46
Ferro-Ceramic Grinding, Inc. (United States)...................46
Friatec Aktiengesellschaft (Germany) .............................47
Institut Straumann Ag (Switzerland) ...............................47
International Ceramic Engineering (United States) .........48
Ivoclar Vivadent Ag (Liechtenstein).................................49
Johanson Dielectrics, Inc. (United States) .......................50
Kemet Corporation (United States).................................52
Kuraray Co., Ltd. (Japan) .................................................53
Kyocera Corporation (Japan)...........................................54
Lucideon Limited (United Kingdom)................................56
Metoxit Ag (Switzerland) ................................................57
Micro Ceramics Limited (Israel).......................................57
Morgan Advanced Materials Plc (United Kingdom).........58
Murata Manufacturing Company, Ltd. (Japan)................59
Ngk Spark Plug Co., Ltd. (Japan)......................................60
Noritake Co., Limited (Japan)..........................................61
Physik Instrumente (Pi) GmbH & Co., Kg. (Germany) ......63
Piezo Kinetics, Inc. (United States)..................................64
Precision Ferrites & Ceramics (United States).................65
Refractron Technologies Corporation (United States).....66
Saint-Gobain Ceramics & Plastics, Inc. (United States)....66
Sct Société Des Céramiques Techniques (France) ...........67
Skyortho Dental Supplies Medical Co., Ltd. (China).........67
Small Precision Tools, Inc. (United States) ......................68
Stryker Corporation (United States)................................68
Superior Technical Ceramics Corporation (United States).. 69
T.Q. Abrasive Machining Company (United States).........70
Trs Technologies, Inc. (United States) .............................70
Vishay Intertechnology, Inc. (United States) ...................71
Vita Zahnfabrik H. Rauter GmbH & Co., Kg (Germany)....71
Zimmer Biomet Holdings, Inc. (United States) ................72
5. KEY BUSINESS TRENDS ......................................73
CoorsTek Medical Wins Ceramic Hip Implant Lawsuit in US..73
Collagen Solutions Plc receives Medical Research Scotland
PhD Studentship project .................................................73
3DCeram Unveils Ceramaker 100, a 3D ceramic printing
system ............................................................................74
Amedica Reveals positive findings data Re-files FDA
Submission......................................................................74
Kyocera Medical Bags FDA 510(k) clearance for Initia Total
Hip System......................................................................74
AVX Corporation Introduces MM Series multilayer ceramic
capacitors .......................................................................75
Straumann and Maxon Motor Enter in to Partnership....75
3M Company grants Dental Ceramics Coloring Technology
License to Dental Direkt GmbH.......................................75
CoorsTek Establishes New center in Colorado ................76
Murata develops new monolithic ceramic capacitors for
implanted medical devices..............................................76
CoorsTek Medical strengthens its Medical-Grade ceramic
production capacity .......................................................76
CoorsTek to Acquire Covalent.........................................77
Zimmer Launches Vivacit-E® Vitamin E highly crosslinked
polyethylene (HXPE) hip replacement solution...............77
6. GLOBAL MARKET OVERVIEW.............................78
Chart 9: Global Medical Ceramics Market Analysis (2014-
2022) in USD Million .......................................................78
6.1 Global Medical Ceramics Market Overview by
Ceramic Type........................................................... 79
Chart 10: Global Medical Ceramics Market Analysis (2014-
2022) by Ceramic Type – Bioactive Ceramics, Bioinert
Ceramics and Bioresorbable Ceramics in USD Million.....79
Chart 11: Glance at 2014, 2017 and 2022 Global Medical
Ceramics Market Share (%) by Ceramic Type – Bioactive
Ceramics, Bioinert Ceramics and Bioresorbable Ceramics . 80
6.1.1 Medical Ceramic Types Market Overview by
Global Region .......................................................... 81
6.1.1.1 Bioactive Ceramics....................................... 81
Chart 12: Global Bioactive Ceramics Market Analysis (2014-
2022) by Geographic Region – North America, Europe, Asia-
Pacific, Latin America and Rest of World in USD Million .... 81
Chart13:Glanceat2014,2017and2022GlobalBioactive
CeramicsMarketShare(%)byGeographicRegion–North
America,Europe,Asia-Pacific,LatinAmericaandRestofWorld82
6.1.1.2 Bioinert Ceramics......................................... 83
Chart 14: Global Bioinert Ceramics Market Analysis (2014-
2022) by Geographic Region – North America, Europe, Asia-
Pacific, Latin America and Rest of World in USD Million .... 83
Chart 15: Glance at 2014, 2017 and 2022 Global Bioinert
Ceramics Market Share (%) by Geographic Region – North
America, Europe, Asia-Pacific, Latin America and Rest of
World ............................................................................. 84
6.1.1.3 Bioresorbable Ceramics ............................... 85
Chart 16: Global Bioresorbable Ceramics Market Analysis
(2014-2022) by Geographic Region – North America,
Europe, Asia-Pacific, Latin America and Rest of World in
USD Million..................................................................... 85
Chart 17: Glance at 2014, 2017 and 2022 Global
Bioresorbable Ceramics Market Share (%) by Geographic
Region – North America, Europe, Asia-Pacific, Latin
America and Rest of World............................................. 86
6.2 Global Medical Ceramics Market Overview by
Application .............................................................. 87
Chart 18: Global Medical Ceramics Market Analysis (2014-
2022) by Application – Dental Implants, Implantable Electronic
Devices, Orthopedic Implants, Surgical & Diagnostic
Instruments and Other Applications in USD Million...............87
Chart 19: Glance at 2014, 2017 and 2022 Global Medical
Ceramics Market Share (%) by Application – Dental Implants,
Implantable Electronic Devices, Orthopedic Implants, Surgical
& Diagnostic Instruments and Other Applications .................88
6.2.1 Medical Ceramics Applications Market Overview
by Global Region...................................................... 89
6.2.1.1 Dental Implants ........................................... 89
Chart 20: Global Medical Ceramics Market Analysis (2014-
2022) in Dental Implants by Geographic Region – North
America, Europe, Asia-Pacific, Latin America and Rest of
World in USD Million...................................................... 89
Chart 21: Glance at 2014, 2017 and 2022 Global Medical
Ceramics Market Share (%) in Dental Implants by
Geographic Region – North America, Europe, Asia-Pacific,
Latin America and Rest of World.................................... 90
6.2.1.2 Implantable Electronic Devices.................... 91
Chart 22: Global Medical Ceramics Market Analysis (2014-
2022) in Implantable Electronic Devices by Geographic
Region – North America, Europe, Asia-Pacific, Latin
America and Rest of World in USD Million ..................... 91
Chart 23: Glance at 2014, 2017 and 2022 Global Medical
Ceramics Market Share (%) in Implantable Electronic
Devices by Geographic Region – North America, Europe,
Asia-Pacific, Latin America and Rest of World ................ 92
6.2.1.3 Orthopedic Implants.................................... 93
Chart 24: Global Medical Ceramics Market Analysis (2014-
2022) in Orthopedic Implants by Geographic Region –
North America, Europe, Asia-Pacific, Latin America and
Rest of World in USD Million .......................................... 93
Chart 25: Glance at 2014, 2017 and 2022 Global Medical
Ceramics Market Share (%) in Orthopedic Implants by
Geographic Region – North America, Europe, Asia-Pacific,
Latin America and Rest of World.................................... 94
6.2.1.4 Surgical & Diagnostic Instruments ............... 95
Chart 26: Global Medical Ceramics Market Analysis (2014-
2022) in Surgical & Diagnostic Instruments by Geographic
Region – North America, Europe, Asia-Pacific, Latin
America and Rest of World in USD Million ..................... 95
Chart 27: Glance at 2014, 2017 and 2022 Global Medical
Ceramics Market Share (%) in Surgical & Diagnostic
Instruments by Geographic Region – North America,
Europe, Asia-Pacific, Latin America and Rest of World ... 96
6.2.1.5 Other Applications....................................... 97
Chart 28: Global Medical Ceramics Market Analysis (2014-
2022) in Other Applications by Geographic Region – North
America, Europe, Asia-Pacific, Latin America and Rest of
World in USD Million...................................................... 97
Chart 29: Glance at 2014, 2017 and 2022 Global Medical
Ceramics Market Share (%) in Other Applications by
Geographic Region – North America, Europe, Asia-Pacific,
Latin America and Rest of World.................................... 98
Page 4
Medical Ceramics – A Global Market Overview
February 2017 |312 Pages | 193 Charts | Price $4050
Click here to buy the report
PART B: REGIONAL MARKET PERSPECTIVE... 99
Chart 30: Fastest Growing Major Markets for Medical
Ceramics (2017-2022) in %CAGRs....................................99
Chart 31: Global Medical Ceramics Market Analysis (2014-
2022) by Geographic Region – North America, Europe, Asia-
Pacific, Latin America and Rest of World in USD Million .. 100
Chart 32: Glance at 2014, 2017 and 2022 Global Medical
Ceramics Market Share (%) by Geographic Region – North
America, Europe, Asia-Pacific, Latin America and Rest of
World ............................................................................100
REGIONAL MARKET OVERVIEW...........................101
1. NORTH AMERICA ............................................101
Chart 33: North American Medical Ceramics Market
Analysis (2014-2022) in USD Million..............................101
1.1 North American Medical Ceramics Market
Overview by Geographic Region............................ 102
Chart 34: North American Medical Ceramics Market
Analysis (2014-2022) by Geographic Region – United
States and Canada in USD Million..................................102
Chart 35: Glance at 2014, 2017 and 2022 North American
Medical Ceramics Market Share (%) by Geographic Region
– United States and Canada ..........................................103
1.2 North American Medical Ceramics Market
Overview by Ceramic Type .................................... 104
Chart 36: North American Medical Ceramics Market Analysis
(2014-2022) by Ceramic Type – Bioactive Ceramics, Bioinert
Ceramics and Bioresorbable Ceramics in USD Million...... 104
Chart 37: Glance at 2014, 2017 and 2022 North American
Medical Ceramics Market Share (%) by Ceramic Type –
Bioactive Ceramics, Bioinert Ceramics and Bioresorbable
Ceramics........................................................................105
1.2.1 Medical Ceramic Types Market Overview by
North American Region ......................................... 106
1.2.1.1 Bioactive Ceramics..................................... 106
Chart 38: North American Bioactive Ceramics Market
Analysis (2014-2022) by Geographic Region – United
States and Canada in USD Million..................................106
Chart 39: Glance at 2014, 2017 and 2022 North American
Bioactive Ceramics Market Share (%) by Geographic
Region – United States and Canada...............................107
1.2.1.2 Bioinert Ceramics....................................... 108
Chart 40: North American Bioinert Ceramics Market
Analysis (2014-2022) by Geographic Region – United
States and Canada in USD Million..................................108
Chart 41: Glance at 2014, 2017 and 2022 North American
Bioinert Ceramics Market Share (%) by Geographic Region
– United States and Canada ..........................................109
1.2.1.3 Bioresorbable Ceramics ............................. 110
Chart 42: North American Bioresorbable Ceramics Market
Analysis (2014-2022) by Geographic Region – United
States and Canada in USD Million..................................110
Chart 43: Glance at 2014, 2017 and 2022 North American
Bioresorbable Ceramics Market Share (%) by Geographic
Region – United States and Canada...............................111
1.3 North American Medical Ceramics Market
Overview by Application........................................ 112
Chart 44: North American Medical Ceramics Market
Analysis (2014-2022) by Application – Dental Implants,
Implantable Electronic Devices, Orthopedic Implants,
Surgical & Diagnostic Instruments and Other Applications
in USD Million................................................................112
Chart 45: Glance at 2014, 2017 and 2022 North American
Medical Ceramics Market Share (%) by Application –
Dental Implants, Implantable Electronic Devices,
Orthopedic Implants, Surgical & Diagnostic Instruments
and Other Applications..................................................113
1.3.1 Medical Ceramics Applications Market Overview
by North American Region..................................... 114
1.3.1.1 Dental Implants.......................................... 114
Chart 46: North American Medical Ceramics Market
Analysis (2014-2022) in Dental Implants by Geographic
Region – United States and Canada in USD Million .......114
Chart 47: Glance at 2014, 2017 and 2022 North American
Medical Ceramics Market Share (%) in Dental Implants by
Geographic Region – United States and Canada............115
1.3.1.2 Implantable Electronic Devices.................. 116
Chart 48: North American Medical Ceramics Market Analysis
(2014-2022) in Implantable Electronic Devices by Geographic
Region – United States and Canada in USD Million..............116
Chart 49: Glance at 2014, 2017 and 2022 North American
Medical Ceramics Market Share (%) in Dental Implants by
Geographic Region – United States and Canada ...........117
1.3.1.3 Orthopedic Implants.................................. 118
Chart 50: North American Medical Ceramics Market Analysis
(2014-2022) in Orthopedic Implants by Geographic Region –
United States and Canada in USD Million ......................... 118
Chart 51: Glance at 2014, 2017 and 2022 North American
Medical Ceramics Market Share (%) in Orthopedic Implants
by Geographic Region – United States and Canada.......... 119
1.3.1.4 Surgical & Diagnostic Instruments ............. 120
Chart 52: North American Medical Ceramics Market
Analysis (2014-2022) in Surgical & Diagnostic Instruments
by Geographic Region – United States and Canada in USD
Million........................................................................... 120
Chart 53: Glance at 2014, 2017 and 2022 North American
Medical Ceramics Market Share (%) in Surgical & Diagnostic
Instruments by Geographic Region – United States and
Canada ............................................................................... 121
1.3.1.5 Other Applications..................................... 122
Chart 54: North American Medical Ceramics Market
Analysis (2014-2022) in Other Applications by Geographic
Region – United States and Canada in USD Million.......122
Chart 55: Glance at 2014, 2017 and 2022 North American
Medical Ceramics Market Share (%) in Other Applications
by Geographic Region – United States and Canada.......123
1.4 Major Market Players ...................................... 124
Advanced Industrial Ceramics (United States) ..............124
Apc International, Ltd. (United States)..........................125
Avx Corporation (United States) ...................................126
Berkeley Advanced Biomaterials, Inc. (United States)...127
Coorstek, Inc. (United States)........................................128
Coorstek Medical Llc (United States) ............................129
Dentsply Sirona (United States) ....................................130
Depuy Synthes, Inc. (United States) ..............................131
Ferro-Ceramic Grinding, Inc. (United States).................132
International Ceramic Engineering (United States) .......132
Johanson Dielectrics, Inc. (United States) .....................133
Advanced Monolythic Ceramics, Inc. (United States)....134
Kemet Corporation (United States)...............................135
Piezo Kinetics, Inc. (United States)................................135
Precision Ferrites & Ceramics (United States)...............136
Refractron Technologies Corporation (United States)...136
Saint-Gobain Ceramics & Plastics, Inc. (United States)..137
Small Precision Tools, Inc. (United States) ....................137
Stryker Corporation (United States)..............................138
Superior Technical Ceramics Corporation (United States)....139
T.Q. Abrasive Machining Company (United States).......140
TRS Technologies, Inc. (United States) ..........................140
Vishay Intertechnology, Inc. (United States) .................141
Zimmer Biomet Holdings, Inc. (United States) ..............141
1.5 Country-wise Analysis of North American Medical
Ceramics Market.................................................... 142
1.5.1 The United States.......................................142
1.5.1.1 United States Medical Ceramics Market
Overview by Ceramic Type .................................... 142
Chart 56: United States Medical Ceramics Market Analysis
(2014-2022) by Ceramic Type – Bioactive Ceramics, Bioinert
Ceramics and Bioresorbable Ceramics in USD Million...... 142
Chart 57: Glance at 2014, 2017 and 2022 United States Medical
Ceramics Market Share (%) by Ceramic Type – Bioactive
Ceramics, Bioinert Ceramics and Bioresorbable Ceramics........143
1.5.1.2 United States Medical Ceramics Market
Overview by Application........................................ 144
Chart 58: United States Medical Ceramics Market Analysis
(2014-2022) by Application – Dental Implants, Implantable
Electronic Devices, Orthopedic Implants, Surgical & Diagnostic
Instruments and Other Applications in USD Million .............144
Chart 59: Glance at 2014, 2017 and 2022 United States
Medical Ceramics Market Share (%) by Application –
Dental Implants, Implantable Electronic Devices,
Orthopedic Implants, Surgical & Diagnostic Instruments
and Other Applications .................................................145
1.5.2 Canada.......................................................146
1.5.2.1 Canadian Medical Ceramics Market Overview
by Ceramic Type .................................................... 146
Chart 60: Canadian Medical Ceramics Market Analysis (2014-
2022) by Ceramic Type – Bioactive Ceramics, Bioinert
Ceramics and Bioresorbable Ceramics in USD Million...... 146
Chart 61: Glance at 2014, 2017 and 2022 Canadian Medical
Ceramics Market Share (%) by Ceramic Type – Bioactive
Ceramics, Bioinert Ceramics and Bioresorbable Ceramics ... 147
1.5.2.2 Canadian Medical Ceramics Market Overview
by Application........................................................ 148
Chart 62: Canadian Medical Ceramics Market Analysis (2014-
2022) by Application – Dental Implants, Implantable Electronic
Devices, Orthopedic Implants, Surgical & Diagnostic
Instruments and Other Applications in USD Million ............. 148
Chart 63: Glance at 2014, 2017 and 2022 Canadian
Medical Ceramics Market Share (%) by Application –
Dental Implants, Implantable Electronic Devices,
Orthopedic Implants, Surgical & Diagnostic Instruments
and Other Applications................................................. 149
2. EUROPE ..........................................................150
Chart 64: European Medical Ceramics Market Analysis
(2014-2022) in USD Million........................................... 150
2.1 European Medical Ceramics Market Overview by
Geographic Region ................................................ 151
Chart 65: European Medical Ceramics Market Analysis
(2014-2022) by Geographic Region – France, Germany, Italy,
United Kingdom and Rest of Europe in USD Million......... 151
Chart 66: Glance at 2014, 2017 and 2022 European Medical
Ceramics Market Share (%) by Geographic Region – France,
Germany, Italy, United Kingdom and Rest of Europe ....... 152
2.2 European Medical Ceramics Market Overview by
Ceramic Type......................................................... 153
Chart 67: European Medical Ceramics Market Analysis
(2014-2022) by Ceramic Type – Bioactive Ceramics, Bioinert
Ceramics and Bioresorbable Ceramics in USD Million...... 153
Chart 68: Glance at 2014, 2017 and 2022 European
Medical Ceramics Market Share (%) by Ceramic Type –
Bioactive Ceramics, Bioinert Ceramics and Bioresorbable
Ceramics....................................................................... 154
2.2.1 Medical Ceramic Types Market Overview by
European Region ................................................... 155
2.2.1.1 Bioactive Ceramics..................................... 155
Chart 69: European Bioactive Ceramics Market Analysis
(2014-2022) by Geographic Region – France, Germany, Italy,
United Kingdom and Rest of Europe in USD Million......... 155
Chart 70: Glance at 2014, 2017 and 2022 European Bioactive
Ceramics Market Share (%) by Geographic Region – France,
Germany, Italy, United Kingdom and Rest of Europe ....... 156
2.2.1.2 Bioinert Ceramics....................................... 157
Chart 71: European Bioinert Ceramics Market Analysis
(2014-2022) by Geographic Region – France, Germany, Italy,
United Kingdom and Rest of Europe in USD Million......... 157
Chart 72: Glance at 2014, 2017 and 2022 European Bioinert
Ceramics Market Share (%) by Geographic Region – France,
Germany, Italy, United Kingdom and Rest of Europe ....... 158
2.2.1.3 Bioresorbable Ceramics ............................. 159
Chart 73: European Bioresorbable Ceramics Market
Analysis (2014-2022) by Geographic Region – France,
Germany, Italy, United Kingdom and Rest of Europe in
USD Million................................................................... 159
Chart 74: Glance at 2014, 2017 and 2022 European
Bioresorbable Ceramics Market Share (%) by Geographic
Region – France, Germany, Italy, United Kingdom and Rest
of Europe...................................................................... 160
2.3 European Medical Ceramics Market Overview by
Application ............................................................ 161
Chart 75: European Medical Ceramics Market Analysis (2014-
2022) by Application – Dental Implants, Implantable Electronic
Devices, Orthopedic Implants, Surgical & Diagnostic
Instruments and Other Applications in USD Million ............. 161
Chart 76: Glance at 2014, 2017 and 2022 European
Medical Ceramics Market Share (%) by Application –
Dental Implants, Implantable Electronic Devices,
Orthopedic Implants, Surgical & Diagnostic Instruments
and Other Applications................................................. 162
Page 5
Medical Ceramics – A Global Market Overview
February 2017 |312 Pages | 193 Charts | Price $4050
Click here to buy the report
2.3.1 Medical Ceramics Applications Market Overview
by European Region............................................... 163
2.3.1.1 Dental Implants.......................................... 163
Chart 77: European Medical Ceramics Market Analysis
(2014-2022) in Dental Implants by Geographic Region –
France, Germany, Italy, United Kingdom and Rest of
Europe in USD Million ...................................................163
Chart 78: Glance at 2014, 2017 and 2022 European
Medical Ceramics Market Share (%) in Dental Implants by
Geographic Region – France, Germany, Italy, United
Kingdom and Rest of Europe .........................................164
2.3.1.2 Implantable Electronic Devices.................. 165
Chart 79: European Medical Ceramics Market Analysis
(2014-2022) in Implantable Electronic Devices by
Geographic Region – France, Germany, Italy, United
Kingdom and Rest of Europe in USD Million..................165
Chart 80: Glance at 2014, 2017 and 2022 European
Medical Ceramics Market Share (%) in Implantable
Electronic Devices by Geographic Region – France,
Germany, Italy, United Kingdom and Rest of Europe.....166
2.3.1.3 Orthopedic Implants.................................. 167
Chart 81: European Medical Ceramics Market Analysis
(2014-2022) in Orthopedic Implants by Geographic Region
– France, Germany, Italy, United Kingdom and Rest of
Europe in USD Million ...................................................167
Chart 82: Glance at 2014, 2017 and 2022 European
Medical Ceramics Market Share (%) in Orthopedic
Implants by Geographic Region – France, Germany, Italy,
United Kingdom and Rest of Europe..............................168
2.3.1.4 Surgical & Diagnostic Instruments ............. 169
Chart 83: European Medical Ceramics Market Analysis
(2014-2022) in Surgical & Diagnostic Instruments by
Geographic Region – France, Germany, Italy, United
Kingdom and Rest of Europe in USD Million..................169
Chart 84: Glance at 2014, 2017 and 2022 European
Medical Ceramics Market Share (%) in Surgical &
Diagnostic Instruments by Geographic Region – France,
Germany, Italy, United Kingdom and Rest of Europe.....170
2.3.1.5 Other Applications..................................... 171
Chart 85: European Medical Ceramics Market Analysis
(2014-2022) in Other Applications by Geographic Region –
France, Germany, Italy, United Kingdom and Rest of
Europe in USD Million ...................................................171
Chart 86: Glance at 2014, 2017 and 2022 European
Medical Ceramics Market Share (%) in Other Applications
by Geographic Region – France, Germany, Italy, United
Kingdom and Rest of Europe .........................................172
2.4 Major Market Players ...................................... 173
Barat Ceramics GmbH (Germany)..................................173
Bce Special Ceramics GmbH (Germany) ........................174
Ceramtec GmbH (Germany) .........................................175
Ceraroot S.L (Spain).......................................................176
Coorstek Advanced Materials Crewe Limited (UK) ........176
Dental Direkt GmbH (Germany) ....................................177
Doxa Ab (Sweden).........................................................177
Exxelia Temex (France)..................................................178
Friatec Aktiengesellschaft (Germany)............................178
Hybrid Laser Tech Ltd (United Kingdom) .......................179
Innovnano - Materiais Avançados, S.A (Portugal)..........179
Institut Straumann Ag (Switzerland)..............................180
Ivoclar Vivadent Ag (Liechtenstein) ...............................181
Jri Orthopaedics (United Kingdom)................................182
Lucideon Limited (United Kingdom) ..............................183
Metoxit Ag (Switzerland)...............................................184
Moje Keramik-Implantate GmbH & Co., Kg. (Germany).185
Morgan Advanced Materials Plc (United Kingdom).......186
Morgan Technical Ceramics (United Kingdom)..............187
Morgan Electro Ceramics Ltd (United Kingdom)............187
Nobel Biocare Services Ag (Switzerland)........................188
Physik Instrumente (Pi) GmbH & Co., Kg. (Germany).....188
Sct Société Des Céramiques Techniques (France)..........189
Sembach GmbH & Co., Kg (Germnay)............................189
Vita Zahnfabrik H. Rauter GmbH & Co., Kg (Germany) ..190
2.5 Country-wise Analysis of European Medical
Ceramics Market.................................................... 191
2.5.1 France........................................................191
2.5.1.1 French Medical Ceramics Market Overview by
Ceramic Type......................................................... 191
Chart 87: French Medical Ceramics Market Analysis (2014-
2022) by Ceramic Type – Bioactive Ceramics, Bioinert
Ceramics and Bioresorbable Ceramics in USD Million...191
Chart 88: Glance at 2014, 2017 and 2022 French Medical
Ceramics Market Share (%) by Ceramic Type – Bioactive
Ceramics, Bioinert Ceramics and Bioresorbable Ceramics...192
2.5.1.2 French Medical Ceramics Market Overview by
Application............................................................. 193
Chart 89: French Medical Ceramics Market Analysis (2014-
2022) by Application – Dental Implants, Implantable Electronic
Devices, Orthopedic Implants, Surgical & Diagnostic
Instruments and Other Applications in USD Million .............193
Chart 90: Glance at 2014, 2017 and 2022 French Medical
Ceramics Market Share (%) by Application – Dental
Implants, Implantable Electronic Devices, Orthopedic
Implants, Surgical & Diagnostic Instruments and Other
Applications .................................................................. 194
2.5.2 Germany....................................................195
2.5.2.1 German Medical Ceramics Market Overview
by Ceramic Type .................................................... 195
Chart 91: German Medical Ceramics Market Analysis (2014-
2022) by Ceramic Type – Bioactive Ceramics, Bioinert
Ceramics and Bioresorbable Ceramics in USD Million...... 195
Chart 92: Glance at 2014, 2017 and 2022 German Medical
Ceramics Market Share (%) by Ceramic Type – Bioactive
Ceramics, Bioinert Ceramics and Bioresorbable Ceramics...196
2.5.2.2 German Medical Ceramics Market Overview
by Application........................................................ 197
Chart 93: German Medical Ceramics Market Analysis
(2014-2022) by Application – Dental Implants, Implantable
Electronic Devices, Orthopedic Implants, Surgical &
Diagnostic Instruments and Other Applications in USD
Million........................................................................... 197
Chart 94: Glance at 2014, 2017 and 2022 German Medical
Ceramics Market Share (%) by Application – Dental
Implants, Implantable Electronic Devices, Orthopedic
Implants, Surgical & Diagnostic Instruments and Other
Applications .................................................................. 198
2.5.3 Italy ...........................................................199
2.5.3.1 Italian Medical Ceramics Market Overview by
Ceramic Type......................................................... 199
Chart 95: Italian Medical Ceramics Market Analysis (2014-
2022) by Ceramic Type – Bioactive Ceramics, Bioinert
Ceramics and Bioresorbable Ceramics in USD Million...199
Chart 96: Glance at 2014, 2017 and 2022 Italian Medical
Ceramics Market Share (%) by Ceramic Type – Bioactive
Ceramics, Bioinert Ceramics and Bioresorbable Ceramics...200
2.5.3.2 Italian Medical Ceramics Market Overview by
Application............................................................. 201
Chart 97: Italian Medical Ceramics Market Analysis (2014-
2022) by Application – Dental Implants, Implantable Electronic
Devices, Orthopedic Implants, Surgical & Diagnostic
Instruments and Other Applications in USD Million .............201
Chart 98: Glance at 2014, 2017 and 2022 Italian Medical
Ceramics Market Share (%) by Application – Dental
Implants, Implantable Electronic Devices, Orthopedic
Implants, Surgical & Diagnostic Instruments and Other
Applications .................................................................. 202
2.5.4 The United Kingdom...................................203
2.5.4.1 United Kingdom Medical Ceramics Market
Overview by Ceramic Type .................................... 203
Chart 99: United Kingdom Medical Ceramics Market
Analysis (2014-2022) by Ceramic Type – Bioactive
Ceramics, Bioinert Ceramics and Bioresorbable Ceramics
in USD Million ...............................................................203
Chart 100: Glance at 2014, 2017 and 2022 United Kingdom
Medical Ceramics Market Share (%) by Ceramic Type –
Bioactive Ceramics, Bioinert Ceramics and Bioresorbable
Ceramics ....................................................................... 204
2.5.4.2 United Kingdom Medical Ceramics Market
Overview by Application........................................ 205
Chart 101: United Kingdom Medical Ceramics Market
Analysis (2014-2022) by Application – Dental Implants,
Implantable Electronic Devices, Orthopedic Implants,
Surgical & Diagnostic Instruments and Other Applications
in USD Million ...............................................................205
Chart 102: Glance at 2014, 2017 and 2022 United Kingdom
Medical Ceramics Market Share (%) by Application –
Dental Implants, Implantable Electronic Devices,
Orthopedic Implants, Surgical & Diagnostic Instruments
and Other Applications................................................. 206
2.5.5 Rest of Europe............................................207
2.5.5.1 Rest of Europe Medical Ceramics Market
Overview by Ceramic Type .................................... 207
Chart 103: Rest of Europe Medical Ceramics Market Analysis
(2014-2022) by Ceramic Type – Bioactive Ceramics, Bioinert
Ceramics and Bioresorbable Ceramics in USD Million .......... 207
Chart 104: Glance at 2014, 2017 and 2022 Rest of Europe
Medical Ceramics Market Share (%) by Ceramic Type –
Bioactive Ceramics, Bioinert Ceramics and Bioresorbable
Ceramics................................................................................. 208
2.5.5.2 Rest of Europe Medical Ceramics Market
Overview by Application........................................ 209
Chart 105: Rest of Europe Medical Ceramics Market Analysis
(2014-2022) by Application – Dental Implants, Implantable
Electronic Devices, Orthopedic Implants, Surgical & Diagnostic
Instruments and Other Applications in USD Million ............. 209
Chart 106: Glance at 2014, 2017 and 2022 Rest of Europe
Medical Ceramics Market Share (%) by Application – Dental
Implants, Implantable Electronic Devices, Orthopedic Implants,
Surgical & Diagnostic Instruments and Other Applications .. 210
3. ASIA-PACIFIC...................................................211
Chart 107: Asia-Pacific Medical Ceramics Market Analysis
(2014-2022) in USD Million........................................... 211
3.1 Asia-Pacific Medical Ceramics Market Overview
by Geographic Region............................................ 212
Chart 108: Asia-Pacific Medical Ceramics Market Analysis
(2014-2022) by Geographic Region – China, India, Japan,
South Korea and Rest of Asia-Pacific in USD Million..... 212
Chart 109: Glance at 2014, 2017 and 2022 Asia-Pacific Medical
Ceramics Market Share (%) by Geographic Region – China,
India, Japan, South Korea and Rest of Asia-Pacific................213
3.2 Asia-Pacific Medical Ceramics Market Overview
by Ceramic Type .................................................... 214
Chart 110: Asia-Pacific Medical Ceramics Market Analysis
(2014-2022) by Ceramic Type – Bioactive Ceramics, Bioinert
Ceramics and Bioresorbable Ceramics in USD Million...... 214
Chart 111: Glance at 2014, 2017 and 2022 Asia-Pacific Medical
Ceramics Market Share (%) by Ceramic Type – Bioactive
Ceramics, Bioinert Ceramics and Bioresorbable Ceramics ... 215
3.2.1 Medical Ceramic Types Market Overview by
Asia-Pacific Region................................................. 216
3.2.1.1 Bioactive Ceramics..................................... 216
Chart 112: Asia-Pacific Bioactive Ceramics Market Analysis
(2014-2022) by Geographic Region – China, India, Japan,
South Korea and Rest of Asia-Pacific in USD Million..... 216
Chart 113: Glance at 2014, 2017 and 2022 Asia-Pacific
Bioactive Ceramics Market Share (%) by Geographic Region –
China, India, Japan, South Korea and Rest of Asia-Pacific..... 217
3.2.1.2 Bioinert Ceramics....................................... 218
Chart 114: Asia-Pacific Bioinert Ceramics Market Analysis
(2014-2022) by Geographic Region – China, India, Japan,
South Korea and Rest of Asia-Pacific in USD Million..... 218
Chart 115: Glance at 2014, 2017 and 2022 Asia-Pacific Bioinert
Ceramics Market Share (%) by Geographic Region – China,
India, Japan, South Korea and Rest of Asia-Pacific................219
3.2.1.3 Bioresorbable Ceramics ............................. 220
Chart 116: Asia-Pacific Bioresorbable Ceramics Market Analysis
(2014-2022) by Geographic Region – China, India, Japan, South
Korea and Rest of Asia-Pacific in USD Million .......................220
Chart117:Glanceat2014,2017and2022Asia-Pacific
BioresorbableCeramicsMarketShare(%)byGeographicRegion
–China,India,Japan,SouthKoreaandRestofAsia-Pacific.......221
3.3 Asia-Pacific Medical Ceramics Market Overview
by Application........................................................ 222
Chart 118: Asia-Pacific Medical Ceramics Market Analysis
(2014-2022) by Application – Dental Implants, Implantable
Electronic Devices, Orthopedic Implants, Surgical & Diagnostic
Instruments and Other Applications in USD Million.............222
Chart 119: Glance at 2014, 2017 and 2022 Asia-Pacific Medical
Ceramics Market Share (%) by Application – Dental Implants,
Implantable Electronic Devices, Orthopedic Implants, Surgical
& Diagnostic Instruments and Other Applications................ 223
Page 6
Medical Ceramics – A Global Market Overview
February 2017 |312 Pages | 193 Charts | Price $4050
Click here to buy the report
3.3.1 Medical Ceramics Applications Market Overview
by Asia-Pacific Region............................................ 224
3.3.1.1 Dental Implants.......................................... 224
Chart 120: Asia-Pacific Medical Ceramics Market Analysis (2014-
2022) in Dental Implants by Geographic Region – China, India,
Japan, South Korea and Rest of Asia-Pacific in USD Million.......224
Chart 121: Glance at 2014, 2017 and 2022 Asia-Pacific
Medical Ceramics Market Share (%) in Dental Implants by
Geographic Region – China, India, Japan, South Korea and
Rest of Asia-Pacific ........................................................225
3.3.1.2 Implantable Electronic Devices.................. 226
Chart 122: Asia-Pacific Medical Ceramics Market Analysis
(2014-2022) in Implantable Electronic Devices by
Geographic Region – China, India, Japan, South Korea and
Rest of Asia-Pacific in USD Million.................................226
Chart 123: Glance at 2014, 2017 and 2022 Asia-Pacific
Medical Ceramics Market Share (%) in Implantable
Electronic Devices by Geographic Region – China, India,
Japan, South Korea and Rest of Asia-Pacific ..................227
3.3.1.3 Orthopedic Implants.................................. 228
Chart 124: Asia-Pacific Medical Ceramics Market Analysis
(2014-2022) in Orthopedic Implants by Geographic Region
– China, India, Japan, South Korea and Rest of Asia-Pacific
in USD Million................................................................228
Chart 125: Glance at 2014, 2017 and 2022 Asia-Pacific
Medical Ceramics Market Share (%) in Orthopedic
Implants by Geographic Region – China, India, Japan,
South Korea and Rest of Asia-Pacific .............................229
3.3.1.4 Surgical & Diagnostic Instruments ............. 230
Chart 126: Asia-Pacific Medical Ceramics Market Analysis
(2014-2022) in Surgical & Diagnostic Instruments by
Geographic Region – China, India, Japan, South Korea and
Rest of Asia-Pacific in USD Million.................................230
Chart 127: Glance at 2014, 2017 and 2022 Asia-Pacific
Medical Ceramics Market Share (%) in Surgical &
Diagnostic Instruments by Geographic Region – China,
India, Japan, South Korea and Rest of Asia-Pacific.........231
3.3.1.5 Other Applications..................................... 232
Chart 128: Asia-Pacific Medical Ceramics Market Analysis
(2014-2022) in Other Applications by Geographic Region –
China, India, Japan, South Korea and Rest of Asia-Pacific in
USD Million ...................................................................232
Chart 129: Glance at 2014, 2017 and 2022 Asia-Pacific
Medical Ceramics Market Share (%) in Other Applications
by Geographic Region – China, India, Japan, South Korea
and Rest of Asia-Pacific .................................................233
3.4 Major Market Players ...................................... 234
Coorstek Kk (Japan).......................................................234
Kuraray Co., Ltd. (Japan)................................................234
Kyocera Corporation (Japan) .........................................235
Kyocera Medical Corporation (Japan)............................237
Murata Manufacturing Company, Ltd. (Japan)..............238
Ngk Spark Plug Co., Ltd. (Japan) ....................................238
Noritake Co., Limited (Japan) ........................................239
Skyortho Dental Supplies Medical Co., Ltd. (China) .......241
3.5 Country-wise Analysis of Asia-Pacific Medical
Ceramics Market.................................................... 242
3.5.1 China .........................................................242
3.5.1.1 Chinese Medical Ceramics Market Overview
by Ceramic Type .................................................... 242
Chart 130: Chinese Medical Ceramics Market Analysis (2014-
2022) by Ceramic Type – Bioactive Ceramics, Bioinert
Ceramics and Bioresorbable Ceramics in USD Million...... 242
Chart 131: Glance at 2014, 2017 and 2022 Chinese Medical
Ceramics Market Share (%) by Ceramic Type – Bioactive
Ceramics, Bioinert Ceramics and Bioresorbable Ceramics ...243
3.5.1.2 Chinese Medical Ceramics Market Overview
by Application........................................................ 244
Chart 132: Chinese Medical Ceramics Market Analysis (2014-
2022) by Application – Dental Implants, Implantable Electronic
Devices, Orthopedic Implants, Surgical & Diagnostic
Instruments and Other Applications in USD Million.............244
Chart 133: Glance at 2014, 2017 and 2022 Chinese
Medical Ceramics Market Share (%) by Application –
Dental Implants, Implantable Electronic Devices,
Orthopedic Implants, Surgical & Diagnostic Instruments
and Other Applications..................................................245
3.5.2 India ..........................................................246
3.5.2.1 Indian Medical Ceramics Market Overview by
Ceramic Type......................................................... 246
Chart 134: Indian Medical Ceramics Market Analysis
(2014-2022) by Ceramic Type – Bioactive Ceramics,
Bioinert Ceramics and Bioresorbable Ceramics in USD
Million........................................................................... 246
Chart 135: Glance at 2014, 2017 and 2022 Indian Medical
Ceramics Market Share (%) by Ceramic Type – Bioactive
Ceramics, Bioinert Ceramics and Bioresorbable Ceramics...247
3.5.2.2 Indian Medical Ceramics Market Overview by
Application............................................................. 248
Chart 136: Indian Medical Ceramics Market Analysis
(2014-2022) by Application – Dental Implants, Implantable
Electronic Devices, Orthopedic Implants, Surgical &
Diagnostic Instruments and Other Applications in USD
Million........................................................................... 248
Chart 137: Glance at 2014, 2017 and 2022 Indian Medical
Ceramics Market Share (%) by Application – Dental
Implants, Implantable Electronic Devices, Orthopedic
Implants, Surgical & Diagnostic Instruments and Other
Applications .................................................................. 249
3.5.3 Japan .........................................................250
3.5.3.1 Japanese Medical Ceramics Market Overview
by Ceramic Type .................................................... 250
Chart 138: Japanese Medical Ceramics Market Analysis
(2014-2022) by Ceramic Type – Bioactive Ceramics, Bioinert
Ceramics and Bioresorbable Ceramics in USD Million...... 250
Chart 139: Glance at 2014, 2017 and 2022 Japanese
Medical Ceramics Market Share (%) by Ceramic Type –
Bioactive Ceramics, Bioinert Ceramics and Bioresorbable
Ceramics ....................................................................... 251
3.5.3.2 Japanese Medical Ceramics Market Overview
by Application........................................................ 252
Chart 140: Japanese Medical Ceramics Market Analysis (2014-
2022) by Application – Dental Implants, Implantable Electronic
Devices, Orthopedic Implants, Surgical & Diagnostic
Instruments and Other Applications in USD Million.............252
Chart 141: Glance at 2014, 2017 and 2022 Japanese
Medical Ceramics Market Share (%) by Application –
Dental Implants, Implantable Electronic Devices,
Orthopedic Implants, Surgical & Diagnostic Instruments
and Other Applications .................................................253
3.5.4 South Korea ...............................................254
3.5.4.1 South Korean Medical Ceramics Market
Overview by Ceramic Type .................................... 254
Chart 142: South Korean Medical Ceramics Market Analysis
(2014-2022) by Ceramic Type – Bioactive Ceramics, Bioinert
Ceramics and Bioresorbable Ceramics in USD Million..........254
Chart 143: Glance at 2014, 2017 and 2022 South Korean
Medical Ceramics Market Share (%) by Ceramic Type –
Bioactive Ceramics, Bioinert Ceramics and Bioresorbable
Ceramics ....................................................................... 255
3.5.4.2 South Korean Medical Ceramics Market
Overview by Application........................................ 256
Chart 144: South Korean Medical Ceramics Market
Analysis (2014-2022) by Application – Dental Implants,
Implantable Electronic Devices, Orthopedic Implants,
Surgical & Diagnostic Instruments and Other Applications
in USD Million ...............................................................256
Chart 145: Glance at 2014, 2017 and 2022 South Korean
Medical Ceramics Market Share (%) by Application –
Dental Implants, Implantable Electronic Devices,
Orthopedic Implants, Surgical & Diagnostic Instruments
and Other Applications .................................................257
3.5.5 Rest of Asia-Pacific.....................................258
3.5.5.1 Rest of Asia Medical Ceramics Market
Overview by Ceramic Type .................................... 258
Chart 146: Rest of Asia-Pacific Medical Ceramics Market
Analysis (2014-2022) by Ceramic Type – Bioactive
Ceramics, Bioinert Ceramics and Bioresorbable Ceramics
in USD Million ...............................................................258
Chart 147: Glance at 2014, 2017 and 2022 Rest of Asia-
Pacific Medical Ceramics Market Share (%) by Ceramic
Type – Bioactive Ceramics, Bioinert Ceramics and
Bioresorbable Ceramics ................................................259
3.5.5.2 Rest of Asia Medical Ceramics Market
Overview by Application........................................ 260
Chart 148: Rest of Asia-Pacific Medical Ceramics Market
Analysis (2014-2022) by Application – Dental Implants,
Implantable Electronic Devices, Orthopedic Implants,
Surgical & Diagnostic Instruments and Other Applications
in USD Million............................................................... 260
Chart 149: Glance at 2014, 2017 and 2022 Rest of Asia-
Pacific Medical Ceramics Market Share (%) by Application
– Dental Implants, Implantable Electronic Devices,
Orthopedic Implants, Surgical & Diagnostic Instruments
and Other Applications................................................. 261
4. LATIN AMERICA ..............................................262
Chart 150: Latin American Medical Ceramics Market
Analysis (2014-2022) in USD Million............................. 262
4.1 Latin American Medical Ceramics Market
Overview by Geographic Region............................ 263
Chart 151: Latin American Medical Ceramics Market
Analysis (2014-2022) by Region – Argentina, Brazil, Mexico
and Rest of Latin America in USD Million...................... 263
Chart 152: Glance at 2014, 2017 and 2022 Latin American
Medical Ceramics Market Share (%) by Region – Argentina,
Brazil, Mexico and Rest of Latin America...................... 264
4.2 Latin American Medical Ceramics Market
Overview by Ceramic Type .................................... 265
Chart 153: Latin American Medical Ceramics Market Analysis
(2014-2022) by Ceramic Type – Bioactive Ceramics, Bioinert
Ceramics and Bioresorbable Ceramics in USD Million...... 265
Chart 154: Glance at 2014, 2017 and 2022 Latin American
Medical Ceramics Market Share (%) by Ceramic Type – Bioactive
Ceramics, Bioinert Ceramics and Bioresorbable Ceramics........266
4.2.1 Medical Ceramic Types Market Overview by
Global Region ........................................................ 267
4.2.1.1 Bioactive Ceramics..................................... 267
Chart 155: Latin American Bioactive Ceramics Market
Analysis (2014-2022) by Region – Argentina, Brazil, Mexico
and Rest of Latin America in USD Million...................... 267
Chart 156: Glance at 2014, 2017 and 2022 Latin American
Bioactive Ceramics Market Share (%) by Region –
Argentina, Brazil, Mexico and Rest of Latin America..... 268
4.2.1.2 Bioinert Ceramics....................................... 269
Chart 157: Latin American Bioinert Ceramics Market
Analysis (2014-2022) by Region – Argentina, Brazil, Mexico
and Rest of Latin America in USD Million...................... 269
Chart 158: Glance at 2014, 2017 and 2022 Latin American
Bioinert Ceramics Market Share (%) by Region – Argentina,
Brazil, Mexico and Rest of Latin America...................... 270
4.2.1.3 Bioresorbable Ceramics ............................. 271
Chart 159: Latin American Bioresorbable Ceramics Market
Analysis (2014-2022) by Region – Argentina, Brazil, Mexico
and Rest of Latin America in USD Million...................... 271
Chart 160: Glance at 2014, 2017 and 2022 Latin American
Bioresorbable Ceramics Market Share (%) by Region –
Argentina, Brazil, Mexico and Rest of Latin America..... 272
4.3 Latin American Medical Ceramics Market
Overview by Application........................................ 273
Chart 161: Latin American Medical Ceramics Market
Analysis (2014-2022) by Application – Dental Implants,
Implantable Electronic Devices, Orthopedic Implants,
Surgical & Diagnostic Instruments and Other Applications
in USD Million............................................................... 273
Chart 162: Glance at 2014, 2017 and 2022 Latin American
Medical Ceramics Market Share (%) by Application –
Dental Implants, Implantable Electronic Devices,
Orthopedic Implants, Surgical & Diagnostic Instruments
and Other Applications................................................. 274
4.3.1 Medical Ceramics Applications Market Overview
by Global Region.................................................... 275
4.3.1.1 Dental Implants ......................................... 275
Chart 163: Latin American Medical Ceramics Market Analysis
(2014-2022) in Dental Implants by Region – Argentina, Brazil,
Mexico and Rest of Latin America in USD Million............. 275
Chart 164: Glance at 2014, 2017 and 2022 Latin American
Medical Ceramics Market Share (%) in Dental Implants by
Region – Argentina, Brazil, Mexico and Rest of Latin
America........................................................................ 276
Page 7
Medical Ceramics – A Global Market Overview
February 2017 |312 Pages | 193 Charts | Price $4050
Click here to buy the report
4.3.1.2 Implantable Electronic Devices.................. 277
Chart 165: Latin American Medical Ceramics Market
Analysis (2014-2022) in Implantable Electronic Devices by
Region – Argentina, Brazil, Mexico and Rest of Latin
America in USD Million..................................................277
Chart 166: Glance at 2014, 2017 and 2022 Latin American Medical
Ceramics Market Share (%) in Implantable Electronic Devices by
Region – Argentina, Brazil, Mexico and Rest of Latin America......278
4.3.1.3 Orthopedic Implants.................................. 279
Chart 167: Latin American Medical Ceramics Market Analysis
(2014-2022) in Orthopedic Implants by Region – Argentina,
Brazil, Mexico and Rest of Latin America in USD Million ......279
Chart 168: Glance at 2014, 2017 and 2022 Latin American
Medical Ceramics Market Share (%) in Orthopedic Implants by
Region – Argentina, Brazil, Mexico and Rest of Latin America..280
4.3.1.4 Surgical & Diagnostic Instruments ............. 281
Chart 169: Latin American Medical Ceramics Market
Analysis (2014-2022) in Surgical & Diagnostic Instruments
by Region – Argentina, Brazil, Mexico and Rest of Latin
America in USD Million..................................................281
Chart 170: Glance at 2014, 2017 and 2022 Latin American
Medical Ceramics Market Share (%) in Surgical &
Diagnostic Instruments by Region – Argentina, Brazil,
Mexico and Rest of Latin America .................................282
4.3.1.5 Other Applications..................................... 283
Chart 171: Latin American Medical Ceramics Market Analysis
(2014-2022) in Other Applications by Region – Argentina,
Brazil, Mexico and Rest of Latin America in USD Million ......283
Chart 172: Glance at 2014, 2017 and 2022 Latin American
Medical Ceramics Market Share (%) in Other Applications by
Region – Argentina, Brazil, Mexico and Rest of Latin America..284
4.4 Country-wise Analysis of Latin American Medical
Ceramics Market.................................................... 285
4.4.1 Argentina...................................................285
4.4.1.1 Argentinean Medical Ceramics Market
Overview by Ceramic Type .................................... 285
Chart 173: Argentine Medical Ceramics Market Analysis
(2014-2022) by Ceramic Type – Bioactive Ceramics, Bioinert
Ceramics and Bioresorbable Ceramics in USD Million...... 285
Chart 174: Glance at 2014, 2017 and 2022 Argentine Medical
Ceramics Market Share (%) by Ceramic Type – Bioactive
Ceramics, Bioinert Ceramics and Bioresorbable Ceramics....286
4.4.1.2 Argentinean Medical Ceramics Market
Overview by Application........................................ 287
Chart 175: Argentine Medical Ceramics Market Analysis (2014-
2022) by Application – Dental Implants, Implantable Electronic
Devices, Orthopedic Implants, Surgical & Diagnostic
Instruments and Other Applications in USD Million..............287
Chart 176: Glance at 2014, 2017 and 2022 Argentine Medical
Ceramics Market Share (%) by Application – Dental Implants,
Implantable Electronic Devices, Orthopedic Implants, Surgical
& Diagnostic Instruments and Other Applications................288
4.4.2 Brazil..........................................................289
4.4.2.1 Brazilian Medical Ceramics Market Overview
by Ceramic Type .................................................... 289
Chart 177: Brazilian Medical Ceramics Market Analysis
(2014-2022) by Ceramic Type – Bioactive Ceramics, Bioinert
Ceramics and Bioresorbable Ceramics in USD Million...... 289
Chart 178: Glance at 2014, 2017 and 2022 Brazilian
Medical Ceramics Market Share (%) by Ceramic Type –
Bioactive Ceramics, Bioinert Ceramics and Bioresorbable
Ceramics ....................................................................... 290
4.4.2.2 Brazilian Medical Ceramics Market Overview
by Application........................................................ 291
Chart 179: Brazilian Medical Ceramics Market Analysis (2014-
2022) by Application – Dental Implants, Implantable Electronic
Devices, Orthopedic Implants, Surgical & Diagnostic
Instruments and Other Applications in USD Million .............291
Chart 180: Glance at 2014, 2017 and 2022 Brazilian
Medical Ceramics Market Share (%) by Application –
Dental Implants, Implantable Electronic Devices,
Orthopedic Implants, Surgical & Diagnostic Instruments
and Other Applications .................................................292
4.4.3 Mexico.......................................................293
4.4.3.1 Mexican Medical Ceramics Market Overview
by Ceramic Type .................................................... 293
Chart 181: Mexican Medical Ceramics Market Analysis
(2014-2022) by Ceramic Type – Bioactive Ceramics, Bioinert
Ceramics and Bioresorbable Ceramics in USD Million...... 293
Chart 182: Glance at 2014, 2017 and 2022 Mexican
Medical Ceramics Market Share (%) by Ceramic Type –
Bioactive Ceramics, Bioinert Ceramics and Bioresorbable
Ceramics ....................................................................... 294
4.4.3.2 Mexican Medical Ceramics Market Overview
by Application........................................................ 295
Chart 183: Mexican Medical Ceramics Market Analysis
(2014-2022) by Application – Dental Implants, Implantable
Electronic Devices, Orthopedic Implants, Surgical &
Diagnostic Instruments and Other Applications in USD
Million........................................................................... 295
Chart 184: Glance at 2014, 2017 and 2022 Mexican
Medical Ceramics Market Share (%) by Application –
Dental Implants, Implantable Electronic Devices,
Orthopedic Implants, Surgical & Diagnostic Instruments
and Other Applications .................................................296
4.4.4 Rest of Latin America .................................297
4.4.4.1 Rest of Latin America Medical Ceramics
Market Overview by Ceramic Type........................ 297
Chart 185: Rest of Latin America Medical Ceramics Market
Analysis (2014-2022) by Ceramic Type – Bioactive
Ceramics, Bioinert Ceramics and Bioresorbable Ceramics
in USD Million ...............................................................297
Chart 186: Glance at 2014, 2017 and 2022 Rest of Latin
America Medical Ceramics Market Share (%) by Ceramic
Type – Bioactive Ceramics, Bioinert Ceramics and
Bioresorbable Ceramics................................................ 298
4.4.4.2 Rest of Latin America Medical Ceramics
Market Overview by Application ........................... 299
Chart 187: Rest of Latin America Medical Ceramics Market
Analysis (2014-2022) by Application – Dental Implants,
Implantable Electronic Devices, Orthopedic Implants,
Surgical & Diagnostic Instruments and Other Applications
in USD Million............................................................... 299
Chart 188: Glance at 2014, 2017 and 2022 Rest of Latin
America Medical Ceramics Market Share (%) by
Application – Dental Implants, Implantable Electronic
Devices, Orthopedic Implants, Surgical & Diagnostic
Instruments and Other Applications............................. 300
5. REST OF WORLD..............................................301
Chart 189: Rest of World Medical Ceramics Market
Analysis (2014-2022) in USD Million............................. 301
5.1 Rest World Medical Ceramics Market Overview by
Ceramic Type......................................................... 302
Chart 190: Rest of World Medical Ceramics Market Analysis
(2014-2022) by Ceramic Type – Bioactive Ceramics, Bioinert
Ceramics and Bioresorbable Ceramics in USD Million .......... 302
Chart 191: Glance at 2014, 2017 and 2022 Rest of World
Medical Ceramics Market Share (%) by Ceramic Type –
Bioactive Ceramics, Bioinert Ceramics and Bioresorbable
Ceramics....................................................................... 303
5.2 Rest World Medical Ceramics Market Overview by
Application ............................................................ 304
Chart 192: Rest of World Medical Ceramics Market Analysis
(2014-2022) by Application – Dental Implants, Implantable
Electronic Devices, Orthopedic Implants, Surgical & Diagnostic
Instruments and Other Applications in USD Million ............. 304
Chart 193: Glance at 2014, 2017 and 2022 Rest of World
Medical Ceramics Market Share (%) by Application –
Dental Implants, Implantable Electronic Devices,
Orthopedic Implants, Surgical & Diagnostic Instruments
and Other Applications................................................. 305
Micro Ceramics Limited (Israel) – A Major Player......... 306
PART C: GUIDE TO THE INDUSTRY...............307
1. NORTH AMERICA ............................................307
2. EUROPE ..........................................................308
3. ASIA-PACIFIC...................................................310
4. REST OF WORLD..............................................310
PART D: ANNEXURE....................................311
1. RESEARCH METHODOLOGY .............................311
2. FEEDBACK.......................................................313
About Industry Experts
Industry Experts values the most updated and accurate market research
and industry analysis to provide unique market research reports for a
broad range of industry verticals including Automotive, Transportation,
Healthcare, Pharmaceuticals, Food & Beverages, Chemicals, Plastics,
Materials, Consumer Goods, Retail, Biotechnology, Construction,
Manufacturing and Other industries. Our research reports help our clients
to identify and resolve topical issues by providing a complete picture of
the market in their respective industry sectors. The Company’s rich
collection of market research reports enables the companies to explore
market drivers; forecast the future market; and to formulate the right
strategies at the right time.
Industry Experts’ leading edge publications makes the life easy for
corporate strategists, investors, analysts and researchers, start ups,
consultants, financial and banking executives, academicians and many
more. The company also provides customized research reports to cater
the needs of the industry.
More about Industry Experts
INDUSTRY EXPERTS
1-7-19/C, Street No. 8, Habsiguda
Hyderabad – 500007, India
Phone: +91-40-4018-1314
Fax: +91-40-4027-2381
info@industry-experts.com
industry-experts.com

Weitere ähnliche Inhalte

Mehr von Industry Experts

Ventilation Equipment - A European Market Overview
Ventilation Equipment - A European Market OverviewVentilation Equipment - A European Market Overview
Ventilation Equipment - A European Market OverviewIndustry Experts
 
High Performance Polyamides – A Global Market Overview
High Performance Polyamides – A Global Market OverviewHigh Performance Polyamides – A Global Market Overview
High Performance Polyamides – A Global Market OverviewIndustry Experts
 
Polyphenylene Sulfide (PPS) – A Global Market Overview
Polyphenylene Sulfide (PPS) – A Global Market OverviewPolyphenylene Sulfide (PPS) – A Global Market Overview
Polyphenylene Sulfide (PPS) – A Global Market OverviewIndustry Experts
 
Aramid Fibers (Para and Meta) – A Global Market Overview
Aramid Fibers (Para and Meta) – A Global Market OverviewAramid Fibers (Para and Meta) – A Global Market Overview
Aramid Fibers (Para and Meta) – A Global Market OverviewIndustry Experts
 
Biolubricants – A Global Market Overview
Biolubricants – A Global Market OverviewBiolubricants – A Global Market Overview
Biolubricants – A Global Market OverviewIndustry Experts
 
En002 solar-photovoltaic-installations a-global-market-overview
En002 solar-photovoltaic-installations a-global-market-overviewEn002 solar-photovoltaic-installations a-global-market-overview
En002 solar-photovoltaic-installations a-global-market-overviewIndustry Experts
 
Omega-3 Polyunsaturated Fatty Acids (PUFAs) – A Global Market Overview
Omega-3 Polyunsaturated Fatty Acids (PUFAs) – A Global Market OverviewOmega-3 Polyunsaturated Fatty Acids (PUFAs) – A Global Market Overview
Omega-3 Polyunsaturated Fatty Acids (PUFAs) – A Global Market OverviewIndustry Experts
 
Industrial Adhesives: Products and Applications – A Global Market Overview
Industrial Adhesives: Products and Applications – A Global Market OverviewIndustrial Adhesives: Products and Applications – A Global Market Overview
Industrial Adhesives: Products and Applications – A Global Market OverviewIndustry Experts
 
Industrial Adhesives: Products and Technologies – A Global Market Overview
Industrial Adhesives: Products and Technologies – A Global Market OverviewIndustrial Adhesives: Products and Technologies – A Global Market Overview
Industrial Adhesives: Products and Technologies – A Global Market OverviewIndustry Experts
 
Global Automotive Sensors Market with Special Focus on MEMS Sensors
Global Automotive Sensors Market with Special Focus on MEMS SensorsGlobal Automotive Sensors Market with Special Focus on MEMS Sensors
Global Automotive Sensors Market with Special Focus on MEMS SensorsIndustry Experts
 
Biopharmaceuticals – A Global Market Overview
Biopharmaceuticals – A Global Market OverviewBiopharmaceuticals – A Global Market Overview
Biopharmaceuticals – A Global Market OverviewIndustry Experts
 
Engineering Plastics A Global Market Overview
Engineering Plastics  A Global Market OverviewEngineering Plastics  A Global Market Overview
Engineering Plastics A Global Market OverviewIndustry Experts
 
Carbon Fibers & Carbon Fiber Reinforced Plastics (CFRP) - A Global Market Ove...
Carbon Fibers & Carbon Fiber Reinforced Plastics (CFRP) - A Global Market Ove...Carbon Fibers & Carbon Fiber Reinforced Plastics (CFRP) - A Global Market Ove...
Carbon Fibers & Carbon Fiber Reinforced Plastics (CFRP) - A Global Market Ove...Industry Experts
 
Industrial Abrasives A Global Market Overview
Industrial Abrasives A Global Market OverviewIndustrial Abrasives A Global Market Overview
Industrial Abrasives A Global Market OverviewIndustry Experts
 
Glass Fibers: Fiberglass/Glass Wool and Glass Fiber Reinforcements – A Global...
Glass Fibers: Fiberglass/Glass Wool and Glass Fiber Reinforcements – A Global...Glass Fibers: Fiberglass/Glass Wool and Glass Fiber Reinforcements – A Global...
Glass Fibers: Fiberglass/Glass Wool and Glass Fiber Reinforcements – A Global...Industry Experts
 

Mehr von Industry Experts (15)

Ventilation Equipment - A European Market Overview
Ventilation Equipment - A European Market OverviewVentilation Equipment - A European Market Overview
Ventilation Equipment - A European Market Overview
 
High Performance Polyamides – A Global Market Overview
High Performance Polyamides – A Global Market OverviewHigh Performance Polyamides – A Global Market Overview
High Performance Polyamides – A Global Market Overview
 
Polyphenylene Sulfide (PPS) – A Global Market Overview
Polyphenylene Sulfide (PPS) – A Global Market OverviewPolyphenylene Sulfide (PPS) – A Global Market Overview
Polyphenylene Sulfide (PPS) – A Global Market Overview
 
Aramid Fibers (Para and Meta) – A Global Market Overview
Aramid Fibers (Para and Meta) – A Global Market OverviewAramid Fibers (Para and Meta) – A Global Market Overview
Aramid Fibers (Para and Meta) – A Global Market Overview
 
Biolubricants – A Global Market Overview
Biolubricants – A Global Market OverviewBiolubricants – A Global Market Overview
Biolubricants – A Global Market Overview
 
En002 solar-photovoltaic-installations a-global-market-overview
En002 solar-photovoltaic-installations a-global-market-overviewEn002 solar-photovoltaic-installations a-global-market-overview
En002 solar-photovoltaic-installations a-global-market-overview
 
Omega-3 Polyunsaturated Fatty Acids (PUFAs) – A Global Market Overview
Omega-3 Polyunsaturated Fatty Acids (PUFAs) – A Global Market OverviewOmega-3 Polyunsaturated Fatty Acids (PUFAs) – A Global Market Overview
Omega-3 Polyunsaturated Fatty Acids (PUFAs) – A Global Market Overview
 
Industrial Adhesives: Products and Applications – A Global Market Overview
Industrial Adhesives: Products and Applications – A Global Market OverviewIndustrial Adhesives: Products and Applications – A Global Market Overview
Industrial Adhesives: Products and Applications – A Global Market Overview
 
Industrial Adhesives: Products and Technologies – A Global Market Overview
Industrial Adhesives: Products and Technologies – A Global Market OverviewIndustrial Adhesives: Products and Technologies – A Global Market Overview
Industrial Adhesives: Products and Technologies – A Global Market Overview
 
Global Automotive Sensors Market with Special Focus on MEMS Sensors
Global Automotive Sensors Market with Special Focus on MEMS SensorsGlobal Automotive Sensors Market with Special Focus on MEMS Sensors
Global Automotive Sensors Market with Special Focus on MEMS Sensors
 
Biopharmaceuticals – A Global Market Overview
Biopharmaceuticals – A Global Market OverviewBiopharmaceuticals – A Global Market Overview
Biopharmaceuticals – A Global Market Overview
 
Engineering Plastics A Global Market Overview
Engineering Plastics  A Global Market OverviewEngineering Plastics  A Global Market Overview
Engineering Plastics A Global Market Overview
 
Carbon Fibers & Carbon Fiber Reinforced Plastics (CFRP) - A Global Market Ove...
Carbon Fibers & Carbon Fiber Reinforced Plastics (CFRP) - A Global Market Ove...Carbon Fibers & Carbon Fiber Reinforced Plastics (CFRP) - A Global Market Ove...
Carbon Fibers & Carbon Fiber Reinforced Plastics (CFRP) - A Global Market Ove...
 
Industrial Abrasives A Global Market Overview
Industrial Abrasives A Global Market OverviewIndustrial Abrasives A Global Market Overview
Industrial Abrasives A Global Market Overview
 
Glass Fibers: Fiberglass/Glass Wool and Glass Fiber Reinforcements – A Global...
Glass Fibers: Fiberglass/Glass Wool and Glass Fiber Reinforcements – A Global...Glass Fibers: Fiberglass/Glass Wool and Glass Fiber Reinforcements – A Global...
Glass Fibers: Fiberglass/Glass Wool and Glass Fiber Reinforcements – A Global...
 

Kürzlich hochgeladen

PHX May 2024 Corporate Presentation Final
PHX May 2024 Corporate Presentation FinalPHX May 2024 Corporate Presentation Final
PHX May 2024 Corporate Presentation FinalPanhandleOilandGas
 
Al Mizhar Dubai Escorts +971561403006 Escorts Service In Al Mizhar
Al Mizhar Dubai Escorts +971561403006 Escorts Service In Al MizharAl Mizhar Dubai Escorts +971561403006 Escorts Service In Al Mizhar
Al Mizhar Dubai Escorts +971561403006 Escorts Service In Al Mizharallensay1
 
Falcon Invoice Discounting: The best investment platform in india for investors
Falcon Invoice Discounting: The best investment platform in india for investorsFalcon Invoice Discounting: The best investment platform in india for investors
Falcon Invoice Discounting: The best investment platform in india for investorsFalcon Invoice Discounting
 
CROSS CULTURAL NEGOTIATION BY PANMISEM NS
CROSS CULTURAL NEGOTIATION BY PANMISEM NSCROSS CULTURAL NEGOTIATION BY PANMISEM NS
CROSS CULTURAL NEGOTIATION BY PANMISEM NSpanmisemningshen123
 
Falcon Invoice Discounting: Empowering Your Business Growth
Falcon Invoice Discounting: Empowering Your Business GrowthFalcon Invoice Discounting: Empowering Your Business Growth
Falcon Invoice Discounting: Empowering Your Business GrowthFalcon investment
 
SEO Case Study: How I Increased SEO Traffic & Ranking by 50-60% in 6 Months
SEO Case Study: How I Increased SEO Traffic & Ranking by 50-60%  in 6 MonthsSEO Case Study: How I Increased SEO Traffic & Ranking by 50-60%  in 6 Months
SEO Case Study: How I Increased SEO Traffic & Ranking by 50-60% in 6 MonthsIndeedSEO
 
How to Get Started in Social Media for Art League City
How to Get Started in Social Media for Art League CityHow to Get Started in Social Media for Art League City
How to Get Started in Social Media for Art League CityEric T. Tung
 
Challenges and Opportunities: A Qualitative Study on Tax Compliance in Pakistan
Challenges and Opportunities: A Qualitative Study on Tax Compliance in PakistanChallenges and Opportunities: A Qualitative Study on Tax Compliance in Pakistan
Challenges and Opportunities: A Qualitative Study on Tax Compliance in Pakistanvineshkumarsajnani12
 
Jual Obat Aborsi ( Asli No.1 ) 085657271886 Obat Penggugur Kandungan Cytotec
Jual Obat Aborsi ( Asli No.1 ) 085657271886 Obat Penggugur Kandungan CytotecJual Obat Aborsi ( Asli No.1 ) 085657271886 Obat Penggugur Kandungan Cytotec
Jual Obat Aborsi ( Asli No.1 ) 085657271886 Obat Penggugur Kandungan CytotecZurliaSoop
 
Pre Engineered Building Manufacturers Hyderabad.pptx
Pre Engineered  Building Manufacturers Hyderabad.pptxPre Engineered  Building Manufacturers Hyderabad.pptx
Pre Engineered Building Manufacturers Hyderabad.pptxRoofing Contractor
 
New 2024 Cannabis Edibles Investor Pitch Deck Template
New 2024 Cannabis Edibles Investor Pitch Deck TemplateNew 2024 Cannabis Edibles Investor Pitch Deck Template
New 2024 Cannabis Edibles Investor Pitch Deck TemplateCannaBusinessPlans
 
Marel Q1 2024 Investor Presentation from May 8, 2024
Marel Q1 2024 Investor Presentation from May 8, 2024Marel Q1 2024 Investor Presentation from May 8, 2024
Marel Q1 2024 Investor Presentation from May 8, 2024Marel
 
Berhampur 70918*19311 CALL GIRLS IN ESCORT SERVICE WE ARE PROVIDING
Berhampur 70918*19311 CALL GIRLS IN ESCORT SERVICE WE ARE PROVIDINGBerhampur 70918*19311 CALL GIRLS IN ESCORT SERVICE WE ARE PROVIDING
Berhampur 70918*19311 CALL GIRLS IN ESCORT SERVICE WE ARE PROVIDINGpr788182
 
Horngren’s Cost Accounting A Managerial Emphasis, Canadian 9th edition soluti...
Horngren’s Cost Accounting A Managerial Emphasis, Canadian 9th edition soluti...Horngren’s Cost Accounting A Managerial Emphasis, Canadian 9th edition soluti...
Horngren’s Cost Accounting A Managerial Emphasis, Canadian 9th edition soluti...ssuserf63bd7
 
Getting Real with AI - Columbus DAW - May 2024 - Nick Woo from AlignAI
Getting Real with AI - Columbus DAW - May 2024 - Nick Woo from AlignAIGetting Real with AI - Columbus DAW - May 2024 - Nick Woo from AlignAI
Getting Real with AI - Columbus DAW - May 2024 - Nick Woo from AlignAITim Wilson
 
Lundin Gold - Q1 2024 Conference Call Presentation (Revised)
Lundin Gold - Q1 2024 Conference Call Presentation (Revised)Lundin Gold - Q1 2024 Conference Call Presentation (Revised)
Lundin Gold - Q1 2024 Conference Call Presentation (Revised)Adnet Communications
 
Chennai Call Gril 80022//12248 Only For Sex And High Profile Best Gril Sex Av...
Chennai Call Gril 80022//12248 Only For Sex And High Profile Best Gril Sex Av...Chennai Call Gril 80022//12248 Only For Sex And High Profile Best Gril Sex Av...
Chennai Call Gril 80022//12248 Only For Sex And High Profile Best Gril Sex Av...pujan9679
 
Dr. Admir Softic_ presentation_Green Club_ENG.pdf
Dr. Admir Softic_ presentation_Green Club_ENG.pdfDr. Admir Softic_ presentation_Green Club_ENG.pdf
Dr. Admir Softic_ presentation_Green Club_ENG.pdfAdmir Softic
 

Kürzlich hochgeladen (20)

PHX May 2024 Corporate Presentation Final
PHX May 2024 Corporate Presentation FinalPHX May 2024 Corporate Presentation Final
PHX May 2024 Corporate Presentation Final
 
Al Mizhar Dubai Escorts +971561403006 Escorts Service In Al Mizhar
Al Mizhar Dubai Escorts +971561403006 Escorts Service In Al MizharAl Mizhar Dubai Escorts +971561403006 Escorts Service In Al Mizhar
Al Mizhar Dubai Escorts +971561403006 Escorts Service In Al Mizhar
 
Falcon Invoice Discounting: The best investment platform in india for investors
Falcon Invoice Discounting: The best investment platform in india for investorsFalcon Invoice Discounting: The best investment platform in india for investors
Falcon Invoice Discounting: The best investment platform in india for investors
 
HomeRoots Pitch Deck | Investor Insights | April 2024
HomeRoots Pitch Deck | Investor Insights | April 2024HomeRoots Pitch Deck | Investor Insights | April 2024
HomeRoots Pitch Deck | Investor Insights | April 2024
 
CROSS CULTURAL NEGOTIATION BY PANMISEM NS
CROSS CULTURAL NEGOTIATION BY PANMISEM NSCROSS CULTURAL NEGOTIATION BY PANMISEM NS
CROSS CULTURAL NEGOTIATION BY PANMISEM NS
 
Falcon Invoice Discounting: Empowering Your Business Growth
Falcon Invoice Discounting: Empowering Your Business GrowthFalcon Invoice Discounting: Empowering Your Business Growth
Falcon Invoice Discounting: Empowering Your Business Growth
 
SEO Case Study: How I Increased SEO Traffic & Ranking by 50-60% in 6 Months
SEO Case Study: How I Increased SEO Traffic & Ranking by 50-60%  in 6 MonthsSEO Case Study: How I Increased SEO Traffic & Ranking by 50-60%  in 6 Months
SEO Case Study: How I Increased SEO Traffic & Ranking by 50-60% in 6 Months
 
Buy gmail accounts.pdf buy Old Gmail Accounts
Buy gmail accounts.pdf buy Old Gmail AccountsBuy gmail accounts.pdf buy Old Gmail Accounts
Buy gmail accounts.pdf buy Old Gmail Accounts
 
How to Get Started in Social Media for Art League City
How to Get Started in Social Media for Art League CityHow to Get Started in Social Media for Art League City
How to Get Started in Social Media for Art League City
 
Challenges and Opportunities: A Qualitative Study on Tax Compliance in Pakistan
Challenges and Opportunities: A Qualitative Study on Tax Compliance in PakistanChallenges and Opportunities: A Qualitative Study on Tax Compliance in Pakistan
Challenges and Opportunities: A Qualitative Study on Tax Compliance in Pakistan
 
Jual Obat Aborsi ( Asli No.1 ) 085657271886 Obat Penggugur Kandungan Cytotec
Jual Obat Aborsi ( Asli No.1 ) 085657271886 Obat Penggugur Kandungan CytotecJual Obat Aborsi ( Asli No.1 ) 085657271886 Obat Penggugur Kandungan Cytotec
Jual Obat Aborsi ( Asli No.1 ) 085657271886 Obat Penggugur Kandungan Cytotec
 
Pre Engineered Building Manufacturers Hyderabad.pptx
Pre Engineered  Building Manufacturers Hyderabad.pptxPre Engineered  Building Manufacturers Hyderabad.pptx
Pre Engineered Building Manufacturers Hyderabad.pptx
 
New 2024 Cannabis Edibles Investor Pitch Deck Template
New 2024 Cannabis Edibles Investor Pitch Deck TemplateNew 2024 Cannabis Edibles Investor Pitch Deck Template
New 2024 Cannabis Edibles Investor Pitch Deck Template
 
Marel Q1 2024 Investor Presentation from May 8, 2024
Marel Q1 2024 Investor Presentation from May 8, 2024Marel Q1 2024 Investor Presentation from May 8, 2024
Marel Q1 2024 Investor Presentation from May 8, 2024
 
Berhampur 70918*19311 CALL GIRLS IN ESCORT SERVICE WE ARE PROVIDING
Berhampur 70918*19311 CALL GIRLS IN ESCORT SERVICE WE ARE PROVIDINGBerhampur 70918*19311 CALL GIRLS IN ESCORT SERVICE WE ARE PROVIDING
Berhampur 70918*19311 CALL GIRLS IN ESCORT SERVICE WE ARE PROVIDING
 
Horngren’s Cost Accounting A Managerial Emphasis, Canadian 9th edition soluti...
Horngren’s Cost Accounting A Managerial Emphasis, Canadian 9th edition soluti...Horngren’s Cost Accounting A Managerial Emphasis, Canadian 9th edition soluti...
Horngren’s Cost Accounting A Managerial Emphasis, Canadian 9th edition soluti...
 
Getting Real with AI - Columbus DAW - May 2024 - Nick Woo from AlignAI
Getting Real with AI - Columbus DAW - May 2024 - Nick Woo from AlignAIGetting Real with AI - Columbus DAW - May 2024 - Nick Woo from AlignAI
Getting Real with AI - Columbus DAW - May 2024 - Nick Woo from AlignAI
 
Lundin Gold - Q1 2024 Conference Call Presentation (Revised)
Lundin Gold - Q1 2024 Conference Call Presentation (Revised)Lundin Gold - Q1 2024 Conference Call Presentation (Revised)
Lundin Gold - Q1 2024 Conference Call Presentation (Revised)
 
Chennai Call Gril 80022//12248 Only For Sex And High Profile Best Gril Sex Av...
Chennai Call Gril 80022//12248 Only For Sex And High Profile Best Gril Sex Av...Chennai Call Gril 80022//12248 Only For Sex And High Profile Best Gril Sex Av...
Chennai Call Gril 80022//12248 Only For Sex And High Profile Best Gril Sex Av...
 
Dr. Admir Softic_ presentation_Green Club_ENG.pdf
Dr. Admir Softic_ presentation_Green Club_ENG.pdfDr. Admir Softic_ presentation_Green Club_ENG.pdf
Dr. Admir Softic_ presentation_Green Club_ENG.pdf
 

Medical Ceramics - A Global Market Overview

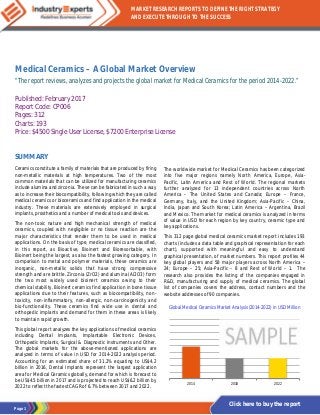
  • 1. Page 1 MARKET RESEARCH REPORTS TO DEFINE THE RIGHT STRATEGY AND EXECUTE THROUGH TO THE SUCCESS Click here to buy the report Medical Ceramics – A Global Market Overview “The report reviews, analyzes and projects the global market for Medical Ceramics for the period 2014-2022.” Published: February 2017 Report Code: CP006 Pages: 312 Charts: 193 Price: $4500 Single User License, $7200 Enterprise License SUMMARY Ceramics constitute a family of materials that are produced by firing non-metallic materials at high temperatures. Two of the most common materials that can be utilized for manufacturing ceramics include alumina and zirconia. These can be fabricated in such a way as to increase their biocompatibility, following which they are called medical ceramics or bioceramics and find application in the medical industry. These materials are extensively employed in surgical implants, prosthetics and a number of medical tools and devices. The non-toxic nature and high mechanical strength of medical ceramics, coupled with negligible or no tissue reaction are the major characteristics that render them to be used in medical applications. On the basis of type, medical ceramics are classified, in this report, as Bioactive, Bioinert and Bioresorbable, with Bioinert being the largest, as also the fastest growing category. In comparison to metal and polymer materials, these ceramics are inorganic, non-metallic solids that have strong compressive strength and are brittle. Zirconia (ZrO2) and alumina (Al2O3) form the two most widely used bioinert ceramics owing to their chemical stability. Bioinert ceramics find application in bone tissue applications due to their features, such as biocompatibility, non- toxicity, non-inflammatory, non-allergic, non-carcinogenicity and bio-functionality. These ceramics find wide use in dental and orthopedic implants and demand for them in these areas is likely to maintain rapid growth. This global report analyzes the key applications of medical ceramics including Dental Implants, Implantable Electronic Devices, Orthopedic Implants, Surgical & Diagnostic Instruments and Other. The global markets for the above-mentioned applications are analyzed in terms of value in USD for 2014-2022 analysis period. Accounting for an estimated share of 31.2% equating to US$4.2 billion in 2016, Dental Implants represent the largest application area for Medical Ceramics globally, demand for which is forecast to be US$4.5 billion in 2017 and is projected to reach US$6.2 billion by 2022 to reflect the fastest CAGR of 6.7% between 2017 and 2022. The worldwide market for Medical Ceramics has been categorized into five major regions namely North America, Europe, Asia- Pacific, Latin America and Rest of World. The regional markets further analyzed for 13 independent countries across North America – The United States and Canada; Europe – France, Germany, Italy, and the United Kingdom; Asia-Pacific – China, India, Japan and South Korea; Latin America – Argentina, Brazil and Mexico. The market for medical ceramics is analyzed in terms of value in USD for each region by key country, ceramic type and key applications. This 312 page global medical ceramics market report includes 193 charts (includes a data table and graphical representation for each chart), supported with meaningful and easy to understand graphical presentation, of market numbers. This report profiles 44 key global players and 58 major players across North America – 24; Europe – 25; Asia-Pacific – 8 and Rest of World – 1. The research also provides the listing of the companies engaged in R&D, manufacturing and supply of medical ceramics. The global list of companies covers the address, contact numbers and the website addresses of 90 companies. Global Medical Ceramics Market Analysis (2014-2022) in USD Million 2014 2018 2022
  • 2. Page 2 Medical Ceramics – A Global Market Overview February 2017 |312 Pages | 193 Charts | Price $4050 Click here to buy the report SAMPLE COMPANY PROFILE COORSTEK, INC. (UNITED STATES) 14143 Denver West Pkwy, Suite 400 Golden Colorado 80401 United States Phone: 303 271 7000 Fax: 303-271-7009 Email: info@coorstek.com Website: www.coorstek.com Business Overview Established in 1910 and based in Golden, Colorado, CoorsTek Inc., (CoorsTek) is one of the leading developer and manufacturer of ceramics for semiconductor, oil and gas, electronics, energy, medical, machinery, armor and defense markets. The company offers analytical laboratory services such as brazing, bonding, and joining services; custom components and assemblies; grinding, lapping, and polishing services; laser machining services; metalizing services; precision machine-to-print services; and manufacturing consulting services. CoorsTek’s products include rings, computer peripheral components, desiccator plates, ESD- safe materials, food and beverage components, bonding tools, hydro cyclone linings, implantable ceramics, knife blades, laser equipment components, metallized ceramics, nozzles, optical components, pulsation equipment, range igniters, semiconductor components, tubes and rods, substrates, valves, wire components, and X-ray tubes. The company operates research & development centers across three continents and 600,000 square meters of manufacturing space in over 50 manufacturing centers worldwide, serving 10,000 customers with export locations covering Europe, North America, South America, and Asia. Product Portfolio Product Type/uses Implantable Components CoorsTek offers high-purity CeraSurf®-p medical ceramic components and multi-material assemblies combining high- performance ceramics, metals, and polymers to ensure compatibility and longevity for implantable application. Ceramic hip implant components CeraSurf®-p ceramic hip implant femoral heads and acetabular liners (cups) demonstrate extreme durability and longevity Neobone™ ceramic bone substitute NeoBone™ hydroxyapatite synthetic bone substitute is a highly functional synthetic bone filler. Its porous, yet rigid structure facilitates the penetration of tissue and provides structure to aid in new tissue formation. Engineered ceramics Ceramic materials are designed for optimal performance in medical device applications including: biocompatibility, superior chemical resistance, high strength & rigidity, thermal stability, excellent high-temperature electrical resistivity. Types include ceraPure custom medical ceramic components, ceramic balls & ball blanks, laser ceramic components, valves and valve components and micro dispense nozzles Durable ceramic materials & precision CoorsTek provides an array of hard, durable, inert, and corrosion-resistant components for pharmaceutical manufacturing. Types include ceramic blades & sharpeners, ceramic catalyst support media, grinding media, labware, ceramic chemical converters, supports, gauzes, and ferrules, tubes & rods, valves and valve components, pulsation equipment and hard face seal components …………………….more SAMPLE TABLE/CHART Glance at 2017 Global Medical Ceramics Market Share (%) by Geographic Region – North America, Europe, Asia-Pacific, Latin America and Rest of World Asia-Pacific Medical Ceramics Market Analysis (2014-2022) by Application – Dental Implants, Implantable Electronic Devices, Orthopedic Implants, Surgical & Diagnostic Instruments and Other Applications in USD Million KEY PLAYERS PROFILED · Advanced Industrial Ceramics · Berkeley Advanced Biomaterials, Inc. · Coorstek Medical LLC · Coorstek, Inc. · Depuy Synthes, Inc. · Ferro-Ceramic Grinding, Inc. · International Ceramic Engineering · Kuraray Co., Ltd. · Kyocera Corporation · Lucideon Limited · Micro Ceramics Limited · Morgan Advanced Materials PLC · Murata Manufacturing Company, Ltd. · Noritake Co., Limited · Precision Ferrites & Ceramics · Refractron Technologies Corporation · Saint-Gobain Ceramics & Plastics, Inc. · Stryker Corporation · Superior Technical Ceramics Corporation · T.Q. Abrasive Machining Company · TRS Technologies, Inc. · Zimmer Biomet Holdings, Inc. …………………….more 2014 2018 2022
  • 3. Page 3 Medical Ceramics – A Global Market Overview February 2017 |312 Pages | 193 Charts | Price $4050 Click here to buy the report TABLE OF CONTENTS PART A: GLOBAL MARKET PERSPECTIVE ........ 1 1. INTRODUCTION ..................................................1 Chart 1: Trending of Medical Ceramics Market (2014, 2017 and 2022) by Ceramic Type .............................................. 1 Chart 2: Trending of Medical Ceramics Market (2014, 2017 and 2022) by Application.................................................. 2 Chart 3: Trending of Medical Ceramics Market (2014, 2017 and 2022) by Geographic Region...................................... 3 1.1 Product Outline.................................................... 4 1.1.1 An Overview of Medical Ceramics .................... 4 Table 1: Some of the Important Clinical Applications of Bioceramics...................................................................... 5 1.1.2 Classification of Medical Ceramics.................... 5 Table 2: Types of Bioceramic-Tissue interactions ............. 5 1.1.2.1 Bioactive Ceramics......................................... 6 Table 3: Bioactive Ceramic Mechanical Properties in Comparison to Natural Bone and AW-GC......................... 6 1.1.2.2 Bioinert Ceramics........................................... 8 Table 4: A Comparison of Mechanical Properties of PSZs with New Alumina Ceramic (Grain size < 2 μm)................ 9 1.1.2.3 Bioresorbable Ceramics ............................... 11 Table 5: Some of Important Biomedical Applications of Bioceramics.....................................................................14 2. MEDICAL CERAMICS APPLICATION – A MARKET SNAPSHOT............................................................15 2.1 Dental Implants ................................................. 15 Chart 4: Global Trending (2017-2022) of Medical Ceramic Applications in Dental Implants.......................................15 2.1.1 Ceramics as Dental Implant Coatings.............. 15 Table 6: Ceramic Coatings in Various Forms of Dental Implants and their Chemical Composition.......................15 2.1.2 Ceramics as Dental Implant Materials ............ 16 2.2 Implantable Electronic Devices.......................... 19 Chart 5: Global Trending (2017-2022) of Medical Ceramic Applications in Implantable Electronic Devices ...............19 2.3 Orthopedic Implants.......................................... 21 Chart 6: Global Trending (2017-2022) of Medical Ceramic Applications in Orthopedic Implants ...............................21 2.3.1 First Generation Ceramics............................... 21 2.3.2 Second Generation Ceramics.......................... 22 2.4 Surgical & Diagnostic Instruments ..................... 24 Chart 7: Global Trending (2017-2022) of Medical Ceramic Applications in Surgical & Diagnostic Instruments...........24 2.5 Other Applications............................................. 26 Chart 8: Global Trending (2017-2022) of Medical Ceramics in Other Applications.......................................................26 3. KEY MARKET TRENDS........................................27 3.1 Medical Ceramics Market: Buffeted by Challenges, Buoyed by Opportunities......................................... 27 3.2 3D Printed Assisting in Developing Bioceramic Implants for Repairing Bones................................... 29 3.3 Hip Joint Replacements Augmented with Ceramic Materials.................................................................. 30 3.4 Titanium Loses the Dental Implants Race to Zirconia.................................................................... 32 3.5 Innovative Biomaterials for Orthopedic Implants....33 4. KEY GLOBAL PLAYERS........................................35 Advanced Industrial Ceramics (United States).................35 Apc International, Ltd. (United States) ............................36 Avx Corporation (United States)......................................37 Barat Ceramics GmbH (Germany)....................................38 Berkeley Advanced Biomaterials, Inc. (United States) .....39 Ceramtec GmbH (Germany) ...........................................40 Ceraroot S.L (Spain).........................................................41 Coorstek, Inc. (United States)..........................................42 Coorstek Medical Llc (United States)...............................43 Dentsply Sirona (United States).......................................44 Depuy Synthes, Inc. (United States).................................45 Doxa Ab (Sweden)...........................................................45 Exxelia Temex (France)....................................................46 Ferro-Ceramic Grinding, Inc. (United States)...................46 Friatec Aktiengesellschaft (Germany) .............................47 Institut Straumann Ag (Switzerland) ...............................47 International Ceramic Engineering (United States) .........48 Ivoclar Vivadent Ag (Liechtenstein).................................49 Johanson Dielectrics, Inc. (United States) .......................50 Kemet Corporation (United States).................................52 Kuraray Co., Ltd. (Japan) .................................................53 Kyocera Corporation (Japan)...........................................54 Lucideon Limited (United Kingdom)................................56 Metoxit Ag (Switzerland) ................................................57 Micro Ceramics Limited (Israel).......................................57 Morgan Advanced Materials Plc (United Kingdom).........58 Murata Manufacturing Company, Ltd. (Japan)................59 Ngk Spark Plug Co., Ltd. (Japan)......................................60 Noritake Co., Limited (Japan)..........................................61 Physik Instrumente (Pi) GmbH & Co., Kg. (Germany) ......63 Piezo Kinetics, Inc. (United States)..................................64 Precision Ferrites & Ceramics (United States).................65 Refractron Technologies Corporation (United States).....66 Saint-Gobain Ceramics & Plastics, Inc. (United States)....66 Sct Société Des Céramiques Techniques (France) ...........67 Skyortho Dental Supplies Medical Co., Ltd. (China).........67 Small Precision Tools, Inc. (United States) ......................68 Stryker Corporation (United States)................................68 Superior Technical Ceramics Corporation (United States).. 69 T.Q. Abrasive Machining Company (United States).........70 Trs Technologies, Inc. (United States) .............................70 Vishay Intertechnology, Inc. (United States) ...................71 Vita Zahnfabrik H. Rauter GmbH & Co., Kg (Germany)....71 Zimmer Biomet Holdings, Inc. (United States) ................72 5. KEY BUSINESS TRENDS ......................................73 CoorsTek Medical Wins Ceramic Hip Implant Lawsuit in US..73 Collagen Solutions Plc receives Medical Research Scotland PhD Studentship project .................................................73 3DCeram Unveils Ceramaker 100, a 3D ceramic printing system ............................................................................74 Amedica Reveals positive findings data Re-files FDA Submission......................................................................74 Kyocera Medical Bags FDA 510(k) clearance for Initia Total Hip System......................................................................74 AVX Corporation Introduces MM Series multilayer ceramic capacitors .......................................................................75 Straumann and Maxon Motor Enter in to Partnership....75 3M Company grants Dental Ceramics Coloring Technology License to Dental Direkt GmbH.......................................75 CoorsTek Establishes New center in Colorado ................76 Murata develops new monolithic ceramic capacitors for implanted medical devices..............................................76 CoorsTek Medical strengthens its Medical-Grade ceramic production capacity .......................................................76 CoorsTek to Acquire Covalent.........................................77 Zimmer Launches Vivacit-E® Vitamin E highly crosslinked polyethylene (HXPE) hip replacement solution...............77 6. GLOBAL MARKET OVERVIEW.............................78 Chart 9: Global Medical Ceramics Market Analysis (2014- 2022) in USD Million .......................................................78 6.1 Global Medical Ceramics Market Overview by Ceramic Type........................................................... 79 Chart 10: Global Medical Ceramics Market Analysis (2014- 2022) by Ceramic Type – Bioactive Ceramics, Bioinert Ceramics and Bioresorbable Ceramics in USD Million.....79 Chart 11: Glance at 2014, 2017 and 2022 Global Medical Ceramics Market Share (%) by Ceramic Type – Bioactive Ceramics, Bioinert Ceramics and Bioresorbable Ceramics . 80 6.1.1 Medical Ceramic Types Market Overview by Global Region .......................................................... 81 6.1.1.1 Bioactive Ceramics....................................... 81 Chart 12: Global Bioactive Ceramics Market Analysis (2014- 2022) by Geographic Region – North America, Europe, Asia- Pacific, Latin America and Rest of World in USD Million .... 81 Chart13:Glanceat2014,2017and2022GlobalBioactive CeramicsMarketShare(%)byGeographicRegion–North America,Europe,Asia-Pacific,LatinAmericaandRestofWorld82 6.1.1.2 Bioinert Ceramics......................................... 83 Chart 14: Global Bioinert Ceramics Market Analysis (2014- 2022) by Geographic Region – North America, Europe, Asia- Pacific, Latin America and Rest of World in USD Million .... 83 Chart 15: Glance at 2014, 2017 and 2022 Global Bioinert Ceramics Market Share (%) by Geographic Region – North America, Europe, Asia-Pacific, Latin America and Rest of World ............................................................................. 84 6.1.1.3 Bioresorbable Ceramics ............................... 85 Chart 16: Global Bioresorbable Ceramics Market Analysis (2014-2022) by Geographic Region – North America, Europe, Asia-Pacific, Latin America and Rest of World in USD Million..................................................................... 85 Chart 17: Glance at 2014, 2017 and 2022 Global Bioresorbable Ceramics Market Share (%) by Geographic Region – North America, Europe, Asia-Pacific, Latin America and Rest of World............................................. 86 6.2 Global Medical Ceramics Market Overview by Application .............................................................. 87 Chart 18: Global Medical Ceramics Market Analysis (2014- 2022) by Application – Dental Implants, Implantable Electronic Devices, Orthopedic Implants, Surgical & Diagnostic Instruments and Other Applications in USD Million...............87 Chart 19: Glance at 2014, 2017 and 2022 Global Medical Ceramics Market Share (%) by Application – Dental Implants, Implantable Electronic Devices, Orthopedic Implants, Surgical & Diagnostic Instruments and Other Applications .................88 6.2.1 Medical Ceramics Applications Market Overview by Global Region...................................................... 89 6.2.1.1 Dental Implants ........................................... 89 Chart 20: Global Medical Ceramics Market Analysis (2014- 2022) in Dental Implants by Geographic Region – North America, Europe, Asia-Pacific, Latin America and Rest of World in USD Million...................................................... 89 Chart 21: Glance at 2014, 2017 and 2022 Global Medical Ceramics Market Share (%) in Dental Implants by Geographic Region – North America, Europe, Asia-Pacific, Latin America and Rest of World.................................... 90 6.2.1.2 Implantable Electronic Devices.................... 91 Chart 22: Global Medical Ceramics Market Analysis (2014- 2022) in Implantable Electronic Devices by Geographic Region – North America, Europe, Asia-Pacific, Latin America and Rest of World in USD Million ..................... 91 Chart 23: Glance at 2014, 2017 and 2022 Global Medical Ceramics Market Share (%) in Implantable Electronic Devices by Geographic Region – North America, Europe, Asia-Pacific, Latin America and Rest of World ................ 92 6.2.1.3 Orthopedic Implants.................................... 93 Chart 24: Global Medical Ceramics Market Analysis (2014- 2022) in Orthopedic Implants by Geographic Region – North America, Europe, Asia-Pacific, Latin America and Rest of World in USD Million .......................................... 93 Chart 25: Glance at 2014, 2017 and 2022 Global Medical Ceramics Market Share (%) in Orthopedic Implants by Geographic Region – North America, Europe, Asia-Pacific, Latin America and Rest of World.................................... 94 6.2.1.4 Surgical & Diagnostic Instruments ............... 95 Chart 26: Global Medical Ceramics Market Analysis (2014- 2022) in Surgical & Diagnostic Instruments by Geographic Region – North America, Europe, Asia-Pacific, Latin America and Rest of World in USD Million ..................... 95 Chart 27: Glance at 2014, 2017 and 2022 Global Medical Ceramics Market Share (%) in Surgical & Diagnostic Instruments by Geographic Region – North America, Europe, Asia-Pacific, Latin America and Rest of World ... 96 6.2.1.5 Other Applications....................................... 97 Chart 28: Global Medical Ceramics Market Analysis (2014- 2022) in Other Applications by Geographic Region – North America, Europe, Asia-Pacific, Latin America and Rest of World in USD Million...................................................... 97 Chart 29: Glance at 2014, 2017 and 2022 Global Medical Ceramics Market Share (%) in Other Applications by Geographic Region – North America, Europe, Asia-Pacific, Latin America and Rest of World.................................... 98
  • 4. Page 4 Medical Ceramics – A Global Market Overview February 2017 |312 Pages | 193 Charts | Price $4050 Click here to buy the report PART B: REGIONAL MARKET PERSPECTIVE... 99 Chart 30: Fastest Growing Major Markets for Medical Ceramics (2017-2022) in %CAGRs....................................99 Chart 31: Global Medical Ceramics Market Analysis (2014- 2022) by Geographic Region – North America, Europe, Asia- Pacific, Latin America and Rest of World in USD Million .. 100 Chart 32: Glance at 2014, 2017 and 2022 Global Medical Ceramics Market Share (%) by Geographic Region – North America, Europe, Asia-Pacific, Latin America and Rest of World ............................................................................100 REGIONAL MARKET OVERVIEW...........................101 1. NORTH AMERICA ............................................101 Chart 33: North American Medical Ceramics Market Analysis (2014-2022) in USD Million..............................101 1.1 North American Medical Ceramics Market Overview by Geographic Region............................ 102 Chart 34: North American Medical Ceramics Market Analysis (2014-2022) by Geographic Region – United States and Canada in USD Million..................................102 Chart 35: Glance at 2014, 2017 and 2022 North American Medical Ceramics Market Share (%) by Geographic Region – United States and Canada ..........................................103 1.2 North American Medical Ceramics Market Overview by Ceramic Type .................................... 104 Chart 36: North American Medical Ceramics Market Analysis (2014-2022) by Ceramic Type – Bioactive Ceramics, Bioinert Ceramics and Bioresorbable Ceramics in USD Million...... 104 Chart 37: Glance at 2014, 2017 and 2022 North American Medical Ceramics Market Share (%) by Ceramic Type – Bioactive Ceramics, Bioinert Ceramics and Bioresorbable Ceramics........................................................................105 1.2.1 Medical Ceramic Types Market Overview by North American Region ......................................... 106 1.2.1.1 Bioactive Ceramics..................................... 106 Chart 38: North American Bioactive Ceramics Market Analysis (2014-2022) by Geographic Region – United States and Canada in USD Million..................................106 Chart 39: Glance at 2014, 2017 and 2022 North American Bioactive Ceramics Market Share (%) by Geographic Region – United States and Canada...............................107 1.2.1.2 Bioinert Ceramics....................................... 108 Chart 40: North American Bioinert Ceramics Market Analysis (2014-2022) by Geographic Region – United States and Canada in USD Million..................................108 Chart 41: Glance at 2014, 2017 and 2022 North American Bioinert Ceramics Market Share (%) by Geographic Region – United States and Canada ..........................................109 1.2.1.3 Bioresorbable Ceramics ............................. 110 Chart 42: North American Bioresorbable Ceramics Market Analysis (2014-2022) by Geographic Region – United States and Canada in USD Million..................................110 Chart 43: Glance at 2014, 2017 and 2022 North American Bioresorbable Ceramics Market Share (%) by Geographic Region – United States and Canada...............................111 1.3 North American Medical Ceramics Market Overview by Application........................................ 112 Chart 44: North American Medical Ceramics Market Analysis (2014-2022) by Application – Dental Implants, Implantable Electronic Devices, Orthopedic Implants, Surgical & Diagnostic Instruments and Other Applications in USD Million................................................................112 Chart 45: Glance at 2014, 2017 and 2022 North American Medical Ceramics Market Share (%) by Application – Dental Implants, Implantable Electronic Devices, Orthopedic Implants, Surgical & Diagnostic Instruments and Other Applications..................................................113 1.3.1 Medical Ceramics Applications Market Overview by North American Region..................................... 114 1.3.1.1 Dental Implants.......................................... 114 Chart 46: North American Medical Ceramics Market Analysis (2014-2022) in Dental Implants by Geographic Region – United States and Canada in USD Million .......114 Chart 47: Glance at 2014, 2017 and 2022 North American Medical Ceramics Market Share (%) in Dental Implants by Geographic Region – United States and Canada............115 1.3.1.2 Implantable Electronic Devices.................. 116 Chart 48: North American Medical Ceramics Market Analysis (2014-2022) in Implantable Electronic Devices by Geographic Region – United States and Canada in USD Million..............116 Chart 49: Glance at 2014, 2017 and 2022 North American Medical Ceramics Market Share (%) in Dental Implants by Geographic Region – United States and Canada ...........117 1.3.1.3 Orthopedic Implants.................................. 118 Chart 50: North American Medical Ceramics Market Analysis (2014-2022) in Orthopedic Implants by Geographic Region – United States and Canada in USD Million ......................... 118 Chart 51: Glance at 2014, 2017 and 2022 North American Medical Ceramics Market Share (%) in Orthopedic Implants by Geographic Region – United States and Canada.......... 119 1.3.1.4 Surgical & Diagnostic Instruments ............. 120 Chart 52: North American Medical Ceramics Market Analysis (2014-2022) in Surgical & Diagnostic Instruments by Geographic Region – United States and Canada in USD Million........................................................................... 120 Chart 53: Glance at 2014, 2017 and 2022 North American Medical Ceramics Market Share (%) in Surgical & Diagnostic Instruments by Geographic Region – United States and Canada ............................................................................... 121 1.3.1.5 Other Applications..................................... 122 Chart 54: North American Medical Ceramics Market Analysis (2014-2022) in Other Applications by Geographic Region – United States and Canada in USD Million.......122 Chart 55: Glance at 2014, 2017 and 2022 North American Medical Ceramics Market Share (%) in Other Applications by Geographic Region – United States and Canada.......123 1.4 Major Market Players ...................................... 124 Advanced Industrial Ceramics (United States) ..............124 Apc International, Ltd. (United States)..........................125 Avx Corporation (United States) ...................................126 Berkeley Advanced Biomaterials, Inc. (United States)...127 Coorstek, Inc. (United States)........................................128 Coorstek Medical Llc (United States) ............................129 Dentsply Sirona (United States) ....................................130 Depuy Synthes, Inc. (United States) ..............................131 Ferro-Ceramic Grinding, Inc. (United States).................132 International Ceramic Engineering (United States) .......132 Johanson Dielectrics, Inc. (United States) .....................133 Advanced Monolythic Ceramics, Inc. (United States)....134 Kemet Corporation (United States)...............................135 Piezo Kinetics, Inc. (United States)................................135 Precision Ferrites & Ceramics (United States)...............136 Refractron Technologies Corporation (United States)...136 Saint-Gobain Ceramics & Plastics, Inc. (United States)..137 Small Precision Tools, Inc. (United States) ....................137 Stryker Corporation (United States)..............................138 Superior Technical Ceramics Corporation (United States)....139 T.Q. Abrasive Machining Company (United States).......140 TRS Technologies, Inc. (United States) ..........................140 Vishay Intertechnology, Inc. (United States) .................141 Zimmer Biomet Holdings, Inc. (United States) ..............141 1.5 Country-wise Analysis of North American Medical Ceramics Market.................................................... 142 1.5.1 The United States.......................................142 1.5.1.1 United States Medical Ceramics Market Overview by Ceramic Type .................................... 142 Chart 56: United States Medical Ceramics Market Analysis (2014-2022) by Ceramic Type – Bioactive Ceramics, Bioinert Ceramics and Bioresorbable Ceramics in USD Million...... 142 Chart 57: Glance at 2014, 2017 and 2022 United States Medical Ceramics Market Share (%) by Ceramic Type – Bioactive Ceramics, Bioinert Ceramics and Bioresorbable Ceramics........143 1.5.1.2 United States Medical Ceramics Market Overview by Application........................................ 144 Chart 58: United States Medical Ceramics Market Analysis (2014-2022) by Application – Dental Implants, Implantable Electronic Devices, Orthopedic Implants, Surgical & Diagnostic Instruments and Other Applications in USD Million .............144 Chart 59: Glance at 2014, 2017 and 2022 United States Medical Ceramics Market Share (%) by Application – Dental Implants, Implantable Electronic Devices, Orthopedic Implants, Surgical & Diagnostic Instruments and Other Applications .................................................145 1.5.2 Canada.......................................................146 1.5.2.1 Canadian Medical Ceramics Market Overview by Ceramic Type .................................................... 146 Chart 60: Canadian Medical Ceramics Market Analysis (2014- 2022) by Ceramic Type – Bioactive Ceramics, Bioinert Ceramics and Bioresorbable Ceramics in USD Million...... 146 Chart 61: Glance at 2014, 2017 and 2022 Canadian Medical Ceramics Market Share (%) by Ceramic Type – Bioactive Ceramics, Bioinert Ceramics and Bioresorbable Ceramics ... 147 1.5.2.2 Canadian Medical Ceramics Market Overview by Application........................................................ 148 Chart 62: Canadian Medical Ceramics Market Analysis (2014- 2022) by Application – Dental Implants, Implantable Electronic Devices, Orthopedic Implants, Surgical & Diagnostic Instruments and Other Applications in USD Million ............. 148 Chart 63: Glance at 2014, 2017 and 2022 Canadian Medical Ceramics Market Share (%) by Application – Dental Implants, Implantable Electronic Devices, Orthopedic Implants, Surgical & Diagnostic Instruments and Other Applications................................................. 149 2. EUROPE ..........................................................150 Chart 64: European Medical Ceramics Market Analysis (2014-2022) in USD Million........................................... 150 2.1 European Medical Ceramics Market Overview by Geographic Region ................................................ 151 Chart 65: European Medical Ceramics Market Analysis (2014-2022) by Geographic Region – France, Germany, Italy, United Kingdom and Rest of Europe in USD Million......... 151 Chart 66: Glance at 2014, 2017 and 2022 European Medical Ceramics Market Share (%) by Geographic Region – France, Germany, Italy, United Kingdom and Rest of Europe ....... 152 2.2 European Medical Ceramics Market Overview by Ceramic Type......................................................... 153 Chart 67: European Medical Ceramics Market Analysis (2014-2022) by Ceramic Type – Bioactive Ceramics, Bioinert Ceramics and Bioresorbable Ceramics in USD Million...... 153 Chart 68: Glance at 2014, 2017 and 2022 European Medical Ceramics Market Share (%) by Ceramic Type – Bioactive Ceramics, Bioinert Ceramics and Bioresorbable Ceramics....................................................................... 154 2.2.1 Medical Ceramic Types Market Overview by European Region ................................................... 155 2.2.1.1 Bioactive Ceramics..................................... 155 Chart 69: European Bioactive Ceramics Market Analysis (2014-2022) by Geographic Region – France, Germany, Italy, United Kingdom and Rest of Europe in USD Million......... 155 Chart 70: Glance at 2014, 2017 and 2022 European Bioactive Ceramics Market Share (%) by Geographic Region – France, Germany, Italy, United Kingdom and Rest of Europe ....... 156 2.2.1.2 Bioinert Ceramics....................................... 157 Chart 71: European Bioinert Ceramics Market Analysis (2014-2022) by Geographic Region – France, Germany, Italy, United Kingdom and Rest of Europe in USD Million......... 157 Chart 72: Glance at 2014, 2017 and 2022 European Bioinert Ceramics Market Share (%) by Geographic Region – France, Germany, Italy, United Kingdom and Rest of Europe ....... 158 2.2.1.3 Bioresorbable Ceramics ............................. 159 Chart 73: European Bioresorbable Ceramics Market Analysis (2014-2022) by Geographic Region – France, Germany, Italy, United Kingdom and Rest of Europe in USD Million................................................................... 159 Chart 74: Glance at 2014, 2017 and 2022 European Bioresorbable Ceramics Market Share (%) by Geographic Region – France, Germany, Italy, United Kingdom and Rest of Europe...................................................................... 160 2.3 European Medical Ceramics Market Overview by Application ............................................................ 161 Chart 75: European Medical Ceramics Market Analysis (2014- 2022) by Application – Dental Implants, Implantable Electronic Devices, Orthopedic Implants, Surgical & Diagnostic Instruments and Other Applications in USD Million ............. 161 Chart 76: Glance at 2014, 2017 and 2022 European Medical Ceramics Market Share (%) by Application – Dental Implants, Implantable Electronic Devices, Orthopedic Implants, Surgical & Diagnostic Instruments and Other Applications................................................. 162
  • 5. Page 5 Medical Ceramics – A Global Market Overview February 2017 |312 Pages | 193 Charts | Price $4050 Click here to buy the report 2.3.1 Medical Ceramics Applications Market Overview by European Region............................................... 163 2.3.1.1 Dental Implants.......................................... 163 Chart 77: European Medical Ceramics Market Analysis (2014-2022) in Dental Implants by Geographic Region – France, Germany, Italy, United Kingdom and Rest of Europe in USD Million ...................................................163 Chart 78: Glance at 2014, 2017 and 2022 European Medical Ceramics Market Share (%) in Dental Implants by Geographic Region – France, Germany, Italy, United Kingdom and Rest of Europe .........................................164 2.3.1.2 Implantable Electronic Devices.................. 165 Chart 79: European Medical Ceramics Market Analysis (2014-2022) in Implantable Electronic Devices by Geographic Region – France, Germany, Italy, United Kingdom and Rest of Europe in USD Million..................165 Chart 80: Glance at 2014, 2017 and 2022 European Medical Ceramics Market Share (%) in Implantable Electronic Devices by Geographic Region – France, Germany, Italy, United Kingdom and Rest of Europe.....166 2.3.1.3 Orthopedic Implants.................................. 167 Chart 81: European Medical Ceramics Market Analysis (2014-2022) in Orthopedic Implants by Geographic Region – France, Germany, Italy, United Kingdom and Rest of Europe in USD Million ...................................................167 Chart 82: Glance at 2014, 2017 and 2022 European Medical Ceramics Market Share (%) in Orthopedic Implants by Geographic Region – France, Germany, Italy, United Kingdom and Rest of Europe..............................168 2.3.1.4 Surgical & Diagnostic Instruments ............. 169 Chart 83: European Medical Ceramics Market Analysis (2014-2022) in Surgical & Diagnostic Instruments by Geographic Region – France, Germany, Italy, United Kingdom and Rest of Europe in USD Million..................169 Chart 84: Glance at 2014, 2017 and 2022 European Medical Ceramics Market Share (%) in Surgical & Diagnostic Instruments by Geographic Region – France, Germany, Italy, United Kingdom and Rest of Europe.....170 2.3.1.5 Other Applications..................................... 171 Chart 85: European Medical Ceramics Market Analysis (2014-2022) in Other Applications by Geographic Region – France, Germany, Italy, United Kingdom and Rest of Europe in USD Million ...................................................171 Chart 86: Glance at 2014, 2017 and 2022 European Medical Ceramics Market Share (%) in Other Applications by Geographic Region – France, Germany, Italy, United Kingdom and Rest of Europe .........................................172 2.4 Major Market Players ...................................... 173 Barat Ceramics GmbH (Germany)..................................173 Bce Special Ceramics GmbH (Germany) ........................174 Ceramtec GmbH (Germany) .........................................175 Ceraroot S.L (Spain).......................................................176 Coorstek Advanced Materials Crewe Limited (UK) ........176 Dental Direkt GmbH (Germany) ....................................177 Doxa Ab (Sweden).........................................................177 Exxelia Temex (France)..................................................178 Friatec Aktiengesellschaft (Germany)............................178 Hybrid Laser Tech Ltd (United Kingdom) .......................179 Innovnano - Materiais Avançados, S.A (Portugal)..........179 Institut Straumann Ag (Switzerland)..............................180 Ivoclar Vivadent Ag (Liechtenstein) ...............................181 Jri Orthopaedics (United Kingdom)................................182 Lucideon Limited (United Kingdom) ..............................183 Metoxit Ag (Switzerland)...............................................184 Moje Keramik-Implantate GmbH & Co., Kg. (Germany).185 Morgan Advanced Materials Plc (United Kingdom).......186 Morgan Technical Ceramics (United Kingdom)..............187 Morgan Electro Ceramics Ltd (United Kingdom)............187 Nobel Biocare Services Ag (Switzerland)........................188 Physik Instrumente (Pi) GmbH & Co., Kg. (Germany).....188 Sct Société Des Céramiques Techniques (France)..........189 Sembach GmbH & Co., Kg (Germnay)............................189 Vita Zahnfabrik H. Rauter GmbH & Co., Kg (Germany) ..190 2.5 Country-wise Analysis of European Medical Ceramics Market.................................................... 191 2.5.1 France........................................................191 2.5.1.1 French Medical Ceramics Market Overview by Ceramic Type......................................................... 191 Chart 87: French Medical Ceramics Market Analysis (2014- 2022) by Ceramic Type – Bioactive Ceramics, Bioinert Ceramics and Bioresorbable Ceramics in USD Million...191 Chart 88: Glance at 2014, 2017 and 2022 French Medical Ceramics Market Share (%) by Ceramic Type – Bioactive Ceramics, Bioinert Ceramics and Bioresorbable Ceramics...192 2.5.1.2 French Medical Ceramics Market Overview by Application............................................................. 193 Chart 89: French Medical Ceramics Market Analysis (2014- 2022) by Application – Dental Implants, Implantable Electronic Devices, Orthopedic Implants, Surgical & Diagnostic Instruments and Other Applications in USD Million .............193 Chart 90: Glance at 2014, 2017 and 2022 French Medical Ceramics Market Share (%) by Application – Dental Implants, Implantable Electronic Devices, Orthopedic Implants, Surgical & Diagnostic Instruments and Other Applications .................................................................. 194 2.5.2 Germany....................................................195 2.5.2.1 German Medical Ceramics Market Overview by Ceramic Type .................................................... 195 Chart 91: German Medical Ceramics Market Analysis (2014- 2022) by Ceramic Type – Bioactive Ceramics, Bioinert Ceramics and Bioresorbable Ceramics in USD Million...... 195 Chart 92: Glance at 2014, 2017 and 2022 German Medical Ceramics Market Share (%) by Ceramic Type – Bioactive Ceramics, Bioinert Ceramics and Bioresorbable Ceramics...196 2.5.2.2 German Medical Ceramics Market Overview by Application........................................................ 197 Chart 93: German Medical Ceramics Market Analysis (2014-2022) by Application – Dental Implants, Implantable Electronic Devices, Orthopedic Implants, Surgical & Diagnostic Instruments and Other Applications in USD Million........................................................................... 197 Chart 94: Glance at 2014, 2017 and 2022 German Medical Ceramics Market Share (%) by Application – Dental Implants, Implantable Electronic Devices, Orthopedic Implants, Surgical & Diagnostic Instruments and Other Applications .................................................................. 198 2.5.3 Italy ...........................................................199 2.5.3.1 Italian Medical Ceramics Market Overview by Ceramic Type......................................................... 199 Chart 95: Italian Medical Ceramics Market Analysis (2014- 2022) by Ceramic Type – Bioactive Ceramics, Bioinert Ceramics and Bioresorbable Ceramics in USD Million...199 Chart 96: Glance at 2014, 2017 and 2022 Italian Medical Ceramics Market Share (%) by Ceramic Type – Bioactive Ceramics, Bioinert Ceramics and Bioresorbable Ceramics...200 2.5.3.2 Italian Medical Ceramics Market Overview by Application............................................................. 201 Chart 97: Italian Medical Ceramics Market Analysis (2014- 2022) by Application – Dental Implants, Implantable Electronic Devices, Orthopedic Implants, Surgical & Diagnostic Instruments and Other Applications in USD Million .............201 Chart 98: Glance at 2014, 2017 and 2022 Italian Medical Ceramics Market Share (%) by Application – Dental Implants, Implantable Electronic Devices, Orthopedic Implants, Surgical & Diagnostic Instruments and Other Applications .................................................................. 202 2.5.4 The United Kingdom...................................203 2.5.4.1 United Kingdom Medical Ceramics Market Overview by Ceramic Type .................................... 203 Chart 99: United Kingdom Medical Ceramics Market Analysis (2014-2022) by Ceramic Type – Bioactive Ceramics, Bioinert Ceramics and Bioresorbable Ceramics in USD Million ...............................................................203 Chart 100: Glance at 2014, 2017 and 2022 United Kingdom Medical Ceramics Market Share (%) by Ceramic Type – Bioactive Ceramics, Bioinert Ceramics and Bioresorbable Ceramics ....................................................................... 204 2.5.4.2 United Kingdom Medical Ceramics Market Overview by Application........................................ 205 Chart 101: United Kingdom Medical Ceramics Market Analysis (2014-2022) by Application – Dental Implants, Implantable Electronic Devices, Orthopedic Implants, Surgical & Diagnostic Instruments and Other Applications in USD Million ...............................................................205 Chart 102: Glance at 2014, 2017 and 2022 United Kingdom Medical Ceramics Market Share (%) by Application – Dental Implants, Implantable Electronic Devices, Orthopedic Implants, Surgical & Diagnostic Instruments and Other Applications................................................. 206 2.5.5 Rest of Europe............................................207 2.5.5.1 Rest of Europe Medical Ceramics Market Overview by Ceramic Type .................................... 207 Chart 103: Rest of Europe Medical Ceramics Market Analysis (2014-2022) by Ceramic Type – Bioactive Ceramics, Bioinert Ceramics and Bioresorbable Ceramics in USD Million .......... 207 Chart 104: Glance at 2014, 2017 and 2022 Rest of Europe Medical Ceramics Market Share (%) by Ceramic Type – Bioactive Ceramics, Bioinert Ceramics and Bioresorbable Ceramics................................................................................. 208 2.5.5.2 Rest of Europe Medical Ceramics Market Overview by Application........................................ 209 Chart 105: Rest of Europe Medical Ceramics Market Analysis (2014-2022) by Application – Dental Implants, Implantable Electronic Devices, Orthopedic Implants, Surgical & Diagnostic Instruments and Other Applications in USD Million ............. 209 Chart 106: Glance at 2014, 2017 and 2022 Rest of Europe Medical Ceramics Market Share (%) by Application – Dental Implants, Implantable Electronic Devices, Orthopedic Implants, Surgical & Diagnostic Instruments and Other Applications .. 210 3. ASIA-PACIFIC...................................................211 Chart 107: Asia-Pacific Medical Ceramics Market Analysis (2014-2022) in USD Million........................................... 211 3.1 Asia-Pacific Medical Ceramics Market Overview by Geographic Region............................................ 212 Chart 108: Asia-Pacific Medical Ceramics Market Analysis (2014-2022) by Geographic Region – China, India, Japan, South Korea and Rest of Asia-Pacific in USD Million..... 212 Chart 109: Glance at 2014, 2017 and 2022 Asia-Pacific Medical Ceramics Market Share (%) by Geographic Region – China, India, Japan, South Korea and Rest of Asia-Pacific................213 3.2 Asia-Pacific Medical Ceramics Market Overview by Ceramic Type .................................................... 214 Chart 110: Asia-Pacific Medical Ceramics Market Analysis (2014-2022) by Ceramic Type – Bioactive Ceramics, Bioinert Ceramics and Bioresorbable Ceramics in USD Million...... 214 Chart 111: Glance at 2014, 2017 and 2022 Asia-Pacific Medical Ceramics Market Share (%) by Ceramic Type – Bioactive Ceramics, Bioinert Ceramics and Bioresorbable Ceramics ... 215 3.2.1 Medical Ceramic Types Market Overview by Asia-Pacific Region................................................. 216 3.2.1.1 Bioactive Ceramics..................................... 216 Chart 112: Asia-Pacific Bioactive Ceramics Market Analysis (2014-2022) by Geographic Region – China, India, Japan, South Korea and Rest of Asia-Pacific in USD Million..... 216 Chart 113: Glance at 2014, 2017 and 2022 Asia-Pacific Bioactive Ceramics Market Share (%) by Geographic Region – China, India, Japan, South Korea and Rest of Asia-Pacific..... 217 3.2.1.2 Bioinert Ceramics....................................... 218 Chart 114: Asia-Pacific Bioinert Ceramics Market Analysis (2014-2022) by Geographic Region – China, India, Japan, South Korea and Rest of Asia-Pacific in USD Million..... 218 Chart 115: Glance at 2014, 2017 and 2022 Asia-Pacific Bioinert Ceramics Market Share (%) by Geographic Region – China, India, Japan, South Korea and Rest of Asia-Pacific................219 3.2.1.3 Bioresorbable Ceramics ............................. 220 Chart 116: Asia-Pacific Bioresorbable Ceramics Market Analysis (2014-2022) by Geographic Region – China, India, Japan, South Korea and Rest of Asia-Pacific in USD Million .......................220 Chart117:Glanceat2014,2017and2022Asia-Pacific BioresorbableCeramicsMarketShare(%)byGeographicRegion –China,India,Japan,SouthKoreaandRestofAsia-Pacific.......221 3.3 Asia-Pacific Medical Ceramics Market Overview by Application........................................................ 222 Chart 118: Asia-Pacific Medical Ceramics Market Analysis (2014-2022) by Application – Dental Implants, Implantable Electronic Devices, Orthopedic Implants, Surgical & Diagnostic Instruments and Other Applications in USD Million.............222 Chart 119: Glance at 2014, 2017 and 2022 Asia-Pacific Medical Ceramics Market Share (%) by Application – Dental Implants, Implantable Electronic Devices, Orthopedic Implants, Surgical & Diagnostic Instruments and Other Applications................ 223
  • 6. Page 6 Medical Ceramics – A Global Market Overview February 2017 |312 Pages | 193 Charts | Price $4050 Click here to buy the report 3.3.1 Medical Ceramics Applications Market Overview by Asia-Pacific Region............................................ 224 3.3.1.1 Dental Implants.......................................... 224 Chart 120: Asia-Pacific Medical Ceramics Market Analysis (2014- 2022) in Dental Implants by Geographic Region – China, India, Japan, South Korea and Rest of Asia-Pacific in USD Million.......224 Chart 121: Glance at 2014, 2017 and 2022 Asia-Pacific Medical Ceramics Market Share (%) in Dental Implants by Geographic Region – China, India, Japan, South Korea and Rest of Asia-Pacific ........................................................225 3.3.1.2 Implantable Electronic Devices.................. 226 Chart 122: Asia-Pacific Medical Ceramics Market Analysis (2014-2022) in Implantable Electronic Devices by Geographic Region – China, India, Japan, South Korea and Rest of Asia-Pacific in USD Million.................................226 Chart 123: Glance at 2014, 2017 and 2022 Asia-Pacific Medical Ceramics Market Share (%) in Implantable Electronic Devices by Geographic Region – China, India, Japan, South Korea and Rest of Asia-Pacific ..................227 3.3.1.3 Orthopedic Implants.................................. 228 Chart 124: Asia-Pacific Medical Ceramics Market Analysis (2014-2022) in Orthopedic Implants by Geographic Region – China, India, Japan, South Korea and Rest of Asia-Pacific in USD Million................................................................228 Chart 125: Glance at 2014, 2017 and 2022 Asia-Pacific Medical Ceramics Market Share (%) in Orthopedic Implants by Geographic Region – China, India, Japan, South Korea and Rest of Asia-Pacific .............................229 3.3.1.4 Surgical & Diagnostic Instruments ............. 230 Chart 126: Asia-Pacific Medical Ceramics Market Analysis (2014-2022) in Surgical & Diagnostic Instruments by Geographic Region – China, India, Japan, South Korea and Rest of Asia-Pacific in USD Million.................................230 Chart 127: Glance at 2014, 2017 and 2022 Asia-Pacific Medical Ceramics Market Share (%) in Surgical & Diagnostic Instruments by Geographic Region – China, India, Japan, South Korea and Rest of Asia-Pacific.........231 3.3.1.5 Other Applications..................................... 232 Chart 128: Asia-Pacific Medical Ceramics Market Analysis (2014-2022) in Other Applications by Geographic Region – China, India, Japan, South Korea and Rest of Asia-Pacific in USD Million ...................................................................232 Chart 129: Glance at 2014, 2017 and 2022 Asia-Pacific Medical Ceramics Market Share (%) in Other Applications by Geographic Region – China, India, Japan, South Korea and Rest of Asia-Pacific .................................................233 3.4 Major Market Players ...................................... 234 Coorstek Kk (Japan).......................................................234 Kuraray Co., Ltd. (Japan)................................................234 Kyocera Corporation (Japan) .........................................235 Kyocera Medical Corporation (Japan)............................237 Murata Manufacturing Company, Ltd. (Japan)..............238 Ngk Spark Plug Co., Ltd. (Japan) ....................................238 Noritake Co., Limited (Japan) ........................................239 Skyortho Dental Supplies Medical Co., Ltd. (China) .......241 3.5 Country-wise Analysis of Asia-Pacific Medical Ceramics Market.................................................... 242 3.5.1 China .........................................................242 3.5.1.1 Chinese Medical Ceramics Market Overview by Ceramic Type .................................................... 242 Chart 130: Chinese Medical Ceramics Market Analysis (2014- 2022) by Ceramic Type – Bioactive Ceramics, Bioinert Ceramics and Bioresorbable Ceramics in USD Million...... 242 Chart 131: Glance at 2014, 2017 and 2022 Chinese Medical Ceramics Market Share (%) by Ceramic Type – Bioactive Ceramics, Bioinert Ceramics and Bioresorbable Ceramics ...243 3.5.1.2 Chinese Medical Ceramics Market Overview by Application........................................................ 244 Chart 132: Chinese Medical Ceramics Market Analysis (2014- 2022) by Application – Dental Implants, Implantable Electronic Devices, Orthopedic Implants, Surgical & Diagnostic Instruments and Other Applications in USD Million.............244 Chart 133: Glance at 2014, 2017 and 2022 Chinese Medical Ceramics Market Share (%) by Application – Dental Implants, Implantable Electronic Devices, Orthopedic Implants, Surgical & Diagnostic Instruments and Other Applications..................................................245 3.5.2 India ..........................................................246 3.5.2.1 Indian Medical Ceramics Market Overview by Ceramic Type......................................................... 246 Chart 134: Indian Medical Ceramics Market Analysis (2014-2022) by Ceramic Type – Bioactive Ceramics, Bioinert Ceramics and Bioresorbable Ceramics in USD Million........................................................................... 246 Chart 135: Glance at 2014, 2017 and 2022 Indian Medical Ceramics Market Share (%) by Ceramic Type – Bioactive Ceramics, Bioinert Ceramics and Bioresorbable Ceramics...247 3.5.2.2 Indian Medical Ceramics Market Overview by Application............................................................. 248 Chart 136: Indian Medical Ceramics Market Analysis (2014-2022) by Application – Dental Implants, Implantable Electronic Devices, Orthopedic Implants, Surgical & Diagnostic Instruments and Other Applications in USD Million........................................................................... 248 Chart 137: Glance at 2014, 2017 and 2022 Indian Medical Ceramics Market Share (%) by Application – Dental Implants, Implantable Electronic Devices, Orthopedic Implants, Surgical & Diagnostic Instruments and Other Applications .................................................................. 249 3.5.3 Japan .........................................................250 3.5.3.1 Japanese Medical Ceramics Market Overview by Ceramic Type .................................................... 250 Chart 138: Japanese Medical Ceramics Market Analysis (2014-2022) by Ceramic Type – Bioactive Ceramics, Bioinert Ceramics and Bioresorbable Ceramics in USD Million...... 250 Chart 139: Glance at 2014, 2017 and 2022 Japanese Medical Ceramics Market Share (%) by Ceramic Type – Bioactive Ceramics, Bioinert Ceramics and Bioresorbable Ceramics ....................................................................... 251 3.5.3.2 Japanese Medical Ceramics Market Overview by Application........................................................ 252 Chart 140: Japanese Medical Ceramics Market Analysis (2014- 2022) by Application – Dental Implants, Implantable Electronic Devices, Orthopedic Implants, Surgical & Diagnostic Instruments and Other Applications in USD Million.............252 Chart 141: Glance at 2014, 2017 and 2022 Japanese Medical Ceramics Market Share (%) by Application – Dental Implants, Implantable Electronic Devices, Orthopedic Implants, Surgical & Diagnostic Instruments and Other Applications .................................................253 3.5.4 South Korea ...............................................254 3.5.4.1 South Korean Medical Ceramics Market Overview by Ceramic Type .................................... 254 Chart 142: South Korean Medical Ceramics Market Analysis (2014-2022) by Ceramic Type – Bioactive Ceramics, Bioinert Ceramics and Bioresorbable Ceramics in USD Million..........254 Chart 143: Glance at 2014, 2017 and 2022 South Korean Medical Ceramics Market Share (%) by Ceramic Type – Bioactive Ceramics, Bioinert Ceramics and Bioresorbable Ceramics ....................................................................... 255 3.5.4.2 South Korean Medical Ceramics Market Overview by Application........................................ 256 Chart 144: South Korean Medical Ceramics Market Analysis (2014-2022) by Application – Dental Implants, Implantable Electronic Devices, Orthopedic Implants, Surgical & Diagnostic Instruments and Other Applications in USD Million ...............................................................256 Chart 145: Glance at 2014, 2017 and 2022 South Korean Medical Ceramics Market Share (%) by Application – Dental Implants, Implantable Electronic Devices, Orthopedic Implants, Surgical & Diagnostic Instruments and Other Applications .................................................257 3.5.5 Rest of Asia-Pacific.....................................258 3.5.5.1 Rest of Asia Medical Ceramics Market Overview by Ceramic Type .................................... 258 Chart 146: Rest of Asia-Pacific Medical Ceramics Market Analysis (2014-2022) by Ceramic Type – Bioactive Ceramics, Bioinert Ceramics and Bioresorbable Ceramics in USD Million ...............................................................258 Chart 147: Glance at 2014, 2017 and 2022 Rest of Asia- Pacific Medical Ceramics Market Share (%) by Ceramic Type – Bioactive Ceramics, Bioinert Ceramics and Bioresorbable Ceramics ................................................259 3.5.5.2 Rest of Asia Medical Ceramics Market Overview by Application........................................ 260 Chart 148: Rest of Asia-Pacific Medical Ceramics Market Analysis (2014-2022) by Application – Dental Implants, Implantable Electronic Devices, Orthopedic Implants, Surgical & Diagnostic Instruments and Other Applications in USD Million............................................................... 260 Chart 149: Glance at 2014, 2017 and 2022 Rest of Asia- Pacific Medical Ceramics Market Share (%) by Application – Dental Implants, Implantable Electronic Devices, Orthopedic Implants, Surgical & Diagnostic Instruments and Other Applications................................................. 261 4. LATIN AMERICA ..............................................262 Chart 150: Latin American Medical Ceramics Market Analysis (2014-2022) in USD Million............................. 262 4.1 Latin American Medical Ceramics Market Overview by Geographic Region............................ 263 Chart 151: Latin American Medical Ceramics Market Analysis (2014-2022) by Region – Argentina, Brazil, Mexico and Rest of Latin America in USD Million...................... 263 Chart 152: Glance at 2014, 2017 and 2022 Latin American Medical Ceramics Market Share (%) by Region – Argentina, Brazil, Mexico and Rest of Latin America...................... 264 4.2 Latin American Medical Ceramics Market Overview by Ceramic Type .................................... 265 Chart 153: Latin American Medical Ceramics Market Analysis (2014-2022) by Ceramic Type – Bioactive Ceramics, Bioinert Ceramics and Bioresorbable Ceramics in USD Million...... 265 Chart 154: Glance at 2014, 2017 and 2022 Latin American Medical Ceramics Market Share (%) by Ceramic Type – Bioactive Ceramics, Bioinert Ceramics and Bioresorbable Ceramics........266 4.2.1 Medical Ceramic Types Market Overview by Global Region ........................................................ 267 4.2.1.1 Bioactive Ceramics..................................... 267 Chart 155: Latin American Bioactive Ceramics Market Analysis (2014-2022) by Region – Argentina, Brazil, Mexico and Rest of Latin America in USD Million...................... 267 Chart 156: Glance at 2014, 2017 and 2022 Latin American Bioactive Ceramics Market Share (%) by Region – Argentina, Brazil, Mexico and Rest of Latin America..... 268 4.2.1.2 Bioinert Ceramics....................................... 269 Chart 157: Latin American Bioinert Ceramics Market Analysis (2014-2022) by Region – Argentina, Brazil, Mexico and Rest of Latin America in USD Million...................... 269 Chart 158: Glance at 2014, 2017 and 2022 Latin American Bioinert Ceramics Market Share (%) by Region – Argentina, Brazil, Mexico and Rest of Latin America...................... 270 4.2.1.3 Bioresorbable Ceramics ............................. 271 Chart 159: Latin American Bioresorbable Ceramics Market Analysis (2014-2022) by Region – Argentina, Brazil, Mexico and Rest of Latin America in USD Million...................... 271 Chart 160: Glance at 2014, 2017 and 2022 Latin American Bioresorbable Ceramics Market Share (%) by Region – Argentina, Brazil, Mexico and Rest of Latin America..... 272 4.3 Latin American Medical Ceramics Market Overview by Application........................................ 273 Chart 161: Latin American Medical Ceramics Market Analysis (2014-2022) by Application – Dental Implants, Implantable Electronic Devices, Orthopedic Implants, Surgical & Diagnostic Instruments and Other Applications in USD Million............................................................... 273 Chart 162: Glance at 2014, 2017 and 2022 Latin American Medical Ceramics Market Share (%) by Application – Dental Implants, Implantable Electronic Devices, Orthopedic Implants, Surgical & Diagnostic Instruments and Other Applications................................................. 274 4.3.1 Medical Ceramics Applications Market Overview by Global Region.................................................... 275 4.3.1.1 Dental Implants ......................................... 275 Chart 163: Latin American Medical Ceramics Market Analysis (2014-2022) in Dental Implants by Region – Argentina, Brazil, Mexico and Rest of Latin America in USD Million............. 275 Chart 164: Glance at 2014, 2017 and 2022 Latin American Medical Ceramics Market Share (%) in Dental Implants by Region – Argentina, Brazil, Mexico and Rest of Latin America........................................................................ 276
  • 7. Page 7 Medical Ceramics – A Global Market Overview February 2017 |312 Pages | 193 Charts | Price $4050 Click here to buy the report 4.3.1.2 Implantable Electronic Devices.................. 277 Chart 165: Latin American Medical Ceramics Market Analysis (2014-2022) in Implantable Electronic Devices by Region – Argentina, Brazil, Mexico and Rest of Latin America in USD Million..................................................277 Chart 166: Glance at 2014, 2017 and 2022 Latin American Medical Ceramics Market Share (%) in Implantable Electronic Devices by Region – Argentina, Brazil, Mexico and Rest of Latin America......278 4.3.1.3 Orthopedic Implants.................................. 279 Chart 167: Latin American Medical Ceramics Market Analysis (2014-2022) in Orthopedic Implants by Region – Argentina, Brazil, Mexico and Rest of Latin America in USD Million ......279 Chart 168: Glance at 2014, 2017 and 2022 Latin American Medical Ceramics Market Share (%) in Orthopedic Implants by Region – Argentina, Brazil, Mexico and Rest of Latin America..280 4.3.1.4 Surgical & Diagnostic Instruments ............. 281 Chart 169: Latin American Medical Ceramics Market Analysis (2014-2022) in Surgical & Diagnostic Instruments by Region – Argentina, Brazil, Mexico and Rest of Latin America in USD Million..................................................281 Chart 170: Glance at 2014, 2017 and 2022 Latin American Medical Ceramics Market Share (%) in Surgical & Diagnostic Instruments by Region – Argentina, Brazil, Mexico and Rest of Latin America .................................282 4.3.1.5 Other Applications..................................... 283 Chart 171: Latin American Medical Ceramics Market Analysis (2014-2022) in Other Applications by Region – Argentina, Brazil, Mexico and Rest of Latin America in USD Million ......283 Chart 172: Glance at 2014, 2017 and 2022 Latin American Medical Ceramics Market Share (%) in Other Applications by Region – Argentina, Brazil, Mexico and Rest of Latin America..284 4.4 Country-wise Analysis of Latin American Medical Ceramics Market.................................................... 285 4.4.1 Argentina...................................................285 4.4.1.1 Argentinean Medical Ceramics Market Overview by Ceramic Type .................................... 285 Chart 173: Argentine Medical Ceramics Market Analysis (2014-2022) by Ceramic Type – Bioactive Ceramics, Bioinert Ceramics and Bioresorbable Ceramics in USD Million...... 285 Chart 174: Glance at 2014, 2017 and 2022 Argentine Medical Ceramics Market Share (%) by Ceramic Type – Bioactive Ceramics, Bioinert Ceramics and Bioresorbable Ceramics....286 4.4.1.2 Argentinean Medical Ceramics Market Overview by Application........................................ 287 Chart 175: Argentine Medical Ceramics Market Analysis (2014- 2022) by Application – Dental Implants, Implantable Electronic Devices, Orthopedic Implants, Surgical & Diagnostic Instruments and Other Applications in USD Million..............287 Chart 176: Glance at 2014, 2017 and 2022 Argentine Medical Ceramics Market Share (%) by Application – Dental Implants, Implantable Electronic Devices, Orthopedic Implants, Surgical & Diagnostic Instruments and Other Applications................288 4.4.2 Brazil..........................................................289 4.4.2.1 Brazilian Medical Ceramics Market Overview by Ceramic Type .................................................... 289 Chart 177: Brazilian Medical Ceramics Market Analysis (2014-2022) by Ceramic Type – Bioactive Ceramics, Bioinert Ceramics and Bioresorbable Ceramics in USD Million...... 289 Chart 178: Glance at 2014, 2017 and 2022 Brazilian Medical Ceramics Market Share (%) by Ceramic Type – Bioactive Ceramics, Bioinert Ceramics and Bioresorbable Ceramics ....................................................................... 290 4.4.2.2 Brazilian Medical Ceramics Market Overview by Application........................................................ 291 Chart 179: Brazilian Medical Ceramics Market Analysis (2014- 2022) by Application – Dental Implants, Implantable Electronic Devices, Orthopedic Implants, Surgical & Diagnostic Instruments and Other Applications in USD Million .............291 Chart 180: Glance at 2014, 2017 and 2022 Brazilian Medical Ceramics Market Share (%) by Application – Dental Implants, Implantable Electronic Devices, Orthopedic Implants, Surgical & Diagnostic Instruments and Other Applications .................................................292 4.4.3 Mexico.......................................................293 4.4.3.1 Mexican Medical Ceramics Market Overview by Ceramic Type .................................................... 293 Chart 181: Mexican Medical Ceramics Market Analysis (2014-2022) by Ceramic Type – Bioactive Ceramics, Bioinert Ceramics and Bioresorbable Ceramics in USD Million...... 293 Chart 182: Glance at 2014, 2017 and 2022 Mexican Medical Ceramics Market Share (%) by Ceramic Type – Bioactive Ceramics, Bioinert Ceramics and Bioresorbable Ceramics ....................................................................... 294 4.4.3.2 Mexican Medical Ceramics Market Overview by Application........................................................ 295 Chart 183: Mexican Medical Ceramics Market Analysis (2014-2022) by Application – Dental Implants, Implantable Electronic Devices, Orthopedic Implants, Surgical & Diagnostic Instruments and Other Applications in USD Million........................................................................... 295 Chart 184: Glance at 2014, 2017 and 2022 Mexican Medical Ceramics Market Share (%) by Application – Dental Implants, Implantable Electronic Devices, Orthopedic Implants, Surgical & Diagnostic Instruments and Other Applications .................................................296 4.4.4 Rest of Latin America .................................297 4.4.4.1 Rest of Latin America Medical Ceramics Market Overview by Ceramic Type........................ 297 Chart 185: Rest of Latin America Medical Ceramics Market Analysis (2014-2022) by Ceramic Type – Bioactive Ceramics, Bioinert Ceramics and Bioresorbable Ceramics in USD Million ...............................................................297 Chart 186: Glance at 2014, 2017 and 2022 Rest of Latin America Medical Ceramics Market Share (%) by Ceramic Type – Bioactive Ceramics, Bioinert Ceramics and Bioresorbable Ceramics................................................ 298 4.4.4.2 Rest of Latin America Medical Ceramics Market Overview by Application ........................... 299 Chart 187: Rest of Latin America Medical Ceramics Market Analysis (2014-2022) by Application – Dental Implants, Implantable Electronic Devices, Orthopedic Implants, Surgical & Diagnostic Instruments and Other Applications in USD Million............................................................... 299 Chart 188: Glance at 2014, 2017 and 2022 Rest of Latin America Medical Ceramics Market Share (%) by Application – Dental Implants, Implantable Electronic Devices, Orthopedic Implants, Surgical & Diagnostic Instruments and Other Applications............................. 300 5. REST OF WORLD..............................................301 Chart 189: Rest of World Medical Ceramics Market Analysis (2014-2022) in USD Million............................. 301 5.1 Rest World Medical Ceramics Market Overview by Ceramic Type......................................................... 302 Chart 190: Rest of World Medical Ceramics Market Analysis (2014-2022) by Ceramic Type – Bioactive Ceramics, Bioinert Ceramics and Bioresorbable Ceramics in USD Million .......... 302 Chart 191: Glance at 2014, 2017 and 2022 Rest of World Medical Ceramics Market Share (%) by Ceramic Type – Bioactive Ceramics, Bioinert Ceramics and Bioresorbable Ceramics....................................................................... 303 5.2 Rest World Medical Ceramics Market Overview by Application ............................................................ 304 Chart 192: Rest of World Medical Ceramics Market Analysis (2014-2022) by Application – Dental Implants, Implantable Electronic Devices, Orthopedic Implants, Surgical & Diagnostic Instruments and Other Applications in USD Million ............. 304 Chart 193: Glance at 2014, 2017 and 2022 Rest of World Medical Ceramics Market Share (%) by Application – Dental Implants, Implantable Electronic Devices, Orthopedic Implants, Surgical & Diagnostic Instruments and Other Applications................................................. 305 Micro Ceramics Limited (Israel) – A Major Player......... 306 PART C: GUIDE TO THE INDUSTRY...............307 1. NORTH AMERICA ............................................307 2. EUROPE ..........................................................308 3. ASIA-PACIFIC...................................................310 4. REST OF WORLD..............................................310 PART D: ANNEXURE....................................311 1. RESEARCH METHODOLOGY .............................311 2. FEEDBACK.......................................................313 About Industry Experts Industry Experts values the most updated and accurate market research and industry analysis to provide unique market research reports for a broad range of industry verticals including Automotive, Transportation, Healthcare, Pharmaceuticals, Food & Beverages, Chemicals, Plastics, Materials, Consumer Goods, Retail, Biotechnology, Construction, Manufacturing and Other industries. Our research reports help our clients to identify and resolve topical issues by providing a complete picture of the market in their respective industry sectors. The Company’s rich collection of market research reports enables the companies to explore market drivers; forecast the future market; and to formulate the right strategies at the right time. Industry Experts’ leading edge publications makes the life easy for corporate strategists, investors, analysts and researchers, start ups, consultants, financial and banking executives, academicians and many more. The company also provides customized research reports to cater the needs of the industry. More about Industry Experts INDUSTRY EXPERTS 1-7-19/C, Street No. 8, Habsiguda Hyderabad – 500007, India Phone: +91-40-4018-1314 Fax: +91-40-4027-2381 info@industry-experts.com industry-experts.com