Power Sector Update: Generation growth buoyant - Motilal Oswal
•
1 gefällt mir•266 views

The document provides a preview of expected quarterly financial results for utility companies in India. It is expected that aggregate revenue will grow 4% YoY while profit will decline 9% YoY mainly due to lower profits at Coal India. Generation growth was up 12% YoY in July-August due to economic recovery and improved coal supply. Power deficit remained around 4% as demand grew 9-13% YoY and supply increased 10% YoY. Imported coal prices declined slightly QoQ while domestic short-term prices increased. The document recommends preferring insulated players like CESC and Indiabulls Power given current issues around PPAs, fuel, and tariffs.

Empfohlen
Empfohlen
Weitere ähnliche Inhalte
Ähnlich wie Power Sector Update: Generation growth buoyant - Motilal Oswal
Ähnlich wie Power Sector Update: Generation growth buoyant - Motilal Oswal (20)
Mehr von IndiaNotes.com
Mehr von IndiaNotes.com (20)
Kürzlich hochgeladen
Kürzlich hochgeladen (20)
Power Sector Update: Generation growth buoyant - Motilal Oswal
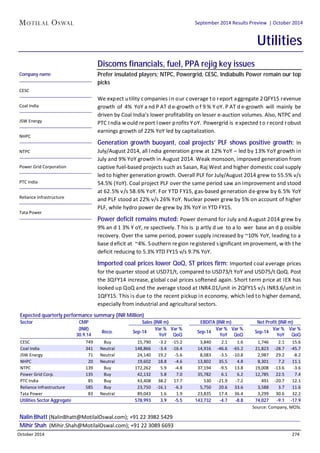
- 1. September 2014 Results Preview | Sector: Utilities September 2014 Results Preview | October 2014 Utilities Discoms financials, fuel, PPA rejig key issues Prefer insulated players; NTPC, Powergrid, CESC, Indiabulls Power remain our top picks We expect utility companies in our coverage to report aggregate 2QFY15 revenue growth of 4% YoY and PAT de-growth of 9% YoY. PAT de-growth will mainly be driven by Coal India’s lower profitability on lesser e-auction volumes. Also, NTPC and PTC India would report lower profits YoY. Powergrid is expected to record robust earnings growth of 22% YoY led by capitalization. Generation growth buoyant, coal projects’ PLF shows positive growth: In July/August 2014, all India generation grew at 12% YoY – led by 13% YoY growth in July and 9% YoY growth in August 2014. Weak monsoon, improved generation from captive fuel-based projects such as Sasan, Raj West and higher domestic coal supply led to higher generation growth. Overall PLF for July/August 2014 grew to 55.5% v/s 54.5% (YoY). Coal project PLF over the same period saw an improvement and stood at 62.5% v/s 58.6% YoY. For YTD FY15, gas-based generation de-grew by 6.5% YoY and PLF stood at 22% v/s 26% YoY. Nuclear power grew by 5% on account of higher PLF, while hydro power de-grew by 3% YoY in YTD FY15. Power deficit remains muted: Power demand for July and August 2014 grew by 9% and 13% YoY, respectively. This is partly due to a lower base and possible recovery. Over the same period, power supply increased by ~10% YoY, leading to a base deficit at ~4%. Southern region registered significant improvement, with the deficit reducing to 5.3% YTD FY15 v/s 9.7% YoY. Imported coal prices lower QoQ, ST prices firm: Imported coal average prices for the quarter stood at USD71/t, compared to USD73/t YoY and USD75/t QoQ. Post the 3QFY14 increase, global coal prices softened again. Short term price at IEX has looked up QoQ and the average stood at INR4.01/unit in 2QFY15 v/s INR3.6/unit in 1QFY15. This is due to the recent pickup in economy, which led to higher demand, especially from industrial and agricultural sectors. Company name CESC Coal India JSW Energy NHPC NTPC Power Grid Corporation PTC India Reliance Infrastructure Tata Power Expected quarterly performance summary (INR Million) Sector CMP Sales (INR m) EBDITA (INR m) Net Profit (INR m) (INR) 30.9.14 Reco. Sep-14 Var % YoY Var % QoQ CESC 749 Buy 15,790 -3.2 -15.2 3,840 2.1 1.6 1,746 2.1 15.6 Coal India 341 Neutral 148,866 -3.4 -16.4 14,916 -46.6 -65.2 21,823 -28.7 -45.7 JSW Energy 71 Neutral 24,140 19.2 -5.6 8,083 -3.5 -10.8 2,987 29.2 -8.2 NHPC 20 Neutral 19,602 18.8 -4.6 13,802 35.5 4.8 8,301 7.2 11.1 NTPC 139 Buy 172,262 5.9 -4.8 37,194 -9.5 13.8 19,008 -13.6 -3.6 Power Grid Corp. 135 Buy 42,132 5.8 7.0 35,782 6.1 6.2 12,785 22.5 7.4 PTC India 85 Buy 43,408 38.2 17.7 530 -21.9 -7.2 491 -20.7 12.1 Reliance Infrastructure 585 Buy 23,750 -16.1 -6.3 5,750 20.6 33.6 3,588 3.7 11.6 Tata Power 83 Neutral 89,043 1.6 1.9 23,835 17.4 36.4 3,299 30.6 32.2 Utilities Sector Aggregate 578,993 3.9 -5.5 143,732 -4.7 -8.8 74,027 -9.1 -17.9 Nalin Bhatt (NalinBhatt@MotilalOswal.com); +91 22 3982 5429 Mihir Shah (Mihir.Shah@MotilalOswal.com); +91 22 3089 6693 Sep-14 Var % YoY Var % QoQ Sep-14 Var % YoY Var % QoQ Source: Company, MOSL October 2014 274
- 2. September 2014 Results Preview | Sector: Utilities SC de-allocates coal blocks: The Supreme Court has de-allocated 214 blocks of the 218 allotted to various companies since 1993. Timeline for handing over the mines and completion of related modalities is till March 2015. Also, the current judgment recommends a payment of INR295/t as additional levy for every ton of coal mined from the start of captive coal block till March 2015. Though this may create near-term hiccups, it streamlines the process of usage and pricing of coal for all sectors, pertinently power in the longer term. Valuation and view: We continue to prefer CPSUs which are better placed in the current uncertain environment of PPA, fuel and tariff. We rate NTPC and Powergrid as the top picks in the sector. Among IPPs, we prefer CESC and IBPOW, being relatively insulated from the current crisis. Relative Performance - 3m (%) Sensex Index MOSL Utilities Index Jun-14 Jul-14 Aug-14 Sep-14 Source: Bloomberg, MOSL Relative Performance - 1 Year (%) Sensex Index MOSL Utilities Index Sep-13 Dec-13 Mar-14 Jun-14 Sep-14 Source: Bloomberg, MOSL 110 105 100 95 90 85 140 125 110 95 80 Comparative Valuation Sector / Companies CMP Reco. EPS (INR) PE (x) EV/EBITDA (x) RoE (%) (INR) FY15E FY16E FY17E FY15E FY16E FY17E FY15E FY16E FY17E FY15E FY16E FY17E Utilities CESC 749 Buy 56.0 61.2 66.2 13.4 12.2 11.3 8.2 7.4 6.6 11.0 10.9 10.7 Coal India 341 Neutral 26.0 28.9 32.4 13.1 11.8 10.5 9.0 7.6 6.3 23.9 23.4 23.1 Indiabulls Power 13 Buy 0.2 1.9 3.0 75.5 6.7 4.2 12.1 5.1 4.4 0.8 9.0 13.0 Jaiprakash Power 12 Under Review 2.8 3.6 4.1 4.5 3.5 3.0 8.8 5.1 4.5 13.0 15.6 15.6 JSW Energy 71 Neutral 7.8 5.8 5.6 9.0 12.2 12.6 5.8 6.4 6.3 18.3 12.1 10.8 NHPC 20 Neutral 2.1 2.4 2.5 9.3 8.0 7.9 7.8 7.3 7.0 8.1 8.4 8.2 NTPC 139 Buy 10.3 12.2 14.5 13.5 11.4 9.6 10.7 9.4 8.0 9.6 10.8 12.0 Power Grid Corp. 135 Buy 10.0 11.9 14.0 13.6 11.4 9.6 10.6 9.5 8.6 14.4 15.6 16.6 PTC India 85 Buy 9.5 13.3 15.0 9.0 6.4 5.7 8.7 4.4 3.3 7.0 10.4 10.9 Reliance Infra. 585 Buy 53.6 61.8 63.2 10.9 9.5 9.3 4.7 3.6 3.4 6.7 7.3 7.0 Tata Power 83 Neutral 5.6 6.8 8.0 14.9 12.2 10.4 11.3 9.0 8.2 7.9 8.5 8.5 Sector Aggregate 12.7 11.1 9.8 9.5 8.0 7.1 14.2 15.0 15.7 Source: Company, MOSL October 2014 275
- 3. October 2014 276 September 2014 Results Preview | Sector: Utilities Jul/Aug 2014 generation growth up due to economic recovery Source: CEA Monthly generation appears flattish Source: CEA Power demand growth sees upward trend YoY Source: CEA Base deficit remains at 4% in Jul/Aug 2014 period Source: CEA Peak deficit too trends lower, though shot up in Aug Source: CEA ST prices on upward trajectory since past four quarters Source: IEX RB Index* prices decline QoQ (USD/t) * 6000Kcal, FoB South Africa Source: Bloomberg INR remains flat Source: RBI 42 50 52 55 56 55 59 57 59 56 54 51 50 60 58 62 64 56 64 62 66 57 58 53 61 60 62 67 66 73 68 70 71 69 69 65 61 71 74 76 76 78 78 75 74 72 67 61 62 71 71 73 74 71 72 70 72 65 61 56 65 62 65 69 70 69 66 69 68 68 65 60 Sep-11 Nov-11 Jan-12 Mar-12 May-12 Jul-12 Sep-12 Nov-12 Jan-13 Mar-13 May-13 Jul-13 Sep-13 Nov-13 Jan-14 Mar-14 May-14 Jul-14 Coal Generation (BUs) PLF (%) 73 72 70 74 71 73 73 71 77 75 79 76 75 73 72 78 73 76 78 68 80 77 84 76 80 78 82 79 77 82 79 87 84 87 89 88 89 89 1113 0 19 6 1 12 -6 8 0 13 3 4 5 -2 10 0 4 10 -11 7 -2 10 1 8 9 5 8 1 5 15 9 8 4 18 1113 9 Jul-11 Sep-11 Nov-11 Jan-12 Mar-12 May-12 Jul-12 Sep-12 Nov-12 Jan-13 Mar-13 May-13 Jul-13 Sep-13 Nov-13 Jan-14 Mar-14 May-14 Jul-14 All India Generation (BUs) Gr (YoY, %) 79 84 85 86 83 80 84 79 85 85 73 86 83 91 83 87 84 83 80 77 83 84 78 85 7.4% 89 91 94 95 95 0.1% 13.8% 8.9% 12.9% April May June July Aug Sept Oct Nov Dec Jan Feb Mar FY13 FY14 FY15 Gr (%) 5 4.4 3.8 3.7 3.6 4.3 2 8 11 14 Apr May Jun Jul Aug Sep Oct Nov Dec Jan Feb Mar YTD FY15 FY12 FY13 FY14 5 4.9 4.1 5.1 3.5 8 6.0 2 11 14 Apr May Jun Jul Aug Sep Oct Nov Dec Jan Feb Mar YTDFY15 FY12 FY13 FY14 5.3 3.1 2.3 3.6 3.1 2.9 4.6 3.4 3.1 3.5 3.5 3.2 2.7 2.5 2.9 3.1 3.6 4.0 1QFY11 2QFY11 3QFY11 4QFY11 1QFY12 2QFY12 3QFY12 4QFY12 1QFY13 2QFY13 3QFY13 4QFY13 1QFY14 2QFY14 3QFY14 4QFY14 1QFY15 2QFY15 91 88 104 121 121 117 107 105 96 88 86 85 81 73 83 79 75 71 50 -40% 70 -15% 90 10% 110 35% 130 60% 1QFY11 2QFY11 3QFY11 4QFY11 1QFY12 2QFY12 3QFY12 4QFY12 1QFY13 2QFY13 3QFY13 4QFY13 1QFY14 2QFY14 3QFY14 4QFY14 1QFY15 2QFY15 Avg RB Index (USD/ton) YoY QoQ 46.0 55 55 54 5457 46 46 45 45 44 51.0 46 56.0 51 50 -2% 63 62 62 60 60 36.0 -10% 6% 14% 22% 41.0 61.0 66.0 1QFY11 2QFY11 3QFY11 4QFY11 1QFY12 2QFY12 3QFY12 4QFY12 1QFY13 2QFY13 3QFY13 4QFY13 1QFY14 2QFY14 3QFY14 4QFY14 1QFY15 2QFY15 QoQ (%) YoY (%) INR/USD
- 4. September 2014 Results Preview | Sector: Utilities Generation, PLF for projects Capacity Aug-14 Aug-13 YTDFY15 YTDFY14 (MW)* Generation PLF (%) Generation PLF (%) Generation PLF (%) Generation PLF (%) Adani Power - Mundra 4,620 2,203.3 64.1 2,118.0 61.6 13,565.3 80.0 11,683.3 68.9 - Tirora 2,640 1,386.7 70.6 2.5 0.0 6,537.1 67.4 2,980.0 47.1 GVK - JP 1 & 2 455 0.0 0.0 74.8 22.5 190.1 28.6 399.4 60.1 - Gautami 464 - 0.0 0.0 0.0 0.0 0.0 0.0 0.0 GMR - Barge Mounted 1,270 336.3 43.1 0.0 0.0 1,611.7 193.7 137.0 42.6 - Chennai 200 43.0 29.5 52.3 35.8 359.9 123.3 316.8 108.5 - Vemagiri 370 0.0 0.0 0.0 0.0 0.0 0.0 177.5 32.9 JPL - Chattisgarh 1,000 673.6 90.5 657.5 88.4 3,521.3 95.9 3,592.4 97.8 Rel Infra - Dahanu 500 369.4 99.3 357.3 96.0 1,854.8 101.0 1,771.9 96.5 - Samalkot (AP) 220 0.0 0.0 39.4 24.5 68.6 21.4 213.6 66.5 - Goa 48 0.0 0.0 21.7 61.9 12.6 18.0 105.7 150.8 - Kochi 174 0.0 0.0 0.0 0.0 116.5 45.9 46.9 18.5 Rel Power - Rosa 1,200 661.8 74.1 707.7 79.3 3,978.8 90.3 3,364.1 76.3 - Sasan 2,640 1,545.2 77.9 0.0 0.0 6,462.8 77.9 0.0 0.0 Tata Power - Trombay 1,580 353.7 34.0 817.2 46.2 2,674.2 39.9 3,378.4 55.7 - TISCO (Jamshedpur) 441 228.8 85.4 184.5 68.9 1,158.9 87.7 1,028.6 77.8 - Mundra UMPP 4,000 1,809.6 60.8 1,661.1 55.8 10,382.2 70.7 9,718.5 66.2 - Maithon 1,050 573.3 73.4 298.8 38.3 3,033.7 78.7 2,391.3 62.0 Torrent Power - Existing 500 283.2 95.2 177.7 59.7 1,373.5 93.5 1,008.1 68.6 - Sugen 1,148 262.2 31.3 210.0 25.1 1,102.5 65.8 971.7 58.0 JSW Energy - Rajwest 1,080 582.4 72.5 325.0 40.4 3,136.2 79.1 2,358.7 59.5 - Karnataka/Ratnagiri 2,060 552.1 86.3 1,232.7 80.4 2,954.4 93.6 2,885.3 91.4 CESC 1,285 817.0 85.5 811.7 84.9 4,066.9 86.2 4,049.3 85.8 Lanco Infratech - Kondapali 716 26.3 5.0 108.6 20.8 452.4 43.3 651.4 62.3 - Amarkantak 600 128.8 28.9 159.6 35.8 965.3 43.8 898.3 40.8 - UPCL 1,200 458.4 51.3 226.3 25.3 2,629.1 59.7 2,689.1 61.0 - Anpara 1,200 676.0 75.7 503.4 56.4 3,521.9 79.9 2,553.2 57.9 KSK - Wardha 1,740 470.9 55.5 285.6 58.1 1,591.2 38.0 1,256.7 63.4 Sterlite - Jharsuguda 2,400 497.5 27.9 487.7 27.3 3,517.8 39.9 3,753.2 42.6 Source: CEA, *Monitored capacity by CEA October 2014 277
- 5. Disclosures This research report has been prepared by MOSt to provide information about the company(ies) and sector(s), if any, covered in the report and may be distributed by it and/or its affiliated company(ies). This report is for personal information of the select recipient and does not construe to be any investment, legal or taxation advice to you. This research report does not constitute an offer, invitation or inducement to invest in securities or other investments and Motilal Oswal Securities Limited (hereinafter referred as MOSt) is not soliciting any action based upon it. This report is not for public distribution and has been furnished to you solely for your general information and should not be reproduced or redistributed to any other person in any form. This report does not constitute a personal recommendation or take into account the particular investment objectives, financial situations, or needs of individual clients. Before acting on any advice or recommendation in this material, investors should consider whether it is suitable for their particular circumstances and, if necessary, seek professional advice. The price and value of the investments referred to in this material and the income from them may go down as well as up, and investors may realize losses on any investments. Past performance is not a guide for future performance, future returns are not guaranteed and a loss of original capital may occur. MOSt and its affiliates are a full-service, integrated investment banking, investment management, brokerage and financing group. We and our affiliates have investment banking and other business relationships with a significant percentage of the companies covered by our Research Department Our research professionals provide important input into our investment banking and other business selection processes. Investors should assume that MOSt and/or its affiliates are seeking or will seek investment banking or other business from the company or companies that are the subject of this material and that the research professionals who were involved in preparing this material may participate in the solicitation of such business. The research professionals responsible for the preparation of this document may interact with trading desk personnel, sales personnel and other parties for the purpose of gathering, applying and interpreting market information. Our research professionals are paid in part based on the profitability of MOSt which include earnings from investment banking and other business. MOSt generally prohibits its analysts, persons reporting to analysts, and members of their households from maintaining a financial interest in the securities or derivatives of any companies that the analysts cover. Additionally, MOSt generally prohibits its analysts and persons reporting to analysts from serving as an officer, director, or advisory board member of any companies that the analysts cover. Our salespeople, traders, and other professionals or affiliates may provide oral or written market commentary or trading strategies to our clients that reflect opinions that are contrary to the opinions expressed herein, and our proprietary trading and investing businesses may make investment decisions that are inconsistent with the recommendations expressed herein. In reviewing these materials, you should be aware that any or all o the foregoing, among other things, may give rise to real or potential conflicts of interest . MOSt and its affiliated company(ies), their directors and employees may; (a) from time to time, have a long or short position in, and buy or sell the securities of the company(ies) mentioned herein or (b) be engaged in any other transaction involving such securities and earn brokerage or other compensation or act as a market maker in the financial instruments of the company(ies) discussed herein or act as an advisor or lender/borrower to such company(ies) or may have any other potential conflict of interests with respect to any recommendation and other related information and opinions. Unauthorized disclosure, use, dissemination or copying (either whole or partial) of this information, is prohibited. The person accessing this information specifically agrees to exempt MOSt or any of its affiliates or employees from, any and all responsibility/liability arising from such misuse and agrees not to hold MOSt or any of its affiliates or employees responsible for any such misuse and further agrees to hold MOSt or any of its affiliates or employees free and harmless from all losses, costs, damages, expenses that may be suffered by the person accessing this information due to any errors and delays. The information contained herein is based on publicly available data or other sources believed to be reliable. Any statements contained in this report attributed to a third party represent MOSt’s interpretation of the data, information and/or opinions provided by that third party either publicly or through a subscription service, and such use and interpretation have not been reviewed by the third party. This Report is not intended to be a complete statement or summary of the securities, markets or developments referred to in the document. While we would endeavor to update the information herein on reasonable basis, MOSt and/or its affiliates are under no obligation to update the information. Also there may be regulatory, compliance, or other reasons that may prevent MOSt and/or its affiliates from doing so. MOSt or any of its affiliates or employees shall not be in any way responsible and liable for any loss or damage that may arise to any person from any inadvertent error in the information contained in this report. MOSt or any of its affiliates or employees do not provide, at any time, any express or implied warranty of any kind, regarding any matter pertaining to this report, including without limitation the implied warranties of merchantability, fitness for a particular purpose, and non-infringement. The recipients of this report should rely on their own investigations. Recipients who are not institutional investors should seek advice of their independent financial advisor prior to taking any investment decision based on this report or for any necessary explanation of its contents. MOSt and/or its affiliates and/or employees may have interests/positions, financial or otherwise in the securities mentioned in this report. To enhance transparency, MOSt has incorporated a Disclosure of Interest Statement in this document. This should, however, not be treated as endorsement of the views expressed in the report. Disclosure of Interest Statement Companies where there is interest Analyst ownership of the stock Sesa Sterlie Analyst Certification The views expressed in this research report accurately reflect the personal views of the analyst(s) about the subject securities or issues, and no part of the compensation of the research analyst(s) was, is, or will be directly or indirectly related to the specific recommendations and views expressed by research analyst(s) in this report. The research analysts, strategists, or research associates principally responsible for preparation of MOSt research receive compensation based upon various factors, including quality of research, investor client feedback, stock picking, competitive factors and firm revenues. Regional Disclosures (outside India) This report is not directed or intended for distribution to or use by any person or entity resident in a state, country or any jurisdiction, where such distribution, publication, availability or use would be contrary to law, regulation or which would subject MOSt & its group companies to registration or licensing requirements within such jurisdictions. For U.K. This report is intended for distribution only to persons having professional experience in matters relating to investments as described in Article 19 of the Financial Services and Markets Act 2000 (Financial Promotion) Order 2005 (referred to as "investment professionals"). This document must not be acted on or relied on by persons who are not investment professionals. Any investment or investment activity to which this document relates is only available to investment professionals and will be engaged in only with such persons. For U.S. Motilal Oswal Securities Limited (MOSL) is not a registered broker - dealer under the U.S. Securities Exchange Act of 1934, as amended (the"1934 act") and under applicable state laws in the United States. In addition MOSL is not a registered investment adviser under the U.S. Investment Advisers Act of 1940, as amended (the "Advisers Act" and together with the 1934 Act, the "Acts), and under applicable state laws in the United States. Accordingly, in the absence of specific exemption under the Acts, any brokerage and investment services provided by MOSL, including the products and services described herein are not available to or intended for U.S. persons. This report is intended for distribution only to "Major Institutional Investors" as defined by Rule 15a-6(b)(4) of the Exchange Act and interpretations thereof by SEC (henceforth referred to as "major institutional investors"). This document must not be acted on or relied on by persons who are not major institutional investors. Any investment or investment activity to which this document relates is only available to major institutional investors and will be engaged in only with major institutional investors. In reliance on the exemption from registration provided by Rule 15a-6 of the U.S. Securities Exchange Act of 1934, as amended (the "Exchange Act") and interpretations thereof by the U.S. Securities and Exchange Commission ("SEC") in order to conduct business with Institutional Investors based in the U.S., MOSL has entered into a chaperoning agreement with a U.S. registered broker-dealer, Motilal Oswal Securities International Private Limited. ("MOSIPL"). Any business interaction pursuant to this report will have to be executed within the provisions of this chaperoning agreement. The Research Analysts contributing to the report may not be registered /qualified as research analyst with FINRA. Such research analyst may not be associated persons of the U.S. registered broker-dealer, MOSIPL, and therefore, may not be subject to NASD rule 2711 and NYSE Rule 472 restrictions on communication with a subject company, public appearances and trading securities held by a research analyst account. For Singapore Motilal Oswal Capital Markets Singapore Pte Limited is acting as an exempt financial advisor under section 23(1)(f) of the Financial Advisers Act(FAA) read with regulation 17(1)(d) of the Financial Advisors Regulations and is a subsidiary of Motilal Oswal Securities Limited in India. This research is distributed in Singapore by Motilal Oswal Capital Markets Singapore Pte Limited and it is only directed in Singapore to accredited investors, as defined in the Financial Advisers Regulations and the Securities and Futures Act (Chapter 289), as amended from time to time. In respect of any matter arising from or in connection with the research you could contact the following representatives of Motilal Oswal Capital Markets Singapore Pte Limited: Anosh Koppikar Kadambari Balachandran Email:anosh.Koppikar@motilaloswal.com Email : kadambari.balachandran@motilaloswal.com Contact(+65)68189232 Contact: (+65) 68189233 / 65249115 Office Address:21 (Suite 31),16 Collyer Quay,Singapore 04931 Motilal Oswal Securities Ltd October 2014 18 Motilal Oswal Tower, Level 9, Sayani Road, Prabhadevi, Mumbai 400 025 Phone: +91 22 3982 5500 E-mail: reports@motilaloswal.com