Kitex: ICRA upgrades long and short-term ratings to AA minus and A one Plus; Buy
•
1 gefällt mir•326 views

Kitex Garments reported a 10.64% increase in net profit to Rs. 159.75 million for Q1 FY16 compared to Q1 FY15. Revenue rose 6.15% to Rs. 1090.81 million. EPS increased 10.64% to Rs. 3.36. The company is recommended as a buy with a target price of Rs. 895 based on expected sales and profit growth over the next two years. The global children's wear market is large and growing, representing an opportunity for Kitex Garments as a leading children's apparel producer.

Empfohlen
Empfohlen
Weitere ähnliche Inhalte
Was ist angesagt?
Was ist angesagt? (19)
Andere mochten auch
Andere mochten auch (12)
Ähnlich wie Kitex: ICRA upgrades long and short-term ratings to AA minus and A one Plus; Buy
Ähnlich wie Kitex: ICRA upgrades long and short-term ratings to AA minus and A one Plus; Buy (20)
Mehr von IndiaNotes.com
Mehr von IndiaNotes.com (20)
Kürzlich hochgeladen
Kürzlich hochgeladen (20)
Kitex: ICRA upgrades long and short-term ratings to AA minus and A one Plus; Buy
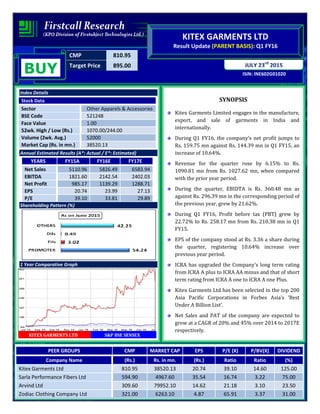
- 1. CMP 810.95 Target Price 895.00 ISIN: INE602G01020 JULY 23rd 2015 KITEX GARMENTS LTD Result Update (PARENT BASIS): Q1 FY16 BUY Index Details Stock Data Sector Other Apparels & Accessories BSE Code 521248 Face Value 1.00 52wk. High / Low (Rs.) 1070.00/244.00 Volume (2wk. Avg.) 52000 Market Cap (Rs. in mn.) 38520.13 Annual Estimated Results (A*: Actual / E*: Estimated) YEARS FY15A FY16E FY17E Net Sales 5110.96 5826.49 6583.94 EBITDA 1821.60 2142.54 2402.03 Net Profit 985.17 1139.29 1288.71 EPS 20.74 23.99 27.13 P/E 39.10 33.81 29.89 Shareholding Pattern (%) 1 Year Comparative Graph KITEX GARMENTS LTD S&P BSE SENSEX SYNOPSIS Kitex Garments Limited engages in the manufacture, export, and sale of garments in India and internationally. During Q1 FY16, the company’s net profit jumps to Rs. 159.75 mn against Rs. 144.39 mn in Q1 FY15, an increase of 10.64%. Revenue for the quarter rose by 6.15% to Rs. 1090.81 mn from Rs. 1027.62 mn, when compared with the prior year period. During the quarter, EBIDTA is Rs. 360.48 mn as against Rs. 296.39 mn in the corresponding period of the previous year, grew by 21.62%. During Q1 FY16, Profit before tax (PBT) grew by 22.72% to Rs. 258.17 mn from Rs. 210.38 mn in Q1 FY15. EPS of the company stood at Rs. 3.36 a share during the quarter, registering 10.64% increase over previous year period. ICRA has upgraded the Company's long term rating from ICRA A plus to ICRA AA minus and that of short term rating from ICRA A one to ICRA A one Plus. Kitex Garments Ltd has been selected in the top 200 Asia Pacific Corporations in Forbes Asia’s ‘Best Under A Billion List’. Net Sales and PAT of the company are expected to grow at a CAGR of 20% and 45% over 2014 to 2017E respectively. PEER GROUPS CMP MARKET CAP EPS P/E (X) P/BV(X) DIVIDEND Company Name (Rs.) Rs. in mn. (Rs.) Ratio Ratio (%) Kitex Garments Ltd 810.95 38520.13 20.74 39.10 14.60 125.00 Sarla Performance Fibers Ltd 594.90 4967.60 35.54 16.74 3.22 75.00 Arvind Ltd 309.60 79952.10 14.62 21.18 3.10 23.50 Zodiac Clothing Company Ltd 321.00 6263.10 4.87 65.91 3.37 31.00
- 2. QUARTERLY HIGHLIGHTS (PARENT BASIS) Results Updates- Q1 FY16, Months June-15 June-14 % Change Net Sales 1090.81 1027.62 6.15 PAT 159.75 144.39 10.64 EPS 3.36 3.04 10.64 EBITDA 360.48 296.39 21.62 The company’s net profit jumps to Rs. 159.75 million against Rs. 144.39 million in the corresponding quarter ending of previous year, an increase of 10.64%. Revenue for the quarter rose by 6.15% to Rs. 1090.81 million from Rs. 1027.62 million, when compared with the prior year period. Reported earnings per share of the company stood at Rs. 3.36 a share during the quarter, registering 10.64% increase over previous year period. Profit before interest, depreciation and tax is Rs. 360.48 million as against Rs. 296.39 million in the corresponding period of the previous year. Break up of Expenditure Break up of Expenditure Rs. in Mn Q1 FY16 Q1 FY15 % Change Cost of Material Consumed 495.90 493.96 0% Employee Benefit Expenses 186.76 149.78 25% Depreciation & Amortization Expense 54.58 50.44 8% Other Expenses 145.53 120.92 20%
- 3. Segment Revenue Latest Updates • ICRA has upgraded the Company's long term rating from ICRA A plus to ICRA AA minus and that of short term rating from ICRA A one to ICRA A one Plus with a comment that the outlook on the long term rating is stable. • Kitex Garments Ltd has been selected in the 11 Companies which has appeared in the top 200 Asia Pacific Corporations in Forbes Asia’s ‘Best Under A Billion List’ which was released in Singapore. COMPANY PROFILE Kitex Garments Limited is based in Kochi, India. Kitex Garments Ltd. was incorporated in 1992. It made its public issue in the year 1995. Kitex Garments Ltd is the largest employer in private sector in the state of Kerala. It is located near Kochi and has easy access to sea and air ports. It is promoted by Boby M Jacob, Kitex Exports Ltd, Sabu M Jacob and Somy Varghese. Kitex Garments Limited is in the business of manufacturing and exporting garments. The Company manufactures different types of garments, such as hosiers, shirts, pants, jackets, innerwear and outerwear. The company currently employs over 7000 people at its facility, and has been a business provider to many satellite businesses in the state. Having started with INR 1.8 Crores turnover in the year 1995-96, the company has now grown to a turnover of over INR 524 Crores in 2014-15. The company is currently the second largest producer of children's apparel in the world, and is now in the process of setting up operations in the United States of America.
- 4. FINANCIAL HIGHLIGHT (PARENT BASIS) (A*- Actual, E* -Estimations & Rs. In Millions) Balance Sheet as at March 31, 2014 -2017E FY14A FY15A FY16E FY17E SOURCES OF FUNDS Shareholder's Funds Share Capital 47.50 47.50 47.50 47.50 Reserves and Surplus 1694.19 2591.25 3057.68 3577.48 1. Sub Total - Net worth 1741.69 2638.75 3105.18 3624.98 Non Current Liabilities Long term Borrowings 289.14 268.37 246.90 232.09 Deferred Tax Liabilities 216.06 225.86 237.15 246.64 Long term Provisions 23.32 32.83 37.75 42.66 2. Sub Total - Non Current Liabilities 528.52 527.06 521.81 521.39 Current Liabilities Short term Borrowings 905.12 1139.13 1287.22 1403.07 Trade Payables 244.17 197.24 224.85 245.09 Other Current Liabilities 304.59 351.02 393.14 424.59 Short Term Provisions 313.37 499.65 579.59 660.74 3. Sub Total - Current Liabilities 1767.25 2187.04 2484.81 2733.49 Total Liabilities (1+2+3) 4037.46 5352.85 6111.79 6879.86 APPLICATION OF FUNDS Non-Current Assets Fixed Assets i. Tangible Assets 1809.11 1878.69 1972.62 2076.96 ii. Intangible Assets 2.95 3.58 4.12 4.61 iii. Capital work-in-progress 6.66 2.92 3.21 3.47 a) Sub Total Fixed Assets 1818.72 1885.19 1979.95 2085.04 b) Non-current investments 0.04 0.04 0.06 0.07 c) Long Term loans and advances 28.01 35.68 43.53 50.49 d) Other non-current assets 17.33 20.02 22.62 25.34 1. Sub Total - Non Current Assets 1864.10 1940.93 2046.17 2160.95 Current Assets Inventories 108.00 112.03 117.63 123.51 Trade receivables 530.64 626.60 720.59 814.27 Cash and Bank Balances 1036.09 2032.58 2452.58 2869.52 Short-terms loans & advances 342.10 462.01 572.89 687.47 Other current assets 156.53 178.70 201.93 224.14 2. Sub Total - Current Assets 2173.36 3411.92 4065.62 4718.91 Total Assets (1+2) 4037.46 5352.85 6111.79 6879.86
- 5. Annual Profit & Loss Statement for the period of 2014 to 2017E Value(Rs.in.mn) FY14A FY15A FY16E FY17E Description 15m 12m 12m 12m Net Sales 4422.10 5110.96 5826.49 6583.94 Other Income 133.44 134.23 155.71 163.49 Total Income 4555.54 5245.19 5982.20 6747.43 Expenditure -3470.72 -3423.59 -3839.66 -4345.40 Operating Profit 1084.82 1821.60 2142.54 2402.03 Interest -106.16 -191.64 -210.80 -227.67 Gross profit 978.66 1629.96 1931.74 2174.36 Depreciation -96.80 -213.29 -238.88 -265.16 Profit Before Tax 881.86 1416.67 1692.85 1909.20 Tax -308.17 -431.50 -553.56 -620.49 Net Profit 573.69 985.17 1139.29 1288.71 Equity capital 47.50 47.50 47.50 47.50 Reserves 1694.19 2591.25 3057.68 3577.48 Face value 1.00 1.00 1.00 1.00 EPS 12.08 20.74 23.99 27.13 Quarterly Profit & Loss Statement for the period of 31st Dec, 2014 to 30th Sep, 2015E Value(Rs.in.mn) 31-Dec-14 31-Mar-15 30-Jun-15 30-Sep-15E Description 3m 3m 3m 3m Net sales 1220.98 1580.34 1090.81 1287.16 Other income 50.97 6.30 58.98 47.18 Total Income 1271.95 1586.64 1149.79 1334.34 Expenditure -801.79 -920.73 -789.31 -868.83 Operating profit 470.16 665.91 360.48 465.51 Interest -65.51 -49.46 -47.73 -50.59 Gross profit 404.65 616.45 312.75 414.92 Depreciation -52.80 -58.29 -54.58 -56.76 Profit Before Tax 351.85 558.16 258.17 358.15 Tax -120.54 -141.88 -98.42 -118.73 Net Profit 231.31 416.28 159.75 239.43 Equity capital 47.50 47.50 47.50 47.50 Face value 1.00 1.00 1.00 1.00 EPS 4.87 8.76 3.36 5.04
- 6. Ratio Analysis Particulars FY14A FY15A FY16E FY17E EPS (Rs.) 12.08 20.74 23.99 27.13 EBITDA Margin (%) 24.53 35.64 36.77 36.48 PBT Margin (%) 19.94 27.72 29.05 29.00 PAT Margin (%) 12.97 19.28 19.55 19.57 P/E Ratio (x) 67.14 39.10 33.81 29.89 ROE (%) 32.94 37.33 36.69 35.55 ROCE (%) 40.25 50.29 51.33 50.71 Debt Equity Ratio 0.69 0.53 0.49 0.45 EV/EBITDA (x) 35.65 20.80 17.55 15.52 Book Value (Rs.) 36.67 55.55 65.37 76.32 P/BV 22.12 14.60 12.41 10.63 Charts
- 7. OUTLOOK AND CONCLUSION At the current market price of Rs.810.95, the stock P/E ratio is at 33.81 x FY16E and 29.89 x FY17E respectively. Earning per share (EPS) of the company for the earnings for FY16E and FY17E is seen at Rs.23.99 and Rs.27.13 respectively. Net Sales and PAT of the company are expected to grow at a CAGR of 20% and 45% over 2014 to 2017E respectively. On the basis of EV/EBITDA, the stock trades at 17.55 x for FY16E and 15.52 x for FY17E. Price to Book Value of the stock is expected to be at 12.41 x and 10.63 x for FY16E and FY17E respectively. We expect that the company surplus scenario is likely to continue for the next two to three years, will keep its growth story in the coming quarters also. Hence, we recommend ‘BUY’ for ‘Kitex Garments Ltd’ with a target price of Rs. 895.00 for medium to long term investment.
- 8. INDUSTRY OVERVIEW Indian Textile & Apparel Sector India has a share of 25 per cent in the global spinning capacity. India produces 20 per cent of global cotton supply both for domestic use and for export. The country ranks No.2 in global textile and apparel exports with nine per cent growth since 1995. About 27 per cent of the foreign exchange earnings are on account of export of textiles and clothing alone. The textile industry accounts for 21 percent of the total employment generated in the economy. Indian Apparel Exports Though most of the industry segments are witnessing a contraction in exports, according to US department of commerce’s Office of Textiles and Apparel (OTEXA) data between January and October 2014, Indian textile and apparel exports to the US rose nearly 6.5 per cent. As per the DGCSI – India statistics the garments segment witnessed a growth of 16% during April-December (FY15) as against the same period in (FY14). The overall textile and garment exports, is expected to reach $41 billion in 2014-15, compared with $39.3 billion in the previous year. Overview of Infantwear Children’s wear market in which Infantwear is a segment, is one of the most profitable segments in the global apparel industry and is estimated to hit a value of 173.6 billion dollars by 2017. In developed economies, although birth rates are generally in a downtrend, parents are spending more on their children, offering a wealth of opportunities for babies and children’s products. The industry also has great potential in the BRIC countries, given the sheer size of the population of babies and children and the burgeoning middle class. At this point, Europe and the U.S are the major consumers of the global children wear market. Disclaimer: This document is prepared by our research analysts and it does not constitute an offer or solicitation for the purchase or sale of any financial instrument or as an official confirmation of any transaction. The information contained herein is from publicly available data or other sources believed to be reliable but we do not represent that it is accurate or complete and it should not be relied on as such. Firstcall Research or any of its affiliates shall not be in any way responsible for any loss or damage that may arise to any person from any inadvertent error in the information contained in this report. Firstcall Research and/ or its affiliates and/or employees will not be liable for the recipients’ investment decision based on this document.
- 9. Firstcall India Equity Research: Email – info@firstobjectindia.com C.V.S.L.Kameswari Pharma & Diversified U. Janaki Rao Capital Goods B. Anil Kumar Auto, IT & FMCG M. Vinayak Rao Diversified G. Amarender Diversified Firstcall Research Provides Industry Research on all the Sectors and Equity Research on Major Companies forming part of Listed and Unlisted Segments For Further Details Contact: Tel.: 022-2527 2510/2527 6077 / 25276089 Telefax: 022-25276089 040-20000235 /20000233 E-mail: info@firstobjectindia.com www.firstcallresearch.com