Buy Abbott India; Pharma sector to grow at CAGR of 20% over next 5 years
•
2 gefällt mir•539 views


Empfohlen
Empfohlen
Weitere ähnliche Inhalte
Was ist angesagt?
Was ist angesagt? (19)
Andere mochten auch
Andere mochten auch (10)
Ähnlich wie Buy Abbott India; Pharma sector to grow at CAGR of 20% over next 5 years
Ähnlich wie Buy Abbott India; Pharma sector to grow at CAGR of 20% over next 5 years (18)
Mehr von IndiaNotes.com
Mehr von IndiaNotes.com (19)
Buy Abbott India; Pharma sector to grow at CAGR of 20% over next 5 years
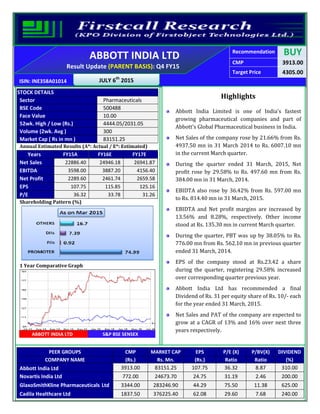
- 1. Recommendation BUY CMP 3913.00 Target Price 4305.00 ISIN: INE358A01014 JULY 6th 2015 ABBOTT INDIA LTD Result Update (PARENT BASIS): Q4 FY15 STOCK DETAILS Sector Pharmaceuticals BSE Code 500488 Face Value 10.00 52wk. High / Low (Rs.) 4444.05/2031.05 Volume (2wk. Avg ) 300 Market Cap ( Rs in mn ) 83151.25 Annual Estimated Results (A*: Actual / E*: Estimated) Years FY15A FY16E FY17E Net Sales 22886.40 24946.18 26941.87 EBITDA 3598.00 3887.20 4156.40 Net Profit 2289.60 2461.74 2659.58 EPS 107.75 115.85 125.16 P/E 36.32 33.78 31.26 Shareholding Pattern (%) 1 Year Comparative Graph ABBOTT INDIA LTD S&P BSE SENSEX Highlights Abbott India Limited is one of India's fastest growing pharmaceutical companies and part of Abbott's Global Pharmaceutical business in India. Net Sales of the company rose by 21.66% from Rs. 4937.50 mn in 31 March 2014 to Rs. 6007.10 mn in the current March quarter. During the quarter ended 31 March, 2015, Net profit rose by 29.58% to Rs. 497.60 mn from Rs. 384.00 mn in 31 March, 2014. EBIDTA also rose by 36.42% from Rs. 597.00 mn to Rs. 814.40 mn in 31 March, 2015. EBIDTA and Net profit margins are increased by 13.56% and 8.28%, respectively. Other income stood at Rs. 135.30 mn in current March quarter. During the quarter, PBT was up by 38.05% to Rs. 776.00 mn from Rs. 562.10 mn in previous quarter ended 31 March, 2014. EPS of the company stood at Rs.23.42 a share during the quarter, registering 29.58% increased over corresponding quarter previous year. Abbott India Ltd has recommended a final Dividend of Rs. 31 per equity share of Rs. 10/- each for the year ended 31 March, 2015. Net Sales and PAT of the company are expected to grow at a CAGR of 13% and 16% over next three years respectively. PEER GROUPS CMP MARKET CAP EPS P/E (X) P/BV(X) DIVIDEND COMPANY NAME (Rs.) Rs. Mn. (Rs.) Ratio Ratio (%) Abbott India Ltd 3913.00 83151.25 107.75 36.32 8.87 310.00 Novartis India Ltd 772.00 24673.70 24.75 31.19 2.46 200.00 GlaxoSmithKline Pharmaceuticals Ltd 3344.00 283246.90 44.29 75.50 11.38 625.00 Cadila Healthcare Ltd 1837.50 376225.40 62.08 29.60 7.68 240.00
- 2. QUARTERLY HIGHLIGHTS Net Sales of the company rose by 21.66% from Rs. 4937.50 mn to Rs. 6007.10 mn in the current march quarter. Net profit rose by 29.58% to Rs. 497.60 mn from Rs. 384.00 mn in 31 March, 2014. EBIDTA also rose by 36.42% from Rs. 597.00 mn to Rs. 814.40 mn. EBIDTA and Net profit margins are increased by 13.56% and 8.28%, respectively. Other income stood at Rs. 135.30 mn in current March quarter. Break up of Expenditure: Company Profile Abbott India Limited is one of India's fastest growing pharmaceutical companies and part of Abbott's Global Pharmaceutical business in India. Headquartered in Mumbai, Abbott India Limited, a publicly listed company and a subsidiary of Abbott Laboratories, enjoys strong brand equity in multiple therapeutic categories such as Women's Health, Gastroenterology, Neurology, Thyroid, Diabetes & Urology, Pain Management, Vitamins, Anti- Infectives & other therapy areas. Abbott India Limited's success is driven by a combination of a highly competent and motivated commercial team, R&D backed products, aided by strong alliances and partnerships. The company has a state-of-the-art formulation plant at Verna, Goa. The manufacturing plant is designed to produce high quality, high volume formulations using cost efficient processes and has well equipped laboratories and trained personnel to ensure compliance with international quality standards. The company has in-house development and medical teams to undertake product and clinical development tailored to needs of the Indian market. Abbott India Limited believes in providing quality healthcare through a mix of global and local products which directly affect the life of the common Indian. Months Mar-15 Mar-14 % Change Net Sales 6007.10 4937.50 21.66 Net Profit 497.60 384.00 29.58 Net Profit Margin 8.28% 7.78% 50BP EBITDA 814.40 597.00 36.42 EBIDTA Margin 13.56% 12.09% 147BP Other Income 135.30 93.90 44.09 Rs. In Million Mar-15 Mar-14 CHNG % Cost of Material 868.40 595.20 46% Employee Benefit Exp 767.20 684.90 12% Dep. & Amortization 33.80 34.80 -3% Other Exp 1081.40 955.60 13% Purchase of Stock-in-Trade 2282.60 1706.80 34%
- 3. FINANCIAL STATEMENTS & ESTIMATIONS (PARENT BASIS) (A*- Actual, E* -Estimations & Rs. In Millions) Balance Sheet as on March 31, 2014 to March 31, 2017E Abbott India Ltd. As at Mar’14 As at Mar’15 As at Mar’16E As at Mar’17E SOURCES OF FUNDS Shareholder's Funds • Share Capital 212.50 212.50 212.50 212.50 • Reserves and Surplus 7666.02 9162.80 10812.10 12542.04 Sub Total - Net worth (a) 7878.52 9375.30 11024.60 12754.54 Non Current Liabilities • Long term Provisions 573.44 391.60 368.10 379.15 Sub Total - Non Current liabilities (b) 573.44 391.60 368.10 379.15 Current Liabilities • Trade payables 1362.20 1935.60 2187.23 2405.95 • Other Current liabilities 1038.66 1440.30 1555.52 1648.86 • Short term Provisions 539.09 593.50 635.05 673.15 Sub Total - Current Liabilities (c) 2939.95 3969.40 4377.80 4727.95 Total Liabilities (a + b + c) 11391.91 13736.30 15770.51 17861.64 APPLICATION OF FUNDS Non-Current Assets • Fixed Assets 995.24 999.50 1049.48 1091.45 • Deferred Tax Asset 12.76 65.30 75.10 85.61 • Long Term loans and advances 334.69 388.00 442.32 486.55 • Other non-current assets 20.19 22.40 24.64 27.10 Sub Total - Non Current Assets (d) 1362.88 1475.20 1591.53 1690.72 Current Assets • Inventories 3655.09 3841.30 4071.78 4275.37 • Trade receivables 1091.75 1291.50 1498.14 1707.88 • Cash and Bank Balances 4628.42 6438.90 7839.47 9343.36 • Short-terms loans & advances 590.84 528.70 581.57 628.10 • Other current assets 62.93 160.70 188.02 216.22 Sub Total - Current Assets (e) 10029.03 12261.10 14178.98 16170.92 Total Assets (d+e) 11391.91 13736.30 15770.51 17861.64
- 4. Annual Profit & Loss Statement for the period of FY2014 to FY2017E Value(Rs.in.mn) FY-14A FY-15A FY-16E FY-17E Description 15m 12m 12m 12m Net Sales 22968.90 22886.40 24946.18 26941.87 Other Income 482.20 475.50 494.52 519.25 Total Income 23451.10 23361.90 25440.70 27461.12 Expenditure -20285.50 -19763.90 -21553.50 -23304.72 Operating Profit 3165.60 3598.00 3887.20 4156.40 Interest -0.80 -5.00 -4.40 -3.96 Gross profit 3164.80 3593.00 3882.80 4152.44 Depreciation -219.30 -149.40 -161.35 -171.03 Profit Before Tax 2945.50 3443.60 3721.45 3981.41 Tax -961.00 -1154.00 -1259.71 -1321.83 Profit After Tax 1984.50 2289.60 2461.74 2659.58 Equity capital 212.50 212.50 212.50 212.50 Reserves 7666.02 9162.80 10812.10 12542.04 Face value 10.00 10.00 10.00 10.00 EPS 93.39 107.75 115.85 125.16 Quarterly Profit & Loss Statement for the period of 30th Sep, 2014 to 30th June, 2015E Value(Rs.in.mn) 30-Sep-14 31-Dec-14 31-Mar-15 30-Jun-15E Description 3m 3m 3m 3m Net sales 5887.10 5735.40 6007.10 6307.46 Other income 122.10 126.00 135.30 127.18 Total Income 6009.20 5861.40 6142.40 6434.64 Expenditure -5007.00 -4876.90 -5328.00 -5487.49 Operating profit 1002.20 984.50 814.40 947.15 Interest -0.10 -0.20 -4.60 -2.85 Gross profit 1002.10 984.30 809.80 944.30 Depreciation -44.30 -36.40 -33.80 -36.50 Profit Before Tax 957.80 947.90 776.00 907.80 Tax -320.40 -302.60 -278.40 -306.38 Profit After Tax 637.40 645.30 497.60 601.41 Equity capital 212.50 212.50 212.50 212.50 Face value 10.00 10.00 10.00 10.00 EPS 30.00 30.37 23.42 28.30
- 5. Ratio Analysis Particulars FY-14A FY-15A FY-16E FY-17E EPS (Rs.) 93.39 107.75 115.85 125.16 EBITDA Margin (%) 13.78% 15.72% 15.58% 15.43% PBT Margin (%) 12.82% 15.05% 14.92% 14.78% PAT Margin (%) 8.64% 10.00% 9.87% 9.87% P/E Ratio (x) 41.90 36.32 33.78 31.26 ROE (%) 25.19% 24.42% 22.33% 20.85% ROCE (%) 42.96% 39.97% 36.72% 33.93% EV/EBITDA (x) 24.81 21.32 19.37 17.76 Book Value (Rs.) 370.75 441.19 518.80 600.21 P/BV 10.55 8.87 7.54 6.52 Charts
- 6. Outlook and Conclusion At the current market price of Rs.3913.00, the stock P/E ratio is at 33.78 x FY16E and 31.26 x FY17E respectively. Earning per share (EPS) of the company for the earnings for FY16E and FY17E is seen at Rs.115.85 and Rs. 125.16 respectively. Net Sales and PAT of the company are expected to grow at a CAGR of 13% and 16% over next three years respectively. On the basis of EV/EBITDA, the stock trades at 19.37 x for FY16E and 17.76 x for FY17E. Price to Book Value of the stock is expected to be at 7.54 x and 6.52 x for FY16E and FY17E respectively. We recommend ‘BUY’ in this particular scrip with a target price of Rs.4305.00 for Medium to Long term investment. Industry Overview The Indian pharmaceuticals market is third largest in terms of volume and thirteen largest in terms of value, as per a pharmaceuticals sector analysis report by equity master. The market is dominated majorly by branded generics which constitute nearly 70 to 80 per cent of the market. Considered to be a highly fragmented industry, consolidation has increasingly become an important feature of the Indian pharmaceutical market. India has achieved an eminent global position in pharma sector. The country also has a huge pool of scientists and engineers who have the potential to take the industry to a very high level. Market Size The Indian pharmaceutical industry is estimated to grow at 20 per cent compound annual growth rate (CAGR) over the next five years, as per India Ratings, a Fitch Group company. Indian pharmaceutical manufacturing facilities registered with US Food and Drug Administration (FDA) as on March 2014 was the highest at 523 for any country outside the US. Investments The Union Cabinet has given its approval to amend the existing FDI policy in the pharmaceutical sector in order to cover medical devices. The Cabinet has allowed FDI up to 100 per cent under the automatic route for manufacturing of medical devices subject to specified conditions.
- 7. The drugs and pharmaceuticals sector attracted cumulative foreign direct investment (FDI) inflows worth US$ 12,813.02 million between April 2000 and December 2014, according to data released by the Department of Industrial Policy and Promotion (DIPP). Some of the major investments in the Indian pharmaceutical sector are as follows: • Stelis Biopharma has announced the ground-breaking for construction of its customised, multi-product, biopharmaceutical manufacturing facility at Bio-Xcell Biotechnology Park in Nusajaya, Johor, Malaysia's park and ecosystem for industrial and healthcare biotechnology at a total project investment amount of US$ 60 million. • Strides Arcolab has entered into a licensing agreement with US-based Gilead Sciences Inc to manufacture and distribute the latter's low-cost Tenofovir Alafenamide (TAF) product used for HIV treatment in developing countries. The licence to manufacture Gilead's low-cost drug extends to 112 countries. • Cadila Healthcare Ltd has announced the launch of a biosimilar for Adalimumab - the world’s largest selling drug for rheumatoid arthritis and other auto immune disorders. • Torrent Pharmaceuticals has entered into an exclusive licensing agreement with Reliance Life Sciences for marketing three biosimilars in India — Rituximab, Adalimumab and Cetuximab. • Piramal Enterprises Ltd has acquired US-based Coldstream Laboratories for US$ 30.6 million in an all- cash transaction. • Indian Immunologicals Ltd (IIL) plans to set up a new vaccine manufacturing facility in Pondicherry with an investment of Rs 300 crore (US$ 48.53 million). • SRF Ltd has acquired Global DuPont Dymel, the pharmaceutical propellant business of DuPont, for US$ 20 million. Government Initiatives The Government of India has unveiled 'Pharma Vision 2020' aimed at making India a global leader in end-to-end drug manufacture. It has reduced approval time for new facilities to boost investments. Further, the government has also put in place mechanisms such as the Drug Price Control Order and the National Pharmaceutical Pricing Authority to address the issue of affordability and availability of medicines. Road Ahead The Indian pharma market size is expected to grow to US$ 85 billion by 2020. The growth in Indian domestic market will be on back of increasing consumer spending, rapid urbanisation, raising healthcare insurance and so on.
- 8. Going forward, better growth in domestic sales will depend on the ability of companies to align their product portfolio towards chronic therapies for diseases such as such as cardiovascular, anti-diabetes, anti-depressants and anti-cancers are on the rise. Moreover, the government has been taking several cost effective measures in order to bring down healthcare expenses. Thus, governments are focusing on speedy introduction of generic drugs into the market. This too will benefit Indian pharma companies. In addition, the thrust on rural health programmes, life saving drugs and preventive vaccines also augurs well for the pharma companies. Disclaimer: This document is prepared by our research analysts and it does not constitute an offer or solicitation for the purchase or sale of any financial instrument or as an official confirmation of any transaction. The information contained herein is from publicly available data or other sources believed to be reliable but we do not represent that it is accurate or complete and it should not be relied on as such. Firstcall Research or any of its affiliates shall not be in any way responsible for any loss or damage that may arise to any person from any inadvertent error in the information contained in this report. Firstcall Research and/ or its affiliates and/or employees will not be liable for the recipients’ investment decision based on this document.
- 9. Firstcall India Equity Research: Email – info@firstobjectindia.com C.V.S.L.Kameswari Pharma & Diversified U. Janaki Rao Capital Goods B. Anil Kumar Auto, IT & FMCG M. Vinayak Rao Diversified G. Amarender Diversified Firstcall Research Provides Industry Research on all the Sectors and Equity Research on Major Companies forming part of Listed and Unlisted Segments For Further Details Contact: Tel.: 022-2527 2510/2527 6077 / 25276089 Telefax: 022-25276089 040-20000235 /20000233 E-mail: info@firstobjectindia.com www.firstcallresearch.com