Nagaland's First Metro Cable Project Proposed for Kohima
•Als PPTX, PDF herunterladen•
3 gefällt mir•1,131 views

WORKSHOP CABLE CAR SHIMLA PRESENTATION FINAL 26 JUN 2014 Dr Toshimanen Ozukum

Empfohlen
Empfohlen
Weitere ähnliche Inhalte
Was ist angesagt?
Was ist angesagt? (16)
Andere mochten auch
Andere mochten auch (16)
Ähnlich wie Nagaland's First Metro Cable Project Proposed for Kohima
Ähnlich wie Nagaland's First Metro Cable Project Proposed for Kohima (20)
Mehr von IPPAI
Mehr von IPPAI (20)
Nagaland's First Metro Cable Project Proposed for Kohima
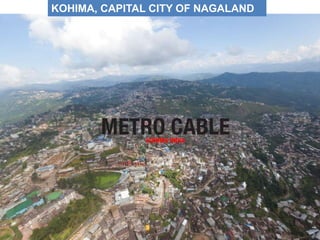
- 1. KOHIMA, CAPITAL CITY OF NAGALAND
- 2. NAGALAND: NORTH-EASTERN STATE OF INDIA
- 3. LAND SLIDE: ROAD CONDITIONS
- 4. MAN-MADE DAMAGE TO THE ENVIRONMENT
- 5. HAPHAZARD CONSTRUCTION OVER AGES
- 7. NO SPACE FOR PLAY GROUNDS
- 8. CLEAN ROOF TOPS AFTER ARRIVAL OF METRO CABLE
- 9. ROUTE PLAN: KOHIMA METRO CABLE
- 10. HUBS OF ACTIVITY: NEW SECRETARIATE
- 11. SCIENCE COLLEGE
- 13. KOHIMA METRO CABLE NETWORK OPTION (Maximum Spanning Tree – LEFT & Minimum Spanning Tree – RIGHT)
- 14. DRAFT PROPOSAL TO GOVT. OF NAGALAND
- 16. A B F E D C G H J PHASING OF METRO CABLE PROJECT
- 17. SITE PROPOSAL STATIONS, SEGMENTS & PHASING
- 18. SCOPE OF ADDITIONAL PROGRAMS
- 20. LOCATION: STATION ‘A’ SECRETARIATE
- 21. STATION ‘A’ : PLOT AREA SECRETARIAT
- 22. ROUTE BETWEEN ‘A’ & ‘B’ STATIONS:
- 23. LOCATION: STATION ‘B’ HIGH SCHOOL
- 24. STATION ‘B’ : PLOT AREA HIGH SCHOOL
- 25. LOCATION: STATION ‘C’ OLD SECRETARIATE
- 26. STATION ‘C’ : PLOT AREA OLD SECRETARIATE
- 27. ROUTE/TERRAIN BETWEEN STN. ‘B’ & STN. ‘C’
- 28. LOCATION: STATION ‘D’ : POLICE HQs
- 29. STATION ‘d’ : PLOT AREA POLICE HQs
- 30. ROUTE/TERRAIN BETWEEN STATIONS ‘C’ & ‘D’
- 31. LOCATION: STATION ‘E’ MINISTER HILL
- 32. STATION ‘E’ : PLOT AREA MINISTER HILL
- 33. ROUTE/TERRAIN BETWEEN STATION S ‘D’ & ‘E’
- 34. LOCATION STATION ‘F’ : PLOT AREA Sc. COLLEGE
- 35. STATION ‘F’ : PLOT AREA Sc. COLLEGE
- 36. ROUTE/TERRAIN BETWEEN STATION S‘E’ & ‘F’
- 37. A. Phase - I Symbol Unit Length 1. High School - Old Secretariat B-C Km 2.90 2. Old Secretariat - Police HQ C-D Km 1.38 Total (A) 4.28 B. Phase - II 3. Secretariat - High School A-B Km 1.71 4. Police HQ - Minister Hill D-E Km 0.87 5. Minister Hill - Science College E-F Km 1.91 Total (B) 4.49 Total (A + B) 8.77 SUMMARY OF THE METRO CABLE PROJECT
- 38. Sl.No Parameters STATIONS High School Old Secretariat Police Hq 1 Land Acquisition required No No No 2 Loss of Private land No No No 3 Loss of Government Land Yes Yes Yes 4 Loss of Community Land No No No 5 Any Encroachment Yes No No 6 Loss of livelihood None None None 7 Number of HHs likely to be affected 10 None None 8 Number of Structures likely to be affected 1 private building None 2 Govt buildings 9 Number of trees likely to be affected 7-10 small trees about 100 trees None 10 Loss of Common Properties/ Resources (CPR) School Playground 11 Any Public amenities to be affected Toilet block None ATM /toilet and Taxi stand 12 Any form of stakeholders consultation conducted No No No RESETTLEMENT IMPACT AT THE THREE LOCATIONS
- 39. ROUTING OF METRO CABLE
- 42. STATIONS & TOWERS : METRO CABLE
- 46. STATION & CABLE CAR PARKING
- 47. 0 500 1000 1500 2000 2500 3000 3500 4000 4500 6amto7am 7amto8am 8amto9am 9amto10am 10amto11am 11amto12pm 12pmto1pm 1pmto2pm 2pmto3pm 3pmto4pm 4pmtp5pm 5pmto6pm 6pmto7pm 7pmto8pm SystemRidership Hour of the Day SYSTEM RIDERSHIP DURING THE DAY
- 48. - 10,000 20,000 30,000 40,000 50,000 60,000 1 2 3 4 5 6 7 8 9 10 11 12 13 14 15 Ridership Year of Operation
- 49. Trip Origin Destination First Year Ridership Fifteenth Year Ridership High School to Police HQ 29,440 36,160 High School to Old Secretariat 7,360 9,040 Old Secretariat to Police HQ 7,360 9,040 Total Ridership 44,160 54,240 DISTRIBUTION OF DAILY RIDERSHIP BETWEEN STATIONS
- 50. LAND USE Area (Ha) Percent Residential 533.6 7.85 Commercial 16.83 0.25 Administrative 3065 45.07 Industrial 2.4 0.04 Recreational 3.37 0.05 Transportation 4.6 0.07 Paramilitary Forces, Nagaland Police 36.7 0.54 Agricultural land use 208.63 3.07 Cremation Ground, Burial grounds and water bodies 3.56 0.05 Jhum cultivation 28.6 0.42 Conservation Area 2897.5 42.61 Total 6,801 100.00 KOHIMA MASTER PLAN AREA, LAND USE 2001
- 51. Facts & Figures Bus Governing Body Private operators Operating Time 8:00 –17:00 hrs Fleet size 96 Fleet utilization 66 Total Route Length 13 km No. of routes 12 No. ofStops/stands 10 Average distance between stop 2.5 km Daily Ridership(pass/day) 16,500 Trips in peak period 59% of total ridership Capacity(seating/Veh) 20-30 Availability of PT per 10000 0.55 Avg.Age of Vehicle 12 years SUMMARY OF PRIVATE BUS IN KOHIMA
- 52. MEANS OF TRANSPORT UPHILL [G CO2/PKM] PLANE [G CO2/PKM] Car - diesel >2 l piston capacity 604,14 192,40 Car - gasoline > 2 l piston capacity 780,60 248,60 Electric train n.a. 30,00 Regular bus 120,89 38,50 Ropeways San Agustin (winter 100%) 28,58 23,07 Ropeways San Agustin (summer 100%) 23,41 18,16 ENVIRONMENT IMPACT ASSESSMENT
- 53. PROJECT ACTIVITY ANTICIPATED POSITIVE EFFECT ANTICIPATED NEGATIVE EFFECT Introduction of Metro Cable car system Provision of commercial activities within the station area Requirement of land for storage of construction materials Reduction in carbon emissions Better urban transport planning Reduction in internal vehicular traffic congestion The immediate direct economic impacts include employment during construction and operation phase Better urban economic, environmental and living conditions More employment generation and economic development through Transit oriented commercial development Due to the proposed Cable station at three locations, number of households residing nearby may be affected during construction phase Impacts related to land acquisition like loss of livelihood; house or property will be minimized through adequate compensation. The affected people need to be compensated as per the project entitlement framework. GENERAL SOCIO ECONOMIC IMPACT KOHIMA METRO CABLE
- 54. Assumptions In order to assess the overall financial viability of the project, certain logical assumptions have been made. These are: •The gestation period of the project has been assumed to be 2 years from the date of availability of funds. •Contingencies for the project have been assumed at the rate of 3%. •Operational hours of the Metro Cable post operation have been assumed to be 14 hours per day. •It is assumed that the cable car would be running 365 days a year. •The initial fare has been fixed at the rate of Rs. 6.50 per Km and has been escalated at the rate of 15% every five years. •Power expenses have been assumed to be 15% of the Revenue. •Operating expenses have been assumed @ 5% of the initial project cost, increasing at the rate of 2% every year. •Maintenance expenses have been assumed to be 1% of the initial project cost escalating at the rate of 5% every year. •Depreciation has been provided based on SLV method assuming the project life to be 50 years. •It is assumed that there would be no income tax liability for the first 10 years on account of tax holiday. ASSUMPTIONS : KOHIMA METRO CABLEW
- 55. S. No. Cost Head Amount (INR) 1 System components 18288,57,455 2 Rotatable spares (1 year) 1956,87,748 3 Demolition / Compensation 450,00,000 4 Civil Work 3403,83,765 5 Stations 10795,15,155 6 Project development/Supervision 2536,68,750 7 Project Consultancy-5% 1871,55,644 8 Preoperative Expenses 180,00,000 9 Insurance 250,00,000 10 Contingency -3% 1191,98,055 Total 40924,66,571 PROJECT COST ESTIMATES
- 56. S. No. O&M Cost Head Initial Year (INR Crores) Fifteenth Year (INR Crores) 1 Power Expenses 5.61 9.10 2 Operating Expenses 20.46 27.00 3 Maintenance 4.09 8.10 4 Major Maintenance 0.00 6.14 5 Insurance 2.00 2.64 6 Contingencies 0.96 1.59 Total 33.13 54.58 ANNUAL O&M COSTS : KOHIMA METRO CABLE
- 57. TRIP ORIGIN DESTINATION RIDERSHIP DISTANCE (KM) REVENUE (INR) High School to Police HQ 29,440 4.28 8,19,021 High School to Old Secretariat 7,360 2.90 1,38,736 Old Secretariat to Police HQ 7,360 1.38 66,019 Total 44,160 10,23,776 TRIP ORIGIN DESTINATION RIDERSHIP DISTANCE (KM) REVENUE (INR) High School to Police HQ 36,160 4.28 13,30,977 High School to Old Secretariat 9,040 2.90 2,25,458 Old Secretariat to Police HQ 9,040 1.38 1,07,287 Total 54,240 16,63,722 AVERAGE DAILY REVENUE FOR OF OPERATIONS AVERAGE DAILY REVENUE FOR OF OPERATIONS
- 58. Scenario 1: Without JnNURM Grant Following rate of return values depict the rate of return on the project without the JnNURM grant. •Economic Rate of Return (EIRR): (-) 6.32% •Financial Rate of Return (FIRR): (-) 7.28% Scenario 2: With JnNURM Grant With the introduction of 90% grant to the project by JnNURM, the rate of return improves significantly •Economic Rate of Return (EIRR): (+) 21.59% •Financial Rate of Return (FIRR): (+) 20.96% FINANCIAL VIABILITY: KOHIMA METRO CABLE
- 59. Sl.No Parameters Station High School Old Secretariat Police Hq 1 Area available ( Sq.m) 5565 2685 1844 2 Area required for construction ( Sq.m) 2234 1820 3242 4 Demolition/Acquisition Area ( Sq.m) 482 2085 SUMMERY OF LAND REQUIRED AT THREE LOCATIONS
- 60. Sl. No. Location Type of Node Description 1 Phool Bari Commercial Center The retail andwholesaleareaof town 2 NST, High School Jn, P.R.Hill Jn,Razhu junction, BOC, and Traffic Terminals/ intersections Regional Bus Terminal ,Major city Bus stops, Taxi stands 3 High school, Science school, MLA hostel, Transportcomm.office,A. G.Point &NagaHospital Educational, Health and Work Center Include activities, Hospital, Educational centers, and institutional 4 Capital Complex Majorwork center Major administrative center of the state FUNCTIONS OF EXISTING TRANSPORT NODES
- 61. 70.49% 10.64% 6.59% 3.17% 0.01% 9.10% CAR BUS TRUCKS LCV TRACTOR NMT TRAFFIC COMPOSITIONS, LASA 2006
- 62. NAME OF LINK / SECTION AVERAGE JOURNEY SPEED (KMPH) South(Chainage186 onNH-39)-North(High School junction on NH 61) Chainage stone 186 on NH-39-CRPF camp Near Lerie 24 CRPF camp to A.G point 17 A.GpointTo P.R hill 17 P.R.HillJunction toPWD Junction 10 P.W.D to TCP gate Junction 24 T.C.Pgate Junction to Razhu Junction 14 RazhuJunction-P. Point 20 P. Point to High School Junction 17 North-South High School Junction-P. Point 25 P. Point-RazhuJunction 10 RazhuJunction-to-T.C.PgateJunction 10 T.C.Pgate Junction-PWD Junction 24 PWDJunction-P.R.HillJunction 20 P.R.HillJunction-A.GpointJunction 17 A.GpointJunction-CRPF camp 21 TRAVEL SPEED ALONG MAIN ARTERIAL ROAD
- 63. Trip Purpose by Taxi (Location-Wise) TRIP PURPOSE BY TAXI(Location-Wise)
- 66. MANAGEMENT STRUCTURE : KOHIMA METRO CABLE
- 67. STATION ‘B’ : PLATFORM PLAN
- 68. STATION ‘B’ : SECTION ‘A’ & ‘B’
- 69. STATION ‘C’ : PLATFORM PLAN
- 70. STATION ‘C’ : SECTION ‘A’ & ‘B’
- 71. STATION ‘D’ : PLATFORM PLAN
- 72. STATION ‘D’ : SECTION ‘A’ & ‘B’