Mega-Vessels, Mega-Alliances and Cascades: Impacts for port operations and the Australia Market
•
2 gefällt mir•1,320 views

This document summarizes a presentation on mega-vessels, mega-alliances, and their impacts on port operations and the Australian market. Key points include: - Container ship sizes and alliance groupings continue growing to achieve economies of scale, posing challenges for port infrastructure and operations. The largest vessels now exceed 18,000 TEUs. - Demand for container shipping has remained subdued in recent years. Major lines are struggling financially despite cost reductions. - Australian ports currently serve vessels up to 6,500 TEUs, constrained by infrastructure in Melbourne. The opening of the new Melbourne port may allow sizes up to 10,000 TEUs. - Further increases in vessel size deploying to Australia

Empfohlen
Empfohlen
Weitere ähnliche Inhalte
Was ist angesagt?
Was ist angesagt? (20)
Ähnlich wie Mega-Vessels, Mega-Alliances and Cascades: Impacts for port operations and the Australia Market
Ähnlich wie Mega-Vessels, Mega-Alliances and Cascades: Impacts for port operations and the Australia Market (20)
Mehr von ICF
Mehr von ICF (20)
Kürzlich hochgeladen
Kürzlich hochgeladen (20)
Mega-Vessels, Mega-Alliances and Cascades: Impacts for port operations and the Australia Market
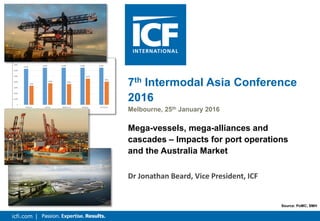
- 1. icfi.com | 7th Intermodal Asia Conference 2016 Melbourne, 25th January 2016 Mega-vessels, mega-alliances and cascades – Impacts for port operations and the Australia Market Dr Jonathan Beard, Vice President, ICF Source: PoMC; SMH 6,300 6,500 6,500 6,500 6,500 3336 3768 3631 4576 4051 0 1,000 2,000 3,000 4,000 5,000 6,000 7,000 Brisbane Sydney Melbourne Adelaide Fremantle Average weekly capacity and largest vessel type (TEU) (2016) Largest Vessel Average weekly Capacity
- 2. 2icfi.com | 2 Container Shipping Industry – Demand Remains Subdued 1990-99, container volumes grew 3.5x rate of global GDP growth; 2000-09 only 2.7x GDP growth; “multiplier” dropped to 2.1x, then to 1.5x in 2012 (~4.6% vs GDP growth of 3.2%) 2015 H1 global merchandise trade (incl. non-containerised) fell 13% yoy Reason for slowdown both cyclical and structural, include: - Economic uncertainty in Europe, US recovery relatively strong - China (fastest growing & 2nd largest economy) slowing down & restructuring away from dependence on exports….possible “hard landing” - China producing more semi-manufactured products - Slowing pace of trade liberalisation Source: ICF based on World Trade Organization (WTO) and National Bureau of Statistics China
- 3. 3icfi.com | 0% 10% 20% 30% 40% 50% 60% APMT HHLA Eurogate DP World ICTSI HPH HPH Trust CMHI PSA EBITDA Margin - CT Operators -40% -30% -20% -10% 0% 10% 20% 30% Maersk CMACGM Hapag‐Lloyd APL Hanjin COSCON MOL OOCL KLine NYK EBITDA Margin - Liners 2009 2010 2011 2012 2013 2014 Port Customers Continue to Struggle Financially Liner unit revenue has decreased placing huge pressure on cost reduction Terminal operators have generated healthy EBITDA margins - carriers have not Some recovery for carriers in 2014, but decline in 2015, despite a ~50% decrease in fuel costs Liners have struggled to sustain any price increases, not least due to capacity over-supply With unit revenue declining, must focus on cost reduction Source: ICF; Annual Reports; SeaIntel Sep 2014 Notes: EBITDA / Revenue Container Ship Capacity vs Demand 2006 = 100 Global Spot Freight Rates
- 4. 4icfi.com | Current Fleet at Jan 16 Order-book at Jan 16 Note: data as of Jan 2016 Source: ICF based on Alphaliner Average Vessel Size by Trade Lane Economies of Scale to Reduce Unit Costs Container vessels getting ever larger: Maersk EEE 18,000TEU, CSCL /MSC 19,000 TEU, OOCL 21,100 TEU ‘Herd’ mentality – where Maersk leads, others quickly follow OOCL order for 6 x 21,100 TEU, for delivery 2017 0 2,000 4,000 6,000 8,000 10,000 12,000 14,000 2011 2012 2013 2014 2015 Eur-N. Am FE-N.Am FE-Eur ME/ISC related Africa related Lat Am Related Oceania Related Intra-FE Intra-Europe Global
- 5. 5icfi.com | 5 0 100 200 300 400 500 600 700 0% 5% 10% 15% 20% 25% 30% Market Share (by Capacity), LH Axis HHI (cumulative), RH Axis Container Shipping Industry Remains Fragmented…. ….but is consolidation finally underway? Limited concentration of industry: top 5 operators account for about 47% of capacity; 86% for top 20 operators. Relatively little consolidation, but change underway? Notes: Herfindahl-Hirschman index (HHI) measure for market concentration widely used by EU Directorate General for Competition, U.S. Federal Maritime Commission (FMC) and U.S. Department of Justice. Calculated by squaring market share of each firm competing in a market, and then summing the resulting numbers. E.g. if only one firm in an industry, that firm would have 100 per cent market share, and HHI would equal 10,000 (100^2), indicating a monopoly. Or, if there hundreds of firms competing, each would have nearly zero market share, and HHI would be close to zero, indicating nearly perfect competition. U.S. DoJ considers a market with HHI <1,000 to be a competitive; 1,000-1,800 to be a moderately concentrated marketplace; and > 1,800 to be a highly concentrated marketplace. As a general rule, mergers that increase the HHI by more than 100 points in concentrated markets raise antitrust concerns Herfindahl-Hirschman index (HHI) for industry of 767, well below the trigger point of 1,000 Much higher for certain routes, where cabotage restrictions limit competition Market Analysis top 20 Carriers
- 6. 6icfi.com | Filling up the mega-vessels New alliances to defray risk of introducing larger vessels in subdued demand conditions… …and secure enough numbers of vessels that are of same magnitude of size to offer fixed or weekly schedule Following P3 rejection, four major alliances created / remain: – 2M: Maersk Line and Mediterranean Shipping Company (MSC) – Ocean Three (O3): CMA CGM, China Shipping Container Lines Co. and United Arab Shipping Co. – The G6 (formed early 2012) serving Asia-Europe and some trans-Pacific routes: Nippon Yusen Kaisha, Hapag-Lloyd AG, Orient Overseas Container Line (OOCL), APL, Hyundai Merchant Marine, and Mitsui O.S.K Lines; – CKYHE Alliance serving Asia-Europe and trans-Pacific (i.e. Asia-West Coast North America), incorporating Cosco, “K” Line, Yang Ming, Hanjin Shipping and Evergreen. Account for significant portions of capacity on major trade lanes Fully accommodating an alliance in key transhipment markets (e.g. SE Asia) may require 8-9 million TEU capacity… ...or mitigate risk with dual hubs (at additional cost) Recent M&A may cause restructuring of alliances Economies of Scale via Larger Alliances Source: Alphaliner; ICF
- 7. 7icfi.com | Major shipping lines demand performance - > 35 moves per crane per hour, 230-250 moves/ship hr @ berth for larger vessels - Reliable berth windows and turnaround time - Maersk EEE seeking 6,000 moves within 24hrs from terminals*….but this requires adequate cargo Major hub ports (& some gateway ports, e.g. Hong Kong) must efficiently accommodate variety of vessels sizes (e.g. from feeder / barges to mother vessels) - flexibility in design Risk/reward: investment requirements are higher but in the absence of base-load import/export (IE) cargo, incentives for largest vessels to call may be insufficient – challenge for smaller transhipment hubs, less so for the major gateway terminals…and major TS hubs? Possible scenario? Winners “lock in” volume and establish a virtuous circle, become mega transhipment (& gateway) hubs; losers see IE volume routed via a third port, increasing cost of import/export Port Planning & Performance Parameters CAPEX for mega-vessels - 18m water depth - long straight quays (1,000m or longer): maximum flexibility - adequate number of cranes with outreach for 23-24 across - land: adequate yard to support quay face operations & large box exchanges (ideally 600-650m av. yard depth / m quay) - capacity to accommodate all alliances partners - inland connectivity (for gateway ports) Source: Maersk * Eivind Kolding, CEO Maersk Line June 2011 Invest to ‘play the game’ or be relegated to second division?
- 8. 8icfi.com | Moving Goal Posts for Investment “The only way to add another 25% [carrying capacity] is in length, as the 18,000 TEU ships are very wide. Also trading flexibility and frequency must be considered; you would need a huge market share to fill them…I just don’t think we can accommodate larger vessels in the foreseeable future, maybe never”. Søren Skou, Maersk CEO, quoted in Container Management, April 2013 However, June 2015 Maersk Line announced $1.8bn contract for 11 vessels of 20,000 TEU (LOA 400m, beam 59m and increased draft of 16.5m.......but now on hold & one EEE laid up) …quickly followed by OOCL order for 6x 21,100 TEU (for delivery 2017) Terminal investment is long-term, but requirements keep changing – how to future proof without over-investing? E.g. investment planning for ship to shore cranes (20-25 year life cycle) - Emma Maersk, 2006: 22 rows across - Marco Polo, 2012: 21 rows across - EEE, 2013: 23 rows across Redeploy cranes, upgrade cranes, replace, etc. Quay may also need strengthening
- 9. 9icfi.com | 6,000 moves per day Requires 250 moves /hr over three shifts for 24 hrs on a regular basis. 19,000-TEU ship would require 8 cranes, each at 31-32 moves /hr, generating berth productivity of 250 moves/hr (MPH) 18,000-TEU box ship is only 25% longer than 7,400-TEU vessel yet has 150% more capacity, hence cranes have to reach further, but difficult to deploy more cranes Therefore 8 cranes per 400m or 1 per 50m: a high crane density Remember - travelling distances increase by 40-50% for mega vessels (13,000 TEUs+ vs Panamax) due to their scale Crane MPH is reduced unless shipping lines proactively plan their stowage to support port productivity: e.g. XVELA cloud based TOS neutral collaborative aid to stowage management Glorious Carrot or Poorly Conceived Stick? Source: MTL; ICF
- 10. 10icfi.com | Push up moves per crane per hour (e.g. new automated terminals at Maasvlakte 2 RWG & APMT: end goal 40) New crane operating arrangements? Need to look at relative costs to achieve a realistic balance (best terminal operators already do this) …sensible cooperation rather than relying on market power. What level of productivity does the line want and will they pay for it? E.g. APMT FastNet Crane legs dictate minimum spacing of one bay, resulting in lost opportunities to maximise production With APMT FastNet cranes are as narrow as a 40ft container – aims to double berth productivity Return on investment? Source: APMT 6,000 moves per day Step change in productivity required?
- 11. 11icfi.com | What Vessel Sizes Currently Serve Australian Ports? <4,000 TEUs decline; 4,000 – 5,100 TEUs have seen significant increase; 5,100-7,500 also growth, but still relatively insignificant in terms of total TEU 0 10 20 30 40 50 60 70 80 90 100 100-999 1,000-1,999 2,000-2,999 3,000-3,999 4,000-5,099 5,100-7,499 7,500-9,999 10,000-20,00 Australia Vessel Profile (2011-2015) 2011 2012 2013 2014 2015 TEU Capacity NumberofVessels Source: ICF Analysis on Alphaliner data (Jun 2011-Jun 2015)
- 12. 12icfi.com | What is the Likely Maximum Size over Medium-term? (I) Largest vessels deployed on the Asia services; reaching 6,350 TEU size – current volumes & port infrastructure are key limits Source: ICF Analysis on Alphaliner data (accessed on 19 Feb, 2016) Container volumes (& calls) are concentrated in Sydney & Melbourne Dominant trading volumes are to & from Asia, transhipped in one of the larger Asian ports Largest vessels are deployed on Asia services, reaching 6,350 / 6,500 TEU (e.g. Hyundai Oakland calling both Sydney & Melbourne) Relatively small size of Australian market & organisation of services, carriers have tended not to have enough cargo to justify larger vessels. Vessel size limits for Australia also determined by lowest capacity envelope out of Melbourne, Sydney & Brisbane Brisbane can currently handle 8,000 TEU (planned increase in draft will permit 8-10,000 TEU). Botany Terminal 3, can handle up to 10,000 TEU. Melbourne is current constraint.
- 13. 13icfi.com | What is the Likely Maximum Size over Medium-term? (II) Australia market infrastructure constraints are at Melbourne, but some easing with opening of VICT Source: ICF Analysis on Alphaliner data (accessed on 19 Feb, 2016) Port Philip Bay channel depth allows max 14m vessel draft with a safe under-keel clearance Swanson docks additional limits: max vessel length (LOA) 300m, airdraft of 50.1m at average high tide (West Gate bridge). Therefore vessel max of 300m LOA and 42.9m beam. ~ 6,500- 7,000 TEU (max 7,030 TEU). But further limits on number of these vessels that can be berthed at once VICT should be able to handle at least 8,000 TEU and likely up to 10,000 TEU Limits / drivers for upshift?
- 14. 14icfi.com | Beyond Infrastructure, What Will Influence Vessel Size Upscaling? NSCs, market volumes, productivity and cascade from larger trades Multiport National Stevedore Contracts offered by current duopoly may limit, but with surplus capacity at all three major ports from end 2016/17, influence should wane Volume growth e.g. 2.5% y-o-y or 4.5%? Call size. Average of 2,500-2,7000 TEUs per week (moves per vessel increase from 1,374 H1 2012 H1 to 1,582 H1 2014, ~15%) – What potential is there for consolidation of services to realise economies of scale? – How might alliances play out on the major trades and what might be the impacts for Australasia market? Productivity – moves per hour need to increase Bunker- “Shale buffer” USD35-75/ barrel of crude? Low prices reduce cost advantage of larger vessels Global increase in sizes may lead to cascade and ‘forced’ adoption of non-optimal sizes. Given continued introduction of ever larger vessels on EU-Asia trades (suffering slow growth), the pressure to remove / cascade smaller vessels (e.g. 8,000 TEU) to other trades will intensify e.g. to S America, Middle East- ISC, Australia / Oceania. Completion of Panama Canal upgrades (~2016 raising vessel cap from ~5,000 TEU to 13,000 TEU) will also trigger an upsizing of vessels on trades currently limited to ~5,000 TEU
- 15. 15icfi.com | Ports, Logistics & Transport Services Regional Contacts Jonathan Beard Hong Kong & Beijing +852.2868.6980 +86.10.6562.8300 jonathan.beard@icfi.com Wai-Duen Lee Hong Kong +852.2868.6980 waiduen.lee@icfi.com Ben Hackett Singapore +65.8653.3263 ben.hackett@icfi.com Thank You – Any Questions? ICF Transportation Projects
- 16. 16icfi.com | ICF - Selected Clients Tiger Global Management, LLC
- 17. 17icfi.com | Appendix: acronyms • GDP Gross Domestic Product • EBITDA Earnings Before Interest, Taxes, Depreciation and Amortization • CSCL China Shipping Container Lines • MSC Mediterranean Shipping Company • TEU Twenty-foot Equivalent Unit • OOCL Orient Overseas Container Line • CMA CGM French shipping line company • M&A Merger & Acquisitions • CAPEX Capital Expenditure • Maersk EEE Maersk Triple E Class Container ships • TOS Transport & Offshore Services • RWG Rotterdam World Gateway • APMT APMT Terminals, an international container terminal operating company • VICT Victoria International Container Terminal • NSCs National Stevedore Contracts