Yuhan Corporation 000100 Algorithm Investment Report
•
0 gefällt mir•61 views

Yuhan Corporation 000100 Algorithm Investment Report
![[Price for scheduled purchasing]
Arbitrarily made
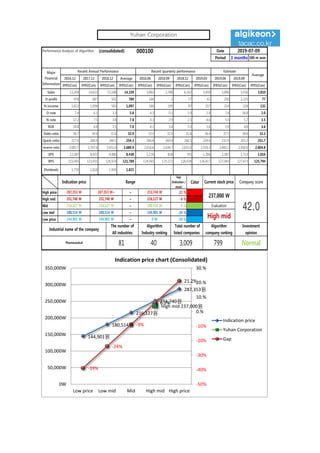
Algorithm stocks Trading Strategies (consolidated) 000100 Date
Period
Gap
(Indication /
stock)
Color
2019-07-09
3 months
Current stock price Evaluation
Stock price rise
probability score
Investment opinion Prospective purchase amount
237,000 W High mid 29.4 Normal 2,000,000 W
Suggested Purchase
Amount 613,805 W
Number of stocks
purchased 3
Indication price Range Buying / Selling Buying / Selling [Stocks]
High price 287,353 W 287,353 W~ ~ 251,740 W 21 % -130,409 W -0
High mid 251,740 W 251,740 W ~ 216,127 W 6 % -38,175 W -0
Mid 216,127 W 216,127 W ~ 180,514 W -9 % 54,059 W 0
Low mid 180,514 W 180,514 W ~ 144,901 W -24 % 146,293 W 1
low price 144,901 W 144,901 W ~ 0 W -39 % 238,527 W 2
Stock price rise
probability score
A Sector 51.0 50.8 49.8 48.8 46.6 46.9
29.4B Sector 46.7 39.6 41.7 48.8 33.8 13.3
Total average
2019.02.12 2019.03.13 2019.04.10 2019.05.10 2019.06.10 2019.07.08
48.8 45.2 45.7 25.0 40.2 30.1
38 % -33 %
2019.03.13 2019.04.10 2019.05.10 2019.06.10 2019.07.08
Total of
increase rate
Total score
A Sector -0 % -2 % -2 % -5 % 1 %
-17 % 38.0B Sector -18 % 5 % 15 % -45 % -153 %
Total average -8 % 1 % -83 %
51 51 50 49 47 4747
40 42
49
34
13
49
45 46
25
40
30
0
10
20
30
40
50
60
2019.02.12 2019.03.13 2019.04.10 2019.05.10 2019.06.10 2019.07.08
Stock price rise probability score
A sector
B sector
Total average
-0% -2% -2% -5% 1%
-18%
5% 15%
-45%
-153%
-8% 1%
-83%
38%
-33%
-200%
-150%
-100%
-50%
0%
50%
2019.03.13 2019.04.10 2019.05.10 2019.06.10 2019.07.08
Increase rate of stock price rise
A sector
B sector
Total average
Yuhan Corporation](data:image/gif;base64,R0lGODlhAQABAIAAAAAAAP///yH5BAEAAAAALAAAAAABAAEAAAIBRAA7)
Empfohlen
Empfohlen
Weitere ähnliche Inhalte
Was ist angesagt?
Was ist angesagt? (20)
Ähnlich wie Yuhan Corporation 000100 Algorithm Investment Report
Ähnlich wie Yuhan Corporation 000100 Algorithm Investment Report (20)
Mehr von 알고리즘 기업분석 컨설팅-알기컨,algikeon
Mehr von 알고리즘 기업분석 컨설팅-알기컨,algikeon (20)
Kürzlich hochgeladen
Kürzlich hochgeladen (20)
Yuhan Corporation 000100 Algorithm Investment Report
- 1. Performance Analysis of Algorithm (consolidated) 000100 Date Period 3 months 100-m won 2016.12 2017.12 2018.12 Average 2018.06 2018.09 2018.12 2019.03 2019.06 2019.09 IFRS(Con) IFRS(Con) IFRS(Con) IFRS(Con) IFRS(Con) IFRS(Con) IFRS(Con) IFRS(Con) IFRS(Con) IFRS(Con) IFRS(Con) Sales 13,208 14,622 15,188 14,339 3,862 3,786 4,142 3,450 3,896 3,916 3,810 O-profit 978 887 501 789 166 2 77 61 290 2,225 77 N-income 1,612 1,096 583 1,097 166 109 97 157 214 224 132 O-rate 7.4 6.1 3.3 5.6 4.3 0.1 1.9 1.8 7.4 56.8 2.0 N-rate 12.2 7.5 3.8 7.8 4.3 2.9 2.3 4.6 5.5 5.7 3.5 ROE 10.8 6.8 3.5 7.0 4.1 3.4 3.3 3.6 3.9 4.0 3.6 Debt-ratio 36.7 30.4 31.6 32.9 33.5 31.9 31.6 36.4 37.5 38.6 33.3 Quick-ratio 227.4 288.9 246.5 254.3 266.4 269.4 246.5 224.6 232.9 303.2 251.7 reserve-ratio 2,683.7 2,707.6 2,651.6 2,680.9 2,616.6 2,634.7 2,651.6 2,516.3 2,483.2 2,450.6 2,604.8 EPS 12,387 8,422 4,480 8,430 1,276 838 745 1,206 1,587 1,713 1,016 BPS 115,005 123,435 126,924 121,788 124,565 125,272 126,924 126,417 127,043 127,673 125,794 Dividends 1,739 1,818 1,905 1,821 2019-07-09 Major Financial Information Recent Annual Performance Recent quarterly performance Estimate Average Gap (Indication / stock) Color High price ~ 21 % High mid ~ 6 % Mid ~ -9 % Low mid ~ -24 % Low price ~ -39 % Indication price Range Current stock price Company score 251,740 W 251,740 W 216,127 W 216,127 W 216,127 W 180,514 W Evaluation 287,353 W 287,353 W~ 251,740 W 237,000 W 42.0180,514 W 180,514 W 144,901 W High mid Normal 144,901 W 144,901 W 0 W Industrial name of the company The number of All industries Algorithm Industry ranking Total number of listed companies Algorithm company ranking Investment opinion Pharmaceutical 81 40 3,009 799 144,901원 180,514원 216,127원 251,740원 287,353원 High mid 237,000원 -39% -24% -9% 6.2% 21.2% -50% -40% -30% -20% -10% 0.% 10.% 20.% 30.% 0W 50,000W 100,000W 150,000W 200,000W 250,000W 300,000W 350,000W Low price Low mid Mid High mid High price Indication price chart (Consolidated) Indication price Yuhan Corporation Gap Yuhan Corporation
- 2. [Price for scheduled purchasing] Arbitrarily made Algorithm stocks Trading Strategies (consolidated) 000100 Date Period Gap (Indication / stock) Color 2019-07-09 3 months Current stock price Evaluation Stock price rise probability score Investment opinion Prospective purchase amount 237,000 W High mid 29.4 Normal 2,000,000 W Suggested Purchase Amount 613,805 W Number of stocks purchased 3 Indication price Range Buying / Selling Buying / Selling [Stocks] High price 287,353 W 287,353 W~ ~ 251,740 W 21 % -130,409 W -0 High mid 251,740 W 251,740 W ~ 216,127 W 6 % -38,175 W -0 Mid 216,127 W 216,127 W ~ 180,514 W -9 % 54,059 W 0 Low mid 180,514 W 180,514 W ~ 144,901 W -24 % 146,293 W 1 low price 144,901 W 144,901 W ~ 0 W -39 % 238,527 W 2 Stock price rise probability score A Sector 51.0 50.8 49.8 48.8 46.6 46.9 29.4B Sector 46.7 39.6 41.7 48.8 33.8 13.3 Total average 2019.02.12 2019.03.13 2019.04.10 2019.05.10 2019.06.10 2019.07.08 48.8 45.2 45.7 25.0 40.2 30.1 38 % -33 % 2019.03.13 2019.04.10 2019.05.10 2019.06.10 2019.07.08 Total of increase rate Total score A Sector -0 % -2 % -2 % -5 % 1 % -17 % 38.0B Sector -18 % 5 % 15 % -45 % -153 % Total average -8 % 1 % -83 % 51 51 50 49 47 4747 40 42 49 34 13 49 45 46 25 40 30 0 10 20 30 40 50 60 2019.02.12 2019.03.13 2019.04.10 2019.05.10 2019.06.10 2019.07.08 Stock price rise probability score A sector B sector Total average -0% -2% -2% -5% 1% -18% 5% 15% -45% -153% -8% 1% -83% 38% -33% -200% -150% -100% -50% 0% 50% 2019.03.13 2019.04.10 2019.05.10 2019.06.10 2019.07.08 Increase rate of stock price rise A sector B sector Total average Yuhan Corporation
- 3. 정보와 완전 정보 결 투자판단 있습니 위배 무단으 숙지하 Compliance notice ① The information provided by The Algorithm Company Analysis Consulting is obtained through reliable data and information and The Algorithm Company Analysis Program (TACAP), but its accuracy or completeness are not guaranteed. Furthermore, it may change over time.Therefore, we are not legally responsible for the results of the data provided by The Algorithm Company Analysis Consulting because of information errors or omissions. ② The Algorithm Company Analysis Consulting and all the information provided on it site are reference materials for investment decisions and the final responsibility of investment is up to users utilizing this information. ③ The Algorithm Company Analysis Consulting and its site do not do anything that violates the related laws such as discretionary transaction. ④ Users can not reallocate and recycle the information provided by The Algorithm Company Analysis Consulting firm let alone the information provided by its Site. ⑤ Be sure to know about application period of this algorithm analysis report in order to improve its accuracy. Tel : 070 - 4667 - 5009 Email : tacac@tacac.co.kr Homepage : tacac.co.kr Blog : tacac.blog.me SERVICES M&A, IPO, RECOVER, CORPORATE RESTRUCTURING, MANAGEMENT OF TECHNOLOGY, BUSINESS STRATEGY, FAMILY BUSINESS Request : http://tacac.co.kr/?page_id=1374 ① Consulting The Algori accuracy o change ove results of Consulting ② informatio investmen up ③ do anythin transaction ④ The Algori informatio ⑤ analysis re