t-robotics 117730 Algorithm Investment Report
•
1 gefällt mir•175 views

This document contains financial and stock performance data for a company over several quarters and years. It also includes the company's stock price probability score compared to sector averages, suggested purchase amounts based on the current stock price, and a compliance notice about the accuracy and appropriate use of the analysis.
![[Price for scheduled purchasing]
Arbitrarily made
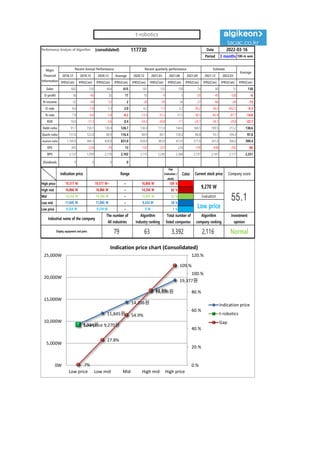
Algorithm stocks Trading Strategies (consolidated) 117730 Date
Period
Gap
(Indication /
stock)
Color
low price 9,334 W 9,334 W ~ 0 W 1 % -27,006 W -3
Low mid 11,845 W 11,845 W ~ 9,334 W 28 % -1,084,161 W -92
Mid 14,356 W 14,356 W ~ 11,845 W 55 % -2,141,317 W -149
High mid 16,866 W 16,866 W ~ 14,356 W 82 % -3,198,473 W -190
Suggested Purchase
Amount 3,903,237 W
Number of stocks
purchased 421
Indication price Range Buying / Selling Buying / Selling [Stocks]
High price 19,377 W 19,377 W~ ~ 16,866 W 109 % -4,255,628 W All selling
2022-03-16
3 months
Current stock price Evaluation
Stock price rise
probability score
Investment opinion Prospective purchase amount
9,270 W Low price 55.3 Normal 9,400,000 W
40.6 36.0 41.4 30.8 39.2 40.4
2021.10.18 2021.11.15 2021.12.13 2022.01.11 2022.02.11 2022.03.15
Stock price rise
probability score
A Sector 45.7 42.9 45.7 45.8 50.4 52.1
55.3
B Sector 35.4 29.2 37.1 45.8 27.9 28.8
Total average
2021.12.13 2022.01.11 2022.02.11 2022.03.15
Total of
increase rate
Total score
A Sector -7 % 6 % 0 % 9 % 3 %
-2 % 46.3
B Sector -21 % 21 % 19 % -64 % 3 %
Total average -13 % 13 % -34 % 21 % 3 %
2021.11.15
46
43
46 46
50 52
35
29
37
46
28 29
41
36
41
31
39 40
0
10
20
30
40
50
60
2021.10.18 2021.11.15 2021.12.13 2022.01.11 2022.02.11 2022.03.15
Stock price rise probability score
A sector
B sector
Total average
-7%
6%
0%
9%
3%
-21%
21% 19%
-64%
3%
-13%
13%
-34%
21%
3%
-80%
-60%
-40%
-20%
0%
20%
40%
2021.11.15 2021.12.13 2022.01.11 2022.02.11 2022.03.15
Increase rate of stock price rise
A sector
B sector
Total average
t-robotics](data:image/gif;base64,R0lGODlhAQABAIAAAAAAAP///yH5BAEAAAAALAAAAAABAAEAAAIBRAA7)
Empfohlen
Empfohlen
Weitere ähnliche Inhalte
Was ist angesagt?
Was ist angesagt? (20)
Ähnlich wie t-robotics 117730 Algorithm Investment Report
Ähnlich wie t-robotics 117730 Algorithm Investment Report (20)
Mehr von 알고리즘 기업분석 컨설팅-알기컨,algikeon
Mehr von 알고리즘 기업분석 컨설팅-알기컨,algikeon (20)
Kürzlich hochgeladen
Kürzlich hochgeladen (20)
t-robotics 117730 Algorithm Investment Report
- 1. Performance Analysis of Algorithm (consolidated) 117730 Date Period 3 months 100-m won 2018.12 2019.12 2020.12 Average 2020.12 2021.03 2021.06 2021.09 2021.12 2022.03 IFRS(Con) IFRS(Con) IFRS(Con) IFRS(Con) IFRS(Con) IFRS(Con) IFRS(Con) IFRS(Con) IFRS(Con) IFRS(Con) IFRS(Con) Sales 665 516 664 615 161 125 158 74 80 51 130 O-profit 56 -40 35 17 10 -9 5 -29 -45 -330 -6 N-income 52 -34 -12 2 -20 -39 34 -27 -66 -44 -13 O-rate 8.4 -7.8 5.3 2.0 6.2 -7.2 3.2 -39.2 -56.3 -652.5 -9.3 N-rate 7.8 -6.6 -1.8 -0.2 -12.4 -31.2 21.5 -36.5 -82.4 -87.7 -14.6 ROE 16.0 -11.2 -3.6 0.4 -24.3 -34.8 -7.1 -24.7 -34.1 -29.8 -22.7 Debt-ratio 91.7 158.1 130.4 126.7 130.4 111.0 144.6 168.5 189.5 213.2 138.6 Quick-ratio 137.6 122.8 88.9 116.4 88.9 84.1 128.4 86.8 95.1 104.4 97.0 reserve-ratio 1,100.0 964.3 428.8 831.0 428.8 383.8 413.0 371.8 341.0 306.0 399.4 EPS 343 -224 -79 13 -132 -257 224 -178 -438 -292 -86 BPS 2,137 1,999 2,170 2,102 2,170 2,269 2,368 2,197 2,187 2,177 2,251 Dividends 0 0 0 0 Major Financial Information Recent Annual Performance Recent quarterly performance Estimate Average 2022-03-16 Gap (Indication / stock) Color High price ~ 109 % High mid ~ 82 % Mid ~ 55 % Low mid ~ 28 % Low price ~ 1 % Normal 9,334 W 9,334 W 0 W Industrial name of the company The number of All industries Algorithm Industry ranking Total number of listed companies Algorithm company ranking Investment opinion Display equipment and parts 79 63 3,392 2,116 16,866 W 16,866 W 14,356 W 14,356 W 14,356 W 11,845 W Evaluation 19,377 W 19,377 W~ 16,866 W 9,270 W 55.1 11,845 W 11,845 W 9,334 W Low price Indication price Range Current stock price Company score 9,334원 11,845원 14,356원 16,866원 19,377원 Low price 9,270원 .7% 27.8% 54.9% 81.9% 109.% 0.% 20.% 40.% 60.% 80.% 100.% 120.% 0W 5,000W 10,000W 15,000W 20,000W 25,000W Low price Low mid Mid High mid High price Indication price chart (Consolidated) Indication price t-robotics Gap t-robotics
- 2. [Price for scheduled purchasing] Arbitrarily made Algorithm stocks Trading Strategies (consolidated) 117730 Date Period Gap (Indication / stock) Color low price 9,334 W 9,334 W ~ 0 W 1 % -27,006 W -3 Low mid 11,845 W 11,845 W ~ 9,334 W 28 % -1,084,161 W -92 Mid 14,356 W 14,356 W ~ 11,845 W 55 % -2,141,317 W -149 High mid 16,866 W 16,866 W ~ 14,356 W 82 % -3,198,473 W -190 Suggested Purchase Amount 3,903,237 W Number of stocks purchased 421 Indication price Range Buying / Selling Buying / Selling [Stocks] High price 19,377 W 19,377 W~ ~ 16,866 W 109 % -4,255,628 W All selling 2022-03-16 3 months Current stock price Evaluation Stock price rise probability score Investment opinion Prospective purchase amount 9,270 W Low price 55.3 Normal 9,400,000 W 40.6 36.0 41.4 30.8 39.2 40.4 2021.10.18 2021.11.15 2021.12.13 2022.01.11 2022.02.11 2022.03.15 Stock price rise probability score A Sector 45.7 42.9 45.7 45.8 50.4 52.1 55.3 B Sector 35.4 29.2 37.1 45.8 27.9 28.8 Total average 2021.12.13 2022.01.11 2022.02.11 2022.03.15 Total of increase rate Total score A Sector -7 % 6 % 0 % 9 % 3 % -2 % 46.3 B Sector -21 % 21 % 19 % -64 % 3 % Total average -13 % 13 % -34 % 21 % 3 % 2021.11.15 46 43 46 46 50 52 35 29 37 46 28 29 41 36 41 31 39 40 0 10 20 30 40 50 60 2021.10.18 2021.11.15 2021.12.13 2022.01.11 2022.02.11 2022.03.15 Stock price rise probability score A sector B sector Total average -7% 6% 0% 9% 3% -21% 21% 19% -64% 3% -13% 13% -34% 21% 3% -80% -60% -40% -20% 0% 20% 40% 2021.11.15 2021.12.13 2022.01.11 2022.02.11 2022.03.15 Increase rate of stock price rise A sector B sector Total average t-robotics
- 3. 정보와 완전 정보 결 투자판단 있습니 위배 무단으 숙지하 Compliance notice ① The information provided by The Algorithm Company Analysis Consulting is obtained through reliable data and information and The Algorithm Company Analysis Program (TACAP), but its accuracy or completeness are not guaranteed. Furthermore, it may change over time.Therefore, we are not legally responsible for the results of the data provided by The Algorithm Company Analysis Consulting because of information errors or omissions. ② The Algorithm Company Analysis Consulting and all the information provided on it site are reference materials for investment decisions and the final responsibility of investment is up to users utilizing this information. ③ The Algorithm Company Analysis Consulting and its site do not do anything that violates the related laws such as discretionary transaction. ④ Users can not reallocate and recycle the information provided by The Algorithm Company Analysis Consulting firm let alone the information provided by its Site. ⑤ Be sure to know about application period of this algorithm analysis report in order to improve its accuracy. Tel : 070 - 4667 - 5009 Email : tacac@tacac.co.kr Homepage : tacac.co.kr Blog : tacac.blog.me SERVICES M&A, IPO, RECOVER, CORPORATE RESTRUCTURING, MANAGEMENT OF TECHNOLOGY, BUSINESS STRATEGY, FAMILY BUSINESS Request : http://tacac.co.kr/?page_id=1374 ① Consulting is o The Algorithm accuracy or com change over tim results of the d Consulting bec ② information pr investment dec up ③ do anything th transaction. ④ The Algorithm information pr ⑤ analysis report