telcon RF pharmaceutical 200230 Algorithm Investment Report
•
0 gefällt mir•56 views

This document provides a summary of financial performance and stock price analysis for a company called Algorithm over several periods. It shows declining sales, profits, and stock prices over time. A stock price prediction model indicates the current price is below the predicted range and assigns a 39/100 probability score for the stock price to rise. It recommends selling the stock.
![[Price for scheduled purchasing]
Arbitrarily made
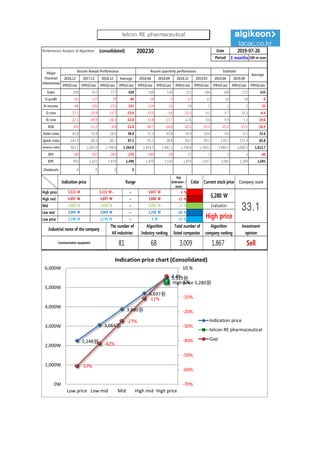
Algorithm stocks Trading Strategies (consolidated) 200230 Date
Period
Gap
(Indication /
stock)
Color
2019-07-26
3 months
Current stock price Evaluation
Stock price rise
probability score
Investment opinion Prospective purchase amount
5,280 W High price 39.0 Sell 1,500,000 W
Suggested Purchase
Amount 197,878 W
Number of stocks
purchased 37
Indication price Range Buying / Selling Buying / Selling [Stocks]
High price 5,513 W 5,513 W~ ~ 4,697 W 4 % -8,722 W -2
High mid 4,697 W 4,697 W ~ 3,880 W -11 % 21,866 W 5
Mid 3,880 W 3,880 W ~ 3,064 W -27 % 52,454 W 14
Low mid 3,064 W 3,064 W ~ 2,248 W -42 % 83,042 W 27
low price 2,248 W 2,248 W ~ 0 W -57 % 113,630 W 51
Stock price rise
probability score
A Sector 46.6 48.4 49.8 45.1 51.4 44.5
39.0B Sector 27.1 26.3 35.0 45.1 27.9 18.8
Total average
2019.03.04 2019.04.01 2019.04.29 2019.05.29 2019.06.27 2019.07.25
36.8 37.3 42.4 32.5 39.7 31.6
18 % -25 %
2019.04.01 2019.04.29 2019.05.29 2019.06.27 2019.07.25
Total of
increase rate
Total score
A Sector 4 % 3 % -11 % 12 % -16 %
-5 % 42.7B Sector -3 % 25 % 22 % -62 % -49 %
Total average 1 % 12 % -30 %
47 48 50
45
51
44
27 26
35
45
28
19
37 37
42
33
40
32
0
10
20
30
40
50
60
2019.03.04 2019.04.01 2019.04.29 2019.05.29 2019.06.27 2019.07.25
Stock price rise probability score
A sector
B sector
Total average
4% 3%
-11%
12%
-16%
-3%
25% 22%
-62%
-49%
1%
12%
-30%
18%
-25%
-80%
-60%
-40%
-20%
0%
20%
40%
2019.04.01 2019.04.29 2019.05.29 2019.06.27 2019.07.25
Increase rate of stock price rise
A sector
B sector
Total average
telcon RE pharmaceutical](data:image/gif;base64,R0lGODlhAQABAIAAAAAAAP///yH5BAEAAAAALAAAAAABAAEAAAIBRAA7)
Empfohlen
Empfohlen
Weitere ähnliche Inhalte
Was ist angesagt?
Was ist angesagt? (20)
Ähnlich wie telcon RF pharmaceutical 200230 Algorithm Investment Report
Ähnlich wie telcon RF pharmaceutical 200230 Algorithm Investment Report (19)
Mehr von 알고리즘 기업분석 컨설팅-알기컨,algikeon
Mehr von 알고리즘 기업분석 컨설팅-알기컨,algikeon (20)
Kürzlich hochgeladen
Kürzlich hochgeladen (20)
telcon RF pharmaceutical 200230 Algorithm Investment Report
- 1. Performance Analysis of Algorithm (consolidated) 200230 Date Period 3 months 100-m won 2016.12 2017.12 2018.12 Average 2018.06 2018.09 2018.12 2019.03 2019.06 2019.09 IFRS(Con) IFRS(Con) IFRS(Con) IFRS(Con) IFRS(Con) IFRS(Con) IFRS(Con) IFRS(Con) IFRS(Con) IFRS(Con) IFRS(Con) Sales 298 411 577 429 168 130 111 164 168 172 143 O-profit -81 -127 -79 -96 -26 -5 -17 15 16 18 -8 N-income -66 -205 -152 -141 -124 -23 14 1 1 2 -33 O-rate -27.2 -30.9 -13.7 -23.9 -15.5 -3.8 -15.3 9.1 9.7 10.3 -6.4 N-rate -22.1 -49.9 -26.3 -32.8 -73.8 -17.7 12.6 0.6 0.9 1.3 -19.6 ROE -8.0 -15.2 -9.8 -11.0 -40.7 -24.0 -20.3 -21.2 -21.2 -21.1 -26.5 Debt-ratio 43.8 55.8 16.9 38.9 57.2 45.8 16.9 14.4 9.6 6.5 33.6 Quick-ratio 142.9 68.3 80.2 97.1 45.1 38.8 80.2 99.1 130.3 171.4 65.8 reserve-ratio 962.1 1,383.6 1,748.8 1,364.8 1,454.5 1,487.2 1,748.8 1,760.2 1,880.7 2,009.3 1,612.7 EPS -80 -247 -183 -170 -149 -28 17 1 2 3 -40 BPS 993 1,621 1,874 1,496 1,470 1,520 1,874 1,917 2,083 2,264 1,695 Dividends 0 0 0 0 2019-07-26 Major Financial Information Recent Annual Performance Recent quarterly performance Estimate Average Gap (Indication / stock) Color High price ~ 4 % High mid ~ -11 % Mid ~ -27 % Low mid ~ -42 % Low price ~ -57 % Indication price Range Current stock price Company score 4,697 W 4,697 W 3,880 W 3,880 W 3,880 W 3,064 W Evaluation 5,513 W 5,513 W~ 4,697 W 5,280 W 33.13,064 W 3,064 W 2,248 W High price Sell 2,248 W 2,248 W 0 W Industrial name of the company The number of All industries Algorithm Industry ranking Total number of listed companies Algorithm company ranking Investment opinion Communication equipment 81 68 3,009 1,867 2,248원 3,064원 3,880원 4,697원 5,513원 High price 5,280원 -57% -42% -27% -11% 4.4% -70% -60% -50% -40% -30% -20% -10% 0.% 10.% 0W 1,000W 2,000W 3,000W 4,000W 5,000W 6,000W Low price Low mid Mid High mid High price Indication price chart (Consolidated) Indication price telcon RE pharmaceutical Gap telcon RE pharmaceutical
- 2. [Price for scheduled purchasing] Arbitrarily made Algorithm stocks Trading Strategies (consolidated) 200230 Date Period Gap (Indication / stock) Color 2019-07-26 3 months Current stock price Evaluation Stock price rise probability score Investment opinion Prospective purchase amount 5,280 W High price 39.0 Sell 1,500,000 W Suggested Purchase Amount 197,878 W Number of stocks purchased 37 Indication price Range Buying / Selling Buying / Selling [Stocks] High price 5,513 W 5,513 W~ ~ 4,697 W 4 % -8,722 W -2 High mid 4,697 W 4,697 W ~ 3,880 W -11 % 21,866 W 5 Mid 3,880 W 3,880 W ~ 3,064 W -27 % 52,454 W 14 Low mid 3,064 W 3,064 W ~ 2,248 W -42 % 83,042 W 27 low price 2,248 W 2,248 W ~ 0 W -57 % 113,630 W 51 Stock price rise probability score A Sector 46.6 48.4 49.8 45.1 51.4 44.5 39.0B Sector 27.1 26.3 35.0 45.1 27.9 18.8 Total average 2019.03.04 2019.04.01 2019.04.29 2019.05.29 2019.06.27 2019.07.25 36.8 37.3 42.4 32.5 39.7 31.6 18 % -25 % 2019.04.01 2019.04.29 2019.05.29 2019.06.27 2019.07.25 Total of increase rate Total score A Sector 4 % 3 % -11 % 12 % -16 % -5 % 42.7B Sector -3 % 25 % 22 % -62 % -49 % Total average 1 % 12 % -30 % 47 48 50 45 51 44 27 26 35 45 28 19 37 37 42 33 40 32 0 10 20 30 40 50 60 2019.03.04 2019.04.01 2019.04.29 2019.05.29 2019.06.27 2019.07.25 Stock price rise probability score A sector B sector Total average 4% 3% -11% 12% -16% -3% 25% 22% -62% -49% 1% 12% -30% 18% -25% -80% -60% -40% -20% 0% 20% 40% 2019.04.01 2019.04.29 2019.05.29 2019.06.27 2019.07.25 Increase rate of stock price rise A sector B sector Total average telcon RE pharmaceutical
- 3. 정보와 완전 정보 결 투자판단 있습니 위배 무단으 숙지하 Compliance notice ① The information provided by The Algorithm Company Analysis Consulting is obtained through reliable data and information and The Algorithm Company Analysis Program (TACAP), but its accuracy or completeness are not guaranteed. Furthermore, it may change over time.Therefore, we are not legally responsible for the results of the data provided by The Algorithm Company Analysis Consulting because of information errors or omissions. ② The Algorithm Company Analysis Consulting and all the information provided on it site are reference materials for investment decisions and the final responsibility of investment is up to users utilizing this information. ③ The Algorithm Company Analysis Consulting and its site do not do anything that violates the related laws such as discretionary transaction. ④ Users can not reallocate and recycle the information provided by The Algorithm Company Analysis Consulting firm let alone the information provided by its Site. ⑤ Be sure to know about application period of this algorithm analysis report in order to improve its accuracy. Tel : 070 - 4667 - 5009 Email : tacac@tacac.co.kr Homepage : tacac.co.kr Blog : tacac.blog.me SERVICES M&A, IPO, RECOVER, CORPORATE RESTRUCTURING, MANAGEMENT OF TECHNOLOGY, BUSINESS STRATEGY, FAMILY BUSINESS Request : http://tacac.co.kr/?page_id=1374 ① Consulting The Algori accuracy o change ove results of Consulting ② informatio investmen up ③ do anythin transaction ④ The Algori informatio ⑤ analysis re