tegoscience 191420 Algorithm Investment Report
•
0 gefällt mir•80 views

This document contains performance data and financial information for an algorithm company over several periods from 2016-2019. It includes metrics like sales, operating profit, net income, debt ratios, and stock prices. It also provides the company's industry ranking, stock price predictions, and analyses of investment opportunities based on the algorithm's evaluations.
![[Price for scheduled purchasing]
Arbitrarily made
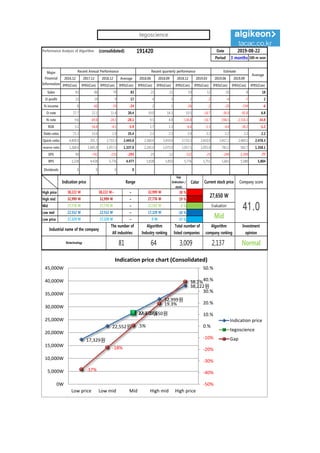
Algorithm stocks Trading Strategies (consolidated) 191420 Date
Period
Gap
(Indication /
stock)
Color
low price 17,329 W 17,329 W ~ 0 W -37 % 158,998 W 9
Low mid 22,552 W 22,552 W ~ 17,329 W -18 % 78,531 W 3
Mid 27,776 W 27,776 W ~ 22,552 W 0 % -1,936 W -0
High mid 32,999 W 32,999 W ~ 27,776 W 19 % -82,403 W -2
Suggested Purchase
Amount 425,959 W
Number of stocks
purchased 15
Indication price Range Buying / Selling Buying / Selling [Stocks]
High price 38,222 W 38,222 W~ ~ 32,999 W 38 % -162,870 W -4
2019-08-22
3 months
Current stock price Evaluation
Stock price rise
probability score
Investment opinion Prospective purchase amount
27,650 W Mid 35.0 Normal 1,500,000 W
45.7 36.7 36.1 38.3 35.5 37.1
2019.03.28 2019.04.25 2019.05.27 2019.06.25 2019.07.23 2019.08.21
Stock price rise
probability score
A Sector 46.3 46.0 46.0 46.6 39.8 46.8
35.0B Sector 45.0 27.5 26.3 46.6 31.3 27.5
Total average
2019.05.27 2019.06.25 2019.07.23 2019.08.21
Total of
increase rate
Total score
A Sector -1 % 0 % 1 % -17 % 15 %
-5 % 42.0B Sector -64 % -5 % 44 % -49 % -14 %
Total average -24 % -2 % 6 % -8 % 4 %
2019.04.25
46 46 46 47
40
4745
28 26
47
31
28
46
37 36
38
36 37
0
10
20
30
40
50
2019.03.28 2019.04.25 2019.05.27 2019.06.25 2019.07.23 2019.08.21
Stock price rise probability score
A sector
B sector
Total average
-1% 0% 1%
-17%
15%
-64%
-5%
44%
-49%
-14%
-24%
-2%
6%
-8%
4%
-80%
-60%
-40%
-20%
0%
20%
40%
60%
2019.04.25 2019.05.27 2019.06.25 2019.07.23 2019.08.21
Increase rate of stock price rise
A sector
B sector
Total average
tegoscience](data:image/gif;base64,R0lGODlhAQABAIAAAAAAAP///yH5BAEAAAAALAAAAAABAAEAAAIBRAA7)
Empfohlen
Empfohlen
Weitere ähnliche Inhalte
Was ist angesagt?
Was ist angesagt? (20)
Ähnlich wie tegoscience 191420 Algorithm Investment Report
Ähnlich wie tegoscience 191420 Algorithm Investment Report (20)
Mehr von 알고리즘 기업분석 컨설팅-알기컨,algikeon
Mehr von 알고리즘 기업분석 컨설팅-알기컨,algikeon (20)
Kürzlich hochgeladen
Kürzlich hochgeladen (20)
tegoscience 191420 Algorithm Investment Report
- 1. Performance Analysis of Algorithm (consolidated) 191420 Date Period 3 months 100-m won 2016.12 2017.12 2018.12 Average 2018.06 2018.09 2018.12 2019.03 2019.06 2019.09 IFRS(Con) IFRS(Con) IFRS(Con) IFRS(Con) IFRS(Con) IFRS(Con) IFRS(Con) IFRS(Con) IFRS(Con) IFRS(Con) IFRS(Con) Sales 83 86 79 83 21 21 19 12 10 8 18 O-profit 23 19 9 17 4 3 2 -2 -4 -7 2 N-income 8 -60 -19 -24 2 1 -26 -2 -20 -194 -6 O-rate 27.7 22.1 11.4 20.4 19.0 14.3 10.5 -16.7 -36.9 -81.8 6.8 N-rate 9.6 -69.8 -24.1 -28.1 9.5 4.8 -136.8 -16.7 -196.5 -2,316.3 -34.8 ROE 3.1 -16.8 -4.1 -5.9 1.7 1.3 -6.4 -1.3 -4.4 -30.2 -1.2 Debt-ratio 71.3 33.0 1.9 35.4 2.3 2.3 1.9 2.2 2.2 2.2 2.2 Quick-ratio 4,400.0 201.7 2,733.3 2,445.0 2,360.0 2,410.0 2,733.3 2,410.0 2,417.2 2,469.1 2,478.3 reserve-ratio 1,268.4 1,685.0 1,057.5 1,337.0 2,245.0 1,075.0 1,057.5 1,055.0 783.2 582.7 1,358.1 EPS 99 -742 -235 -293 25 12 -322 -25 -244 -2,399 -77 BPS 3,228 4,428 5,776 4,477 5,838 5,850 5,776 5,751 5,665 5,580 5,804 Dividends 0 0 0 0 Major Financial Information Recent Annual Performance Recent quarterly performance Estimate Average 2019-08-22 Gap (Indication / stock) Color High price ~ 38 % High mid ~ 19 % Mid ~ 0 % Low mid ~ -18 % Low price ~ -37 % Normal 17,329 W 17,329 W 0 W Industrial name of the company The number of All industries Algorithm Industry ranking Total number of listed companies Algorithm company ranking Investment opinion Biotechnology 81 64 3,009 2,137 32,999 W 32,999 W 27,776 W 27,776 W 27,776 W 22,552 W Evaluation 38,222 W 38,222 W~ 32,999 W 27,650 W 41.022,552 W 22,552 W 17,329 W Mid Indication price Range Current stock price Company score 17,329원 22,552원 27,776원 32,999원 38,222원 Mid 27,650원 -37% -18% .5% 19.3% 38.2% -50% -40% -30% -20% -10% 0.% 10.% 20.% 30.% 40.% 50.% 0W 5,000W 10,000W 15,000W 20,000W 25,000W 30,000W 35,000W 40,000W 45,000W Low price Low mid Mid High mid High price Indication price chart (Consolidated) Indication price tegoscience Gap tegoscience
- 2. [Price for scheduled purchasing] Arbitrarily made Algorithm stocks Trading Strategies (consolidated) 191420 Date Period Gap (Indication / stock) Color low price 17,329 W 17,329 W ~ 0 W -37 % 158,998 W 9 Low mid 22,552 W 22,552 W ~ 17,329 W -18 % 78,531 W 3 Mid 27,776 W 27,776 W ~ 22,552 W 0 % -1,936 W -0 High mid 32,999 W 32,999 W ~ 27,776 W 19 % -82,403 W -2 Suggested Purchase Amount 425,959 W Number of stocks purchased 15 Indication price Range Buying / Selling Buying / Selling [Stocks] High price 38,222 W 38,222 W~ ~ 32,999 W 38 % -162,870 W -4 2019-08-22 3 months Current stock price Evaluation Stock price rise probability score Investment opinion Prospective purchase amount 27,650 W Mid 35.0 Normal 1,500,000 W 45.7 36.7 36.1 38.3 35.5 37.1 2019.03.28 2019.04.25 2019.05.27 2019.06.25 2019.07.23 2019.08.21 Stock price rise probability score A Sector 46.3 46.0 46.0 46.6 39.8 46.8 35.0B Sector 45.0 27.5 26.3 46.6 31.3 27.5 Total average 2019.05.27 2019.06.25 2019.07.23 2019.08.21 Total of increase rate Total score A Sector -1 % 0 % 1 % -17 % 15 % -5 % 42.0B Sector -64 % -5 % 44 % -49 % -14 % Total average -24 % -2 % 6 % -8 % 4 % 2019.04.25 46 46 46 47 40 4745 28 26 47 31 28 46 37 36 38 36 37 0 10 20 30 40 50 2019.03.28 2019.04.25 2019.05.27 2019.06.25 2019.07.23 2019.08.21 Stock price rise probability score A sector B sector Total average -1% 0% 1% -17% 15% -64% -5% 44% -49% -14% -24% -2% 6% -8% 4% -80% -60% -40% -20% 0% 20% 40% 60% 2019.04.25 2019.05.27 2019.06.25 2019.07.23 2019.08.21 Increase rate of stock price rise A sector B sector Total average tegoscience
- 3. 정보와 완전 정보 결 투자판단 있습니 위배 무단으 숙지하 Compliance notice ① The information provided by The Algorithm Company Analysis Consulting is obtained through reliable data and information and The Algorithm Company Analysis Program (TACAP), but its accuracy or completeness are not guaranteed. Furthermore, it may change over time.Therefore, we are not legally responsible for the results of the data provided by The Algorithm Company Analysis Consulting because of information errors or omissions. ② The Algorithm Company Analysis Consulting and all the information provided on it site are reference materials for investment decisions and the final responsibility of investment is up to users utilizing this information. ③ The Algorithm Company Analysis Consulting and its site do not do anything that violates the related laws such as discretionary transaction. ④ Users can not reallocate and recycle the information provided by The Algorithm Company Analysis Consulting firm let alone the information provided by its Site. ⑤ Be sure to know about application period of this algorithm analysis report in order to improve its accuracy. Tel : 070 - 4667 - 5009 Email : tacac@tacac.co.kr Homepage : tacac.co.kr Blog : tacac.blog.me SERVICES M&A, IPO, RECOVER, CORPORATE RESTRUCTURING, MANAGEMENT OF TECHNOLOGY, BUSINESS STRATEGY, FAMILY BUSINESS Request : http://tacac.co.kr/?page_id=1374 ① Consulting The Algori accuracy o change ove results of Consulting ② informatio investmen up ③ do anythin transaction ④ The Algori informatio ⑤ analysis re