RFHIC 218410 Algorithm Investment Report
•
0 gefällt mir•128 views

This document contains financial and performance data for an algorithm company from 2016-2019, including sales, operating profit, net income, debt ratio, and stock price. It also includes a stock price prediction analysis showing the company's current stock price, indicated price ranges, and buying/selling amounts within those ranges. The analysis assigns a probability score to the company's stock price rising and compares it to sector averages. It concludes with a compliance notice stating the information is for reference only and the user assumes responsibility for investment decisions.
![[Price for scheduled purchasing]
Arbitrarily made
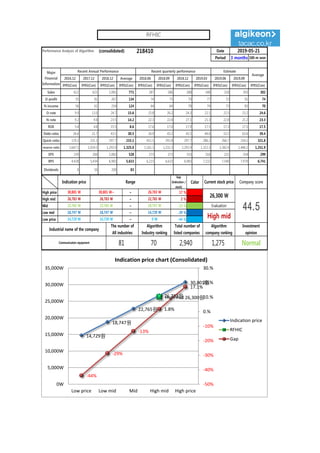
Algorithm stocks Trading Strategies (consolidated) 218410 Date
Period
Gap
(Indication /
stock)
Color
low price 14,729 W 14,729 W ~ 0 W -44 % 445,421 W 30
Low mid 18,747 W 18,747 W ~ 14,729 W -29 % 290,751 W 16
Mid 22,765 W 22,765 W ~ 18,747 W -13 % 136,082 W 6
High mid 26,783 W 26,783 W ~ 22,765 W 2 % -18,588 W -1
Suggested Purchase
Amount 1,012,449 W
Number of stocks
purchased 38
Indication price Range Buying / Selling Buying / Selling [Stocks]
High price 30,801 W 30,801 W~ ~ 26,783 W 17 % -173,258 W -6
2019-05-21
3 months
Current stock price Evaluation
Stock price rise
probability score
Investment opinion Prospective purchase amount
26,300 W High mid 37.0 Normal 3,500,000 W
42.1 50.4 38.8 18.3 32.7 35.4
2018.12.18 2019.01.18 2019.02.20 2019.03.21 2019.04.18 2019.05.20
Stock price rise
probability score
A Sector 51.7 47.5 50.4 44.4 45.8 44.9
37.0B Sector 32.5 53.3 27.1 44.4 19.6 25.8
Total average
2019.02.20 2019.03.21 2019.04.18 2019.05.20
Total of
increase rate
Total score
A Sector -9 % 6 % -14 % 3 % -2 %
-15 % 45.3B Sector 39 % -97 % 39 % -127 % 24 %
Total average 17 % -30 % -111 % 44 % 8 %
2019.01.18
52
48
50
44 46 45
33
53
27
44
20
26
42
50
39
18
33
35
0
10
20
30
40
50
60
2018.12.18 2019.01.18 2019.02.20 2019.03.21 2019.04.18 2019.05.20
Stock price rise probability score
A sector
B sector
Total average
-9%
6%
-14%
3% -2%
39%
-97%
39%
-127%
24%17%
-30%
-111%
44%
8%
-150%
-100%
-50%
0%
50%
100%
2019.01.18 2019.02.20 2019.03.21 2019.04.18 2019.05.20
Increase rate of stock price rise
A sector
B sector
Total average
RFHIC](data:image/gif;base64,R0lGODlhAQABAIAAAAAAAP///yH5BAEAAAAALAAAAAABAAEAAAIBRAA7)
Empfohlen
Empfohlen
Weitere ähnliche Inhalte
Was ist angesagt?
Was ist angesagt? (20)
Ähnlich wie RFHIC 218410 Algorithm Investment Report
Ähnlich wie RFHIC 218410 Algorithm Investment Report (20)
Mehr von 알고리즘 기업분석 컨설팅-알기컨,algikeon
Mehr von 알고리즘 기업분석 컨설팅-알기컨,algikeon (20)
Kürzlich hochgeladen
Kürzlich hochgeladen (20)
RFHIC 218410 Algorithm Investment Report
- 1. Performance Analysis of Algorithm (consolidated) 218410 Date Period 3 months 100-m won 2016.12 2017.12 2018.12 Average 2018.06 2018.09 2018.12 2019.03 2019.06 2019.09 IFRS(Con) IFRS(Con) IFRS(Con) IFRS(Con) IFRS(Con) IFRS(Con) IFRS(Con) IFRS(Con) IFRS(Con) IFRS(Con) IFRS(Con) Sales 612 621 1,081 771 287 286 288 348 318 393 302 O-profit 55 81 267 134 74 75 70 77 72 91 74 N-income 56 61 254 124 64 64 78 74 73 83 70 O-rate 9.0 13.0 24.7 15.6 25.8 26.2 24.3 22.1 22.5 23.2 24.6 N-rate 9.2 9.8 23.5 14.2 22.3 22.4 27.1 21.3 22.8 21.2 23.3 ROE 5.4 4.8 15.5 8.6 17.6 17.0 17.9 17.5 17.3 17.5 17.5 Debt-ratio 26.6 21.7 43.1 30.5 26.9 43.2 43.1 44.6 53.2 63.6 39.4 Quick-ratio 170.2 231.3 297.7 233.1 411.5 291.8 297.7 286.2 266.7 254.1 321.8 reserve-ratio 1,647.5 1,034.5 1,292.9 1,325.0 1,161.3 1,231.3 1,292.9 1,322.3 1,382.4 1,446.1 1,251.9 EPS 239 260 1,083 528 273 273 333 316 221 334 299 BPS 4,428 5,434 6,983 5,615 6,215 6,633 6,983 7,132 7,540 7,970 6,741 Dividends 0 50 200 83 Major Financial Information Recent Annual Performance Recent quarterly performance Estimate Average 2019-05-21 Gap (Indication / stock) Color High price ~ 17 % High mid ~ 2 % Mid ~ -13 % Low mid ~ -29 % Low price ~ -44 % Normal 14,729 W 14,729 W 0 W Industrial name of the company The number of All industries Algorithm Industry ranking Total number of listed companies Algorithm company ranking Investment opinion Communication equipment 81 70 2,940 1,275 26,783 W 26,783 W 22,765 W 22,765 W 22,765 W 18,747 W Evaluation 30,801 W 30,801 W~ 26,783 W 26,300 W 44.518,747 W 18,747 W 14,729 W High mid Indication price Range Current stock price Company score 14,729원 18,747원 22,765원 26,783원 30,801원 High mid 26,300원 -44% -29% -13% 1.8% 17.1% -50% -40% -30% -20% -10% 0.% 10.% 20.% 30.% 0W 5,000W 10,000W 15,000W 20,000W 25,000W 30,000W 35,000W Low price Low mid Mid High mid High price Indication price chart (Consolidated) Indication price RFHIC Gap RFHIC
- 2. [Price for scheduled purchasing] Arbitrarily made Algorithm stocks Trading Strategies (consolidated) 218410 Date Period Gap (Indication / stock) Color low price 14,729 W 14,729 W ~ 0 W -44 % 445,421 W 30 Low mid 18,747 W 18,747 W ~ 14,729 W -29 % 290,751 W 16 Mid 22,765 W 22,765 W ~ 18,747 W -13 % 136,082 W 6 High mid 26,783 W 26,783 W ~ 22,765 W 2 % -18,588 W -1 Suggested Purchase Amount 1,012,449 W Number of stocks purchased 38 Indication price Range Buying / Selling Buying / Selling [Stocks] High price 30,801 W 30,801 W~ ~ 26,783 W 17 % -173,258 W -6 2019-05-21 3 months Current stock price Evaluation Stock price rise probability score Investment opinion Prospective purchase amount 26,300 W High mid 37.0 Normal 3,500,000 W 42.1 50.4 38.8 18.3 32.7 35.4 2018.12.18 2019.01.18 2019.02.20 2019.03.21 2019.04.18 2019.05.20 Stock price rise probability score A Sector 51.7 47.5 50.4 44.4 45.8 44.9 37.0B Sector 32.5 53.3 27.1 44.4 19.6 25.8 Total average 2019.02.20 2019.03.21 2019.04.18 2019.05.20 Total of increase rate Total score A Sector -9 % 6 % -14 % 3 % -2 % -15 % 45.3B Sector 39 % -97 % 39 % -127 % 24 % Total average 17 % -30 % -111 % 44 % 8 % 2019.01.18 52 48 50 44 46 45 33 53 27 44 20 26 42 50 39 18 33 35 0 10 20 30 40 50 60 2018.12.18 2019.01.18 2019.02.20 2019.03.21 2019.04.18 2019.05.20 Stock price rise probability score A sector B sector Total average -9% 6% -14% 3% -2% 39% -97% 39% -127% 24%17% -30% -111% 44% 8% -150% -100% -50% 0% 50% 100% 2019.01.18 2019.02.20 2019.03.21 2019.04.18 2019.05.20 Increase rate of stock price rise A sector B sector Total average RFHIC
- 3. 정보와 완전 정보 결 투자판단 있습니 위배 무단으 숙지하 Compliance notice ① The information provided by The Algorithm Company Analysis Consulting is obtained through reliable data and information and The Algorithm Company Analysis Program (TACAP), but its accuracy or completeness are not guaranteed. Furthermore, it may change over time.Therefore, we are not legally responsible for the results of the data provided by The Algorithm Company Analysis Consulting because of information errors or omissions. ② The Algorithm Company Analysis Consulting and all the information provided on it site are reference materials for investment decisions and the final responsibility of investment is up to users utilizing this information. ③ The Algorithm Company Analysis Consulting and its site do not do anything that violates the related laws such as discretionary transaction. ④ Users can not reallocate and recycle the information provided by The Algorithm Company Analysis Consulting firm let alone the information provided by its Site. ⑤ Be sure to know about application period of this algorithm analysis report in order to improve its accuracy. Tel : 070 - 4667 - 5009 Email : tacac@tacac.co.kr Homepage : tacac.co.kr Blog : tacac.blog.me SERVICES EDUCATION, M&A, IPO, RECOVER, CORPORATE RESTRUCTURING, MANAGEMENT OF TECHNOLOGY, BUSINESS STRATEGY, FAMILY BUSINESS Request : http://tacac.co.kr/?page_id=1374 ① Consulting The Algori accuracy o change ove results of Consulting ② informatio investmen up ③ do anythin transaction ④ The Algori informatio ⑤ analysis re