psk 319660 Algorithm Investment Report
•
1 gefällt mir•174 views

psk 319660 Algorithm Investment Report
![[Price for scheduled purchasing]
Arbitrarily made
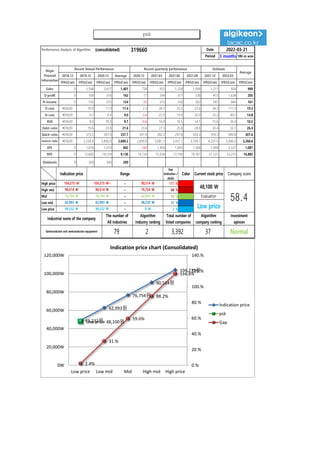
Algorithm stocks Trading Strategies (consolidated) 319660 Date
Period
Gap
(Indication /
stock)
Color
low price 49,232 W 49,232 W ~ 0 W 2 % -112,442 W -2
Low mid 62,993 W 62,993 W ~ 49,232 W 31 % -1,479,429 W -23
Mid 76,754 W 76,754 W ~ 62,993 W 60 % -2,846,416 W -37
High mid 90,514 W 90,514 W ~ 76,754 W 88 % -4,213,403 W -47
Suggested Purchase
Amount 4,778,204 W
Number of stocks
purchased 99
Indication price Range Buying / Selling Buying / Selling [Stocks]
High price 104,275 W 104,275 W~ ~ 90,514 W 117 % -5,580,389 W All selling
2022-03-21
3 months
Current stock price Evaluation
Stock price rise
probability score
Investment opinion Prospective purchase amount
48,100 W Low price 42.6 Normal 10,000,000 W
35.2 52.6 32.8 21.7 39.1 31.5
2021.10.21 2021.11.18 2021.12.16 2022.01.14 2022.02.16 2022.03.18
Stock price rise
probability score
A Sector 47.5 50.5 48.9 49.7 51.5 46.8
42.6
B Sector 22.9 54.6 16.7 49.7 26.7 16.3
Total average
2021.12.16 2022.01.14 2022.02.16 2022.03.18
Total of
increase rate
Total score
A Sector 6 % -3 % 2 % 3 % -10 %
-12 % 41.7
B Sector 58 % -228 % 66 % -87 % -64 %
Total average 33 % -60 % -51 % 45 % -24 %
2021.11.18
48
51 49 50 51
47
23
55
17
50
27
16
35
53
33
22
39
32
0
10
20
30
40
50
60
2021.10.21 2021.11.18 2021.12.16 2022.01.14 2022.02.16 2022.03.18
Stock price rise probability score
A sector
B sector
Total average
6% -3% 2% 3% -10%
58%
-228%
66%
-87%
-64%
33%
-60% -51%
45%
-24%
-250%
-200%
-150%
-100%
-50%
0%
50%
100%
2021.11.18 2021.12.16 2022.01.14 2022.02.16 2022.03.18
Increase rate of stock price rise
A sector
B sector
Total average
psk](data:image/gif;base64,R0lGODlhAQABAIAAAAAAAP///yH5BAEAAAAALAAAAAABAAEAAAIBRAA7)
Empfohlen
Empfohlen
Weitere ähnliche Inhalte
Was ist angesagt?
Was ist angesagt? (20)
Ähnlich wie psk 319660 Algorithm Investment Report
Ähnlich wie psk 319660 Algorithm Investment Report (20)
Mehr von 알고리즘 기업분석 컨설팅-알기컨,algikeon
Mehr von 알고리즘 기업분석 컨설팅-알기컨,algikeon (20)
Kürzlich hochgeladen
Kürzlich hochgeladen (20)
psk 319660 Algorithm Investment Report
- 1. Performance Analysis of Algorithm (consolidated) 319660 Date Period 3 months 100-m won 2018.12 2019.12 2020.12 Average 2020.12 2021.03 2021.06 2021.09 2021.12 2022.03 IFRS(Con) IFRS(Con) IFRS(Con) IFRS(Con) IFRS(Con) IFRS(Con) IFRS(Con) IFRS(Con) IFRS(Con) IFRS(Con) IFRS(Con) Sales 0 1,546 2,657 1,401 738 955 1,258 1,008 1,211 954 990 O-profit 0 169 316 162 17 249 317 238 415 1,634 205 N-income 0 150 223 124 -25 215 250 202 281 864 161 O-rate #DIV/0! 10.9 11.9 11.4 2.3 26.1 25.2 23.6 34.3 171.3 19.3 N-rate #DIV/0! 9.7 8.4 9.0 -3.4 22.5 19.9 20.0 23.2 90.5 14.8 ROE #DIV/0! 8.0 10.3 9.1 -4.6 16.0 16.5 14.1 15.6 26.4 10.5 Debt-ratio #DIV/0! 19.6 23.6 21.6 23.6 27.5 25.8 28.8 30.4 32.1 26.4 Quick-ratio #DIV/0! 373.5 301.9 337.7 301.9 282.2 297.8 324.3 359.3 400.8 301.6 reserve-ratio #DIV/0! 2,528.4 2,850.0 2,689.2 2,850.0 3,081.1 3,431.1 3,704.1 4,257.4 5,046.2 3,266.6 EPS 0 1,016 1,510 842 -169 1,456 1,693 1,368 1,904 5,537 1,087 BPS 0 12,685 14,724 9,136 14,724 15,936 17,704 19,167 21,121 23,275 16,883 Dividends 0 300 300 200 Major Financial Information Recent Annual Performance Recent quarterly performance Estimate Average 2022-03-21 Gap (Indication / stock) Color High price ~ 117 % High mid ~ 88 % Mid ~ 60 % Low mid ~ 31 % Low price ~ 2 % Normal 49,232 W 49,232 W 0 W Industrial name of the company The number of All industries Algorithm Industry ranking Total number of listed companies Algorithm company ranking Investment opinion Semiconductor and semiconductor equipment 79 2 3,392 37 90,514 W 90,514 W 76,754 W 76,754 W 76,754 W 62,993 W Evaluation 104,275 W 104,275 W~ 90,514 W 48,100 W 58.4 62,993 W 62,993 W 49,232 W Low price Indication price Range Current stock price Company score 49,232원 62,993원 76,754원 90,514원 104,275원 Low price 48,100원 2.4% 31.% 59.6% 88.2% 116.8% 0.% 20.% 40.% 60.% 80.% 100.% 120.% 140.% 0W 20,000W 40,000W 60,000W 80,000W 100,000W 120,000W Low price Low mid Mid High mid High price Indication price chart (Consolidated) Indication price psk Gap psk
- 2. [Price for scheduled purchasing] Arbitrarily made Algorithm stocks Trading Strategies (consolidated) 319660 Date Period Gap (Indication / stock) Color low price 49,232 W 49,232 W ~ 0 W 2 % -112,442 W -2 Low mid 62,993 W 62,993 W ~ 49,232 W 31 % -1,479,429 W -23 Mid 76,754 W 76,754 W ~ 62,993 W 60 % -2,846,416 W -37 High mid 90,514 W 90,514 W ~ 76,754 W 88 % -4,213,403 W -47 Suggested Purchase Amount 4,778,204 W Number of stocks purchased 99 Indication price Range Buying / Selling Buying / Selling [Stocks] High price 104,275 W 104,275 W~ ~ 90,514 W 117 % -5,580,389 W All selling 2022-03-21 3 months Current stock price Evaluation Stock price rise probability score Investment opinion Prospective purchase amount 48,100 W Low price 42.6 Normal 10,000,000 W 35.2 52.6 32.8 21.7 39.1 31.5 2021.10.21 2021.11.18 2021.12.16 2022.01.14 2022.02.16 2022.03.18 Stock price rise probability score A Sector 47.5 50.5 48.9 49.7 51.5 46.8 42.6 B Sector 22.9 54.6 16.7 49.7 26.7 16.3 Total average 2021.12.16 2022.01.14 2022.02.16 2022.03.18 Total of increase rate Total score A Sector 6 % -3 % 2 % 3 % -10 % -12 % 41.7 B Sector 58 % -228 % 66 % -87 % -64 % Total average 33 % -60 % -51 % 45 % -24 % 2021.11.18 48 51 49 50 51 47 23 55 17 50 27 16 35 53 33 22 39 32 0 10 20 30 40 50 60 2021.10.21 2021.11.18 2021.12.16 2022.01.14 2022.02.16 2022.03.18 Stock price rise probability score A sector B sector Total average 6% -3% 2% 3% -10% 58% -228% 66% -87% -64% 33% -60% -51% 45% -24% -250% -200% -150% -100% -50% 0% 50% 100% 2021.11.18 2021.12.16 2022.01.14 2022.02.16 2022.03.18 Increase rate of stock price rise A sector B sector Total average psk
- 3. 정보와 완전 정보 결 투자판단 있습니 위배 무단으 숙지하 Compliance notice ① The information provided by The Algorithm Company Analysis Consulting is obtained through reliable data and information and The Algorithm Company Analysis Program (TACAP), but its accuracy or completeness are not guaranteed. Furthermore, it may change over time.Therefore, we are not legally responsible for the results of the data provided by The Algorithm Company Analysis Consulting because of information errors or omissions. ② The Algorithm Company Analysis Consulting and all the information provided on it site are reference materials for investment decisions and the final responsibility of investment is up to users utilizing this information. ③ The Algorithm Company Analysis Consulting and its site do not do anything that violates the related laws such as discretionary transaction. ④ Users can not reallocate and recycle the information provided by The Algorithm Company Analysis Consulting firm let alone the information provided by its Site. ⑤ Be sure to know about application period of this algorithm analysis report in order to improve its accuracy. Tel : 070 - 4667 - 5009 Email : tacac@tacac.co.kr Homepage : tacac.co.kr Blog : tacac.blog.me SERVICES M&A, IPO, RECOVER, CORPORATE RESTRUCTURING, MANAGEMENT OF TECHNOLOGY, BUSINESS STRATEGY, FAMILY BUSINESS Request : http://tacac.co.kr/?page_id=1374 ① Consulting is o The Algorithm accuracy or com change over tim results of the d Consulting bec ② information pr investment dec up ③ do anything th transaction. ④ The Algorithm information pr ⑤ analysis report