posco 005490 Algorithm Investment Report
•
0 gefällt mir•82 views

posco 005490 Algorithm Investment Report
![[Price for scheduled purchasing]
Arbitrarily made
Algorithm stocks Trading Strategies (consolidated) 005490 Date
Period
Gap
(Indication /
stock)
Color
2021-03-30
3 months
Current stock price Evaluation
Stock price rise
probability score
Investment opinion Prospective purchase amount
327,000 W Low price 44.0 Normal 10,000,000 W
Suggested Purchase
Amount 4,620,820 W
Number of stocks
purchased 14
Indication price Range Buying / Selling Buying / Selling [Stocks]
High price 581,571 W 581,571 W~ ~ 533,626 W 78 % -3,597,323 W -6
High mid 533,626 W 533,626 W ~ 485,681 W 63 % -2,919,815 W -5
Mid 485,681 W 485,681 W ~ 437,736 W 49 % -2,242,307 W -5
Low mid 437,736 W 437,736 W ~ 389,791 W 34 % -1,564,799 W -4
low price 389,791 W 389,791 W ~ 0 W 19 % -887,290 W -2
Stock price rise
probability score
A Sector 49.6 51.8 52.9 49.2 50.1 51.8
44.0
B Sector 26.3 25.0 37.5 49.2 44.6 27.9
Total average
2020.10.30 2020.11.27 2020.12.28 2021.01.27 2021.02.26 2021.03.29
37.9 38.4 45.2 60.4 47.3 39.9
-28 % -19 %
2020.11.27 2020.12.28 2021.01.27 2021.02.26 2021.03.29
Total of
increase rate
Total score
A Sector 4 % 2 % -7 % 2 % 3 %
-1 % 47.7
B Sector -5 % 33 % 24 % -10 % -60 %
Total average 1 % 15 % 25 %
50 52 53
49 50 52
26 25
38
49
45
28
38 38
45
60
47
40
0
10
20
30
40
50
60
70
2020.10.30 2020.11.27 2020.12.28 2021.01.27 2021.02.26 2021.03.29
Stock price rise probability score
A sector
B sector
Total average
4% 2%
-7%
2% 3%
-5%
33%
24%
-10%
-60%
1%
15%
25%
-28%
-19%
-80%
-60%
-40%
-20%
0%
20%
40%
2020.11.27 2020.12.28 2021.01.27 2021.02.26 2021.03.29
Increase rate of stock price rise
A sector
B sector
Total average
posco](data:image/gif;base64,R0lGODlhAQABAIAAAAAAAP///yH5BAEAAAAALAAAAAABAAEAAAIBRAA7)
Empfohlen
Empfohlen
Weitere ähnliche Inhalte
Was ist angesagt?
Was ist angesagt? (20)
Ähnlich wie posco 005490 Algorithm Investment Report
Ähnlich wie posco 005490 Algorithm Investment Report (20)
Mehr von 알고리즘 기업분석 컨설팅-알기컨,algikeon
Mehr von 알고리즘 기업분석 컨설팅-알기컨,algikeon (20)
Kürzlich hochgeladen
Kürzlich hochgeladen (20)
posco 005490 Algorithm Investment Report
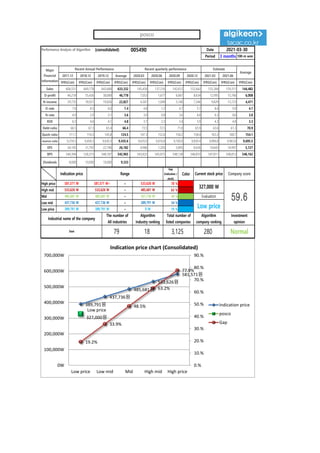
- 1. Performance Analysis of Algorithm (consolidated) 005490 Date Period 3 months 100-m won 2017.12 2018.12 2019.12 Average 2020.03 2020.06 2020.09 2020.12 2021.03 2021.06 IFRS(Con) IFRS(Con) IFRS(Con) IFRS(Con) IFRS(Con) IFRS(Con) IFRS(Con) IFRS(Con) IFRS(Con) IFRS(Con) IFRS(Con) Sales 606,551 649,778 643,668 633,332 145,458 137,216 142,612 152,642 155,384 159,311 144,482 O-profit 46,218 55,426 38,689 46,778 7,053 1,677 6,667 8,634 12,995 15,766 6,008 N-income 29,735 18,921 19,826 22,827 4,347 1,049 5,140 7,346 9,829 13,723 4,471 O-rate 7.6 8.5 6.0 7.4 4.8 1.2 4.7 5.7 8.4 9.9 4.1 N-rate 4.9 2.9 3.1 3.6 3.0 0.8 3.6 4.8 6.3 8.6 3.0 ROE 6.3 4.0 4.1 4.8 3.7 2.3 3.4 3.9 4.3 4.8 3.3 Debt-ratio 66.5 67.3 65.4 66.4 73.5 72.5 71.8 65.9 63.6 61.3 70.9 Quick-ratio 111.1 116.5 145.8 124.5 147.3 152.6 158.2 158.4 163.3 168.7 154.1 reserve-ratio 9,218.3 9,458.3 9,630.3 9,435.6 9,635.0 9,616.8 9,700.0 9,830.4 9,896.8 9,963.6 9,695.5 EPS 34,105 21,702 22,740 26,182 4,986 1,203 5,895 8,426 10,643 14,997 5,127 BPS 544,394 536,315 548,187 542,965 543,825 545,875 548,138 546,810 547,811 548,813 546,162 Dividends 8,000 10,000 10,000 9,333 2021-03-30 Major Financial Information Recent Annual Performance Recent quarterly performance Estimate Average Gap (Indication / stock) Color High price ~ 78 % High mid ~ 63 % Mid ~ 49 % Low mid ~ 34 % Low price ~ 19 % Indication price Range Current stock price Company score 533,626 W 533,626 W 485,681 W 485,681 W 485,681 W 437,736 W Evaluation 581,571 W 581,571 W~ 533,626 W 327,000 W 59.6 437,736 W 437,736 W 389,791 W Low price Normal 389,791 W 389,791 W 0 W Industrial name of the company The number of All industries Algorithm Industry ranking Total number of listed companies Algorithm company ranking Investment opinion Steel 79 18 3,125 280 389,791원 437,736원 485,681원 533,626원 581,571원 Low price 327,000원 19.2% 33.9% 48.5% 63.2% 77.9% 0.% 10.% 20.% 30.% 40.% 50.% 60.% 70.% 80.% 90.% 0W 100,000W 200,000W 300,000W 400,000W 500,000W 600,000W 700,000W Low price Low mid Mid High mid High price Indication price chart (Consolidated) Indication price posco Gap posco
- 2. [Price for scheduled purchasing] Arbitrarily made Algorithm stocks Trading Strategies (consolidated) 005490 Date Period Gap (Indication / stock) Color 2021-03-30 3 months Current stock price Evaluation Stock price rise probability score Investment opinion Prospective purchase amount 327,000 W Low price 44.0 Normal 10,000,000 W Suggested Purchase Amount 4,620,820 W Number of stocks purchased 14 Indication price Range Buying / Selling Buying / Selling [Stocks] High price 581,571 W 581,571 W~ ~ 533,626 W 78 % -3,597,323 W -6 High mid 533,626 W 533,626 W ~ 485,681 W 63 % -2,919,815 W -5 Mid 485,681 W 485,681 W ~ 437,736 W 49 % -2,242,307 W -5 Low mid 437,736 W 437,736 W ~ 389,791 W 34 % -1,564,799 W -4 low price 389,791 W 389,791 W ~ 0 W 19 % -887,290 W -2 Stock price rise probability score A Sector 49.6 51.8 52.9 49.2 50.1 51.8 44.0 B Sector 26.3 25.0 37.5 49.2 44.6 27.9 Total average 2020.10.30 2020.11.27 2020.12.28 2021.01.27 2021.02.26 2021.03.29 37.9 38.4 45.2 60.4 47.3 39.9 -28 % -19 % 2020.11.27 2020.12.28 2021.01.27 2021.02.26 2021.03.29 Total of increase rate Total score A Sector 4 % 2 % -7 % 2 % 3 % -1 % 47.7 B Sector -5 % 33 % 24 % -10 % -60 % Total average 1 % 15 % 25 % 50 52 53 49 50 52 26 25 38 49 45 28 38 38 45 60 47 40 0 10 20 30 40 50 60 70 2020.10.30 2020.11.27 2020.12.28 2021.01.27 2021.02.26 2021.03.29 Stock price rise probability score A sector B sector Total average 4% 2% -7% 2% 3% -5% 33% 24% -10% -60% 1% 15% 25% -28% -19% -80% -60% -40% -20% 0% 20% 40% 2020.11.27 2020.12.28 2021.01.27 2021.02.26 2021.03.29 Increase rate of stock price rise A sector B sector Total average posco
- 3. 정보와 완전 정보 결 투자판단 있습니 위배 무단으 숙지하 Compliance notice ① The information provided by The Algorithm Company Analysis Consulting is obtained through reliable data and information and The Algorithm Company Analysis Program (TACAP), but its accuracy or completeness are not guaranteed. Furthermore, it may change over time.Therefore, we are not legally responsible for the results of the data provided by The Algorithm Company Analysis Consulting because of information errors or omissions. ② The Algorithm Company Analysis Consulting and all the information provided on it site are reference materials for investment decisions and the final responsibility of investment is up to users utilizing this information. ③ The Algorithm Company Analysis Consulting and its site do not do anything that violates the related laws such as discretionary transaction. ④ Users can not reallocate and recycle the information provided by The Algorithm Company Analysis Consulting firm let alone the information provided by its Site. ⑤ Be sure to know about application period of this algorithm analysis report in order to improve its accuracy. Tel : 070 - 4667 - 5009 Email : tacac@tacac.co.kr Homepage : tacac.co.kr Blog : tacac.blog.me SERVICES M&A, IPO, RECOVER, CORPORATE RESTRUCTURING, MANAGEMENT OF TECHNOLOGY, BUSINESS STRATEGY, FAMILY BUSINESS Request : http://tacac.co.kr/?page_id=1374 ① Consulting is o The Algorithm accuracy or com change over tim results of the d Consulting bec ② information pr investment dec up ③ do anything th transaction. ④ The Algorithm information pr ⑤ analysis report