posco 005490 Algorithm Investment Report
•
0 gefällt mir•52 views

posco 005490 Algorithm Investment Report
![[Price for scheduled purchasing]
Arbitrarily made
Algorithm stocks Trading Strategies (consolidated) 005490 Date
Period
Gap
(Indication /
stock)
Color
low price 265,497 W 265,497 W ~ 0 W 19 % -857,988 W -3
Low mid 308,672 W 308,672 W ~ 265,497 W 38 % -1,729,668 W -6
Mid 351,847 W 351,847 W ~ 308,672 W 58 % -2,601,347 W -7
High mid 395,022 W 395,022 W ~ 351,847 W 77 % -3,473,027 W -9
Suggested Purchase
Amount 4,502,247 W
Number of stocks
purchased 20
Indication price Range Buying / Selling Buying / Selling [Stocks]
High price 438,197 W 438,197 W~ ~ 395,022 W 97 % -4,344,706 W -10
2019-10-22
3 months
Current stock price Evaluation
Stock price rise
probability score
Investment opinion Prospective purchase amount
223,000 W Low price 43.6 Normal 10,000,000 W
46.5 49.1 37.2 53.3 39.4 31.0
2019.05.24 2019.06.24 2019.07.22 2019.08.20 2019.09.19 2019.10.21
Stock price rise
probability score
A Sector 48.8 47.8 46.1 43.9 50.1 41.1
43.6B Sector 44.2 50.4 28.3 43.9 28.8 20.8
Total average
2019.07.22 2019.08.20 2019.09.19 2019.10.21
Total of
increase rate
Total score
A Sector -2 % -4 % -5 % 12 % -22 %
-12 % 38.0B Sector 12 % -78 % 36 % -53 % -38 %
Total average 5 % -32 % 30 % -35 % -27 %
2019.06.24
49 48 46 44
50
41
44
50
28
44
29
21
46 49
37
53
39
31
0
10
20
30
40
50
60
2019.05.24 2019.06.24 2019.07.22 2019.08.20 2019.09.19 2019.10.21
Stock price rise probability score
A sector
B sector
Total average
-2% -4% -5%
12%
-22%
12%
-78%
36%
-53%
-38%
5%
-32%
30%
-35%
-27%
-100%
-80%
-60%
-40%
-20%
0%
20%
40%
60%
2019.06.24 2019.07.22 2019.08.20 2019.09.19 2019.10.21
Increase rate of stock price rise
A sector
B sector
Total average
posco](data:image/gif;base64,R0lGODlhAQABAIAAAAAAAP///yH5BAEAAAAALAAAAAABAAEAAAIBRAA7)
Empfohlen
Empfohlen
Weitere ähnliche Inhalte
Was ist angesagt?
Was ist angesagt? (20)
Ähnlich wie posco 005490 Algorithm Investment Report
Ähnlich wie posco 005490 Algorithm Investment Report (20)
Mehr von 알고리즘 기업분석 컨설팅-알기컨,algikeon
Mehr von 알고리즘 기업분석 컨설팅-알기컨,algikeon (20)
Kürzlich hochgeladen
Kürzlich hochgeladen (20)
posco 005490 Algorithm Investment Report
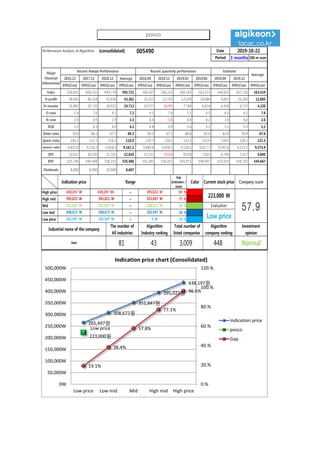
- 1. Performance Analysis of Algorithm (consolidated) 005490 Date Period 3 months 100-m won 2016.12 2017.12 2018.12 Average 2018.09 2018.12 2019.03 2019.06 2019.09 2019.12 IFRS(Con) IFRS(Con) IFRS(Con) IFRS(Con) IFRS(Con) IFRS(Con) IFRS(Con) IFRS(Con) IFRS(Con) IFRS(Con) IFRS(Con) Sales 530,835 606,551 649,778 595,721 164,107 166,215 160,142 163,213 164,625 167,136 163,419 O-profit 28,443 46,218 55,426 43,362 15,311 12,715 12,029 10,686 9,819 10,283 12,685 N-income 10,482 29,735 18,921 19,713 10,577 -8,295 7,784 6,814 6,418 6,737 4,220 O-rate 5.4 7.6 8.5 7.2 9.3 7.6 7.5 6.5 6.0 6.2 7.8 N-rate 2.0 4.9 2.9 3.3 6.4 -5.0 4.9 4.2 3.9 4.0 2.6 ROE 2.3 6.3 4.0 4.2 8.8 0.9 5.4 5.2 5.1 5.2 5.1 Debt-ratio 74.0 66.5 67.3 69.3 69.2 67.3 68.8 65.0 62.4 59.9 67.6 Quick-ratio 105.2 111.1 116.5 110.9 120.7 116.5 123.1 125.9 130.9 136.1 121.5 reserve-ratio 8,825.0 9,218.3 9,458.3 9,167.2 9,689.6 9,458.3 9,538.1 9,617.7 9,595.4 9,573.2 9,575.9 EPS 12,022 34,105 21,702 22,610 12,131 -9,514 8,928 7,815 6,749 7,317 4,840 BPS 525,749 544,394 536,315 535,486 551,381 536,315 541,875 549,097 553,923 558,792 544,667 Dividends 8,000 8,000 10,000 8,667 Major Financial Information Recent Annual Performance Recent quarterly performance Estimate Average 2019-10-22 Gap (Indication / stock) Color High price ~ 97 % High mid ~ 77 % Mid ~ 58 % Low mid ~ 38 % Low price ~ 19 % Normal 265,497 W 265,497 W 0 W Industrial name of the company The number of All industries Algorithm Industry ranking Total number of listed companies Algorithm company ranking Investment opinion Steel 81 43 3,009 448 395,022 W 395,022 W 351,847 W 351,847 W 351,847 W 308,672 W Evaluation 438,197 W 438,197 W~ 395,022 W 223,000 W 57.9308,672 W 308,672 W 265,497 W Low price Indication price Range Current stock price Company score 265,497원 308,672원 351,847원 395,022원 438,197원 Low price 223,000원 19.1% 38.4% 57.8% 77.1% 96.5% 0.% 20.% 40.% 60.% 80.% 100.% 120.% 0W 50,000W 100,000W 150,000W 200,000W 250,000W 300,000W 350,000W 400,000W 450,000W 500,000W Low price Low mid Mid High mid High price Indication price chart (Consolidated) Indication price posco Gap posco
- 2. [Price for scheduled purchasing] Arbitrarily made Algorithm stocks Trading Strategies (consolidated) 005490 Date Period Gap (Indication / stock) Color low price 265,497 W 265,497 W ~ 0 W 19 % -857,988 W -3 Low mid 308,672 W 308,672 W ~ 265,497 W 38 % -1,729,668 W -6 Mid 351,847 W 351,847 W ~ 308,672 W 58 % -2,601,347 W -7 High mid 395,022 W 395,022 W ~ 351,847 W 77 % -3,473,027 W -9 Suggested Purchase Amount 4,502,247 W Number of stocks purchased 20 Indication price Range Buying / Selling Buying / Selling [Stocks] High price 438,197 W 438,197 W~ ~ 395,022 W 97 % -4,344,706 W -10 2019-10-22 3 months Current stock price Evaluation Stock price rise probability score Investment opinion Prospective purchase amount 223,000 W Low price 43.6 Normal 10,000,000 W 46.5 49.1 37.2 53.3 39.4 31.0 2019.05.24 2019.06.24 2019.07.22 2019.08.20 2019.09.19 2019.10.21 Stock price rise probability score A Sector 48.8 47.8 46.1 43.9 50.1 41.1 43.6B Sector 44.2 50.4 28.3 43.9 28.8 20.8 Total average 2019.07.22 2019.08.20 2019.09.19 2019.10.21 Total of increase rate Total score A Sector -2 % -4 % -5 % 12 % -22 % -12 % 38.0B Sector 12 % -78 % 36 % -53 % -38 % Total average 5 % -32 % 30 % -35 % -27 % 2019.06.24 49 48 46 44 50 41 44 50 28 44 29 21 46 49 37 53 39 31 0 10 20 30 40 50 60 2019.05.24 2019.06.24 2019.07.22 2019.08.20 2019.09.19 2019.10.21 Stock price rise probability score A sector B sector Total average -2% -4% -5% 12% -22% 12% -78% 36% -53% -38% 5% -32% 30% -35% -27% -100% -80% -60% -40% -20% 0% 20% 40% 60% 2019.06.24 2019.07.22 2019.08.20 2019.09.19 2019.10.21 Increase rate of stock price rise A sector B sector Total average posco
- 3. 정보와 완전 정보 결 투자판단 있습니 위배 무단으 숙지하 Compliance notice ① The information provided by The Algorithm Company Analysis Consulting is obtained through reliable data and information and The Algorithm Company Analysis Program (TACAP), but its accuracy or completeness are not guaranteed. Furthermore, it may change over time.Therefore, we are not legally responsible for the results of the data provided by The Algorithm Company Analysis Consulting because of information errors or omissions. ② The Algorithm Company Analysis Consulting and all the information provided on it site are reference materials for investment decisions and the final responsibility of investment is up to users utilizing this information. ③ The Algorithm Company Analysis Consulting and its site do not do anything that violates the related laws such as discretionary transaction. ④ Users can not reallocate and recycle the information provided by The Algorithm Company Analysis Consulting firm let alone the information provided by its Site. ⑤ Be sure to know about application period of this algorithm analysis report in order to improve its accuracy. Tel : 070 - 4667 - 5009 Email : tacac@tacac.co.kr Homepage : tacac.co.kr Blog : tacac.blog.me SERVICES M&A, IPO, RECOVER, CORPORATE RESTRUCTURING, MANAGEMENT OF TECHNOLOGY, BUSINESS STRATEGY, FAMILY BUSINESS Request : http://tacac.co.kr/?page_id=1374 ① Consulting The Algori accuracy o change ove results of Consulting ② informatio investmen up ③ do anythin transaction ④ The Algori informatio ⑤ analysis re