mode tour 080160 Algorithm Investment Report
•
0 gefällt mir•69 views

This document provides a performance analysis of an algorithm company over several periods from 2017-2021. It includes key financial metrics such as sales, operating profit, net income, debt ratios, and stock prices. It also evaluates the company's current stock price, compares it to indication price ranges, and provides a stock purchase strategy based on the analysis.
![[Price for scheduled purchasing]
Arbitrarily made
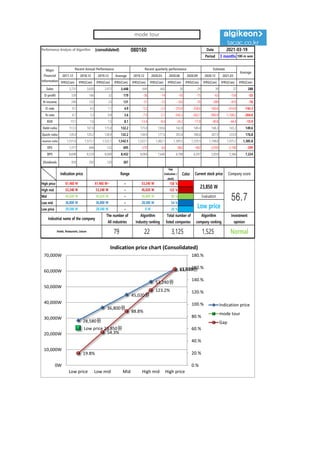
Algorithm stocks Trading Strategies (consolidated) 080160 Date
Period
Gap
(Indication /
stock)
Color
2021-03-19
3 months
Current stock price Evaluation
Stock price rise
probability score
Investment opinion Prospective purchase amount
23,850 W Low price 55.8 Normal 10,000,000 W
Suggested Purchase
Amount 4,424,020 W
Number of stocks
purchased 185
Indication price Range Buying / Selling Buying / Selling [Stocks]
High price 61,460 W 61,460 W~ ~ 53,240 W 158 % -6,976,387 W All selling
High mid 53,240 W 53,240 W ~ 45,020 W 123 % -5,451,615 W All selling
Mid 45,020 W 45,020 W ~ 36,800 W 89 % -3,926,843 W -87
Low mid 36,800 W 36,800 W ~ 28,580 W 54 % -2,402,071 W -65
low price 28,580 W 28,580 W ~ 0 W 20 % -877,299 W -31
Stock price rise
probability score
A Sector 50.8 55.0 50.5 51.2 51.3 49.6
55.8
B Sector 13.8 36.3 33.8 51.2 39.2 29.6
Total average
2020.10.21 2020.11.18 2020.12.16 2021.01.18 2021.02.17 2021.03.18
32.3 45.6 42.1 29.6 45.2 39.6
35 % -14 %
2020.11.18 2020.12.16 2021.01.18 2021.02.17 2021.03.18
Total of
increase rate
Total score
A Sector 8 % -9 % 1 % 0 % -3 %
-0 % 48.0
B Sector 62 % -7 % 34 % -31 % -32 %
Total average 29 % -8 % -42 %
51
55
51 51 51 50
14
36 34
51
39
30
32
46
42
30
45
40
0
10
20
30
40
50
60
2020.10.21 2020.11.18 2020.12.16 2021.01.18 2021.02.17 2021.03.18
Stock price rise probability score
A sector
B sector
Total average
8%
-9%
1% 0% -3%
62%
-7%
34%
-31% -32%
29%
-8%
-42%
35%
-14%
-60%
-40%
-20%
0%
20%
40%
60%
80%
2020.11.18 2020.12.16 2021.01.18 2021.02.17 2021.03.18
Increase rate of stock price rise
A sector
B sector
Total average
mode tour](data:image/gif;base64,R0lGODlhAQABAIAAAAAAAP///yH5BAEAAAAALAAAAAABAAEAAAIBRAA7)
Empfohlen
Empfohlen
Weitere ähnliche Inhalte
Was ist angesagt?
Was ist angesagt? (20)
Ähnlich wie mode tour 080160 Algorithm Investment Report
Ähnlich wie mode tour 080160 Algorithm Investment Report (20)
Mehr von 알고리즘 기업분석 컨설팅-알기컨,algikeon
Mehr von 알고리즘 기업분석 컨설팅-알기컨,algikeon (20)
Kürzlich hochgeladen
Kürzlich hochgeladen (20)
mode tour 080160 Algorithm Investment Report
- 1. Performance Analysis of Algorithm (consolidated) 080160 Date Period 3 months 100-m won 2017.12 2018.12 2019.12 Average 2019.12 2020.03 2020.06 2020.09 2020.12 2021.03 IFRS(Con) IFRS(Con) IFRS(Con) IFRS(Con) IFRS(Con) IFRS(Con) IFRS(Con) IFRS(Con) IFRS(Con) IFRS(Con) IFRS(Con) Sales 3,721 3,650 2,972 3,448 649 442 30 29 39 37 288 O-profit 339 166 32 179 -36 -14 -93 -75 -63 -154 -55 N-income 249 122 23 131 -51 -12 -163 -76 -389 -410 -76 O-rate 9.1 4.5 1.1 4.9 -5.5 -3.2 -310.0 -258.6 -160.6 -414.8 -144.3 N-rate 6.7 3.3 0.8 3.6 -7.9 -2.7 -543.3 -262.1 -990.9 -1,108.2 -204.0 ROE 15.1 7.6 1.5 8.1 -13.4 -8.4 -24.2 -17.8 -40.8 -44.4 -15.9 Debt-ratio 113.3 107.6 175.8 132.2 175.8 130.6 142.8 149.4 146.3 143.2 149.6 Quick-ratio 128.4 129.2 138.9 132.2 138.9 177.9 203.8 186.6 207.9 233.9 176.8 reserve-ratio 1,531.6 1,573.7 1,522.1 1,542.5 1,522.1 1,482.1 1,309.5 1,229.5 1,148.8 1,075.2 1,385.8 EPS 1,317 646 122 695 -270 -63 -862 -402 -2,059 -2,100 -399 BPS 8,698 8,529 8,069 8,432 8,069 7,640 6,788 6,397 5,859 5,366 7,224 Dividends 450 350 120 307 2021-03-19 Major Financial Information Recent Annual Performance Recent quarterly performance Estimate Average Gap (Indication / stock) Color High price ~ 158 % High mid ~ 123 % Mid ~ 89 % Low mid ~ 54 % Low price ~ 20 % Indication price Range Current stock price Company score 53,240 W 53,240 W 45,020 W 45,020 W 45,020 W 36,800 W Evaluation 61,460 W 61,460 W~ 53,240 W 23,850 W 56.7 36,800 W 36,800 W 28,580 W Low price Normal 28,580 W 28,580 W 0 W Industrial name of the company The number of All industries Algorithm Industry ranking Total number of listed companies Algorithm company ranking Investment opinion Hotels, Restaurants, Leisure 79 22 3,125 1,525 28,580원 36,800원 45,020원 53,240원 61,460원 Low price 23,850원 19.8% 54.3% 88.8% 123.2% 157.7% 0.% 20.% 40.% 60.% 80.% 100.% 120.% 140.% 160.% 180.% 0W 10,000W 20,000W 30,000W 40,000W 50,000W 60,000W 70,000W Low price Low mid Mid High mid High price Indication price chart (Consolidated) Indication price mode tour Gap mode tour
- 2. [Price for scheduled purchasing] Arbitrarily made Algorithm stocks Trading Strategies (consolidated) 080160 Date Period Gap (Indication / stock) Color 2021-03-19 3 months Current stock price Evaluation Stock price rise probability score Investment opinion Prospective purchase amount 23,850 W Low price 55.8 Normal 10,000,000 W Suggested Purchase Amount 4,424,020 W Number of stocks purchased 185 Indication price Range Buying / Selling Buying / Selling [Stocks] High price 61,460 W 61,460 W~ ~ 53,240 W 158 % -6,976,387 W All selling High mid 53,240 W 53,240 W ~ 45,020 W 123 % -5,451,615 W All selling Mid 45,020 W 45,020 W ~ 36,800 W 89 % -3,926,843 W -87 Low mid 36,800 W 36,800 W ~ 28,580 W 54 % -2,402,071 W -65 low price 28,580 W 28,580 W ~ 0 W 20 % -877,299 W -31 Stock price rise probability score A Sector 50.8 55.0 50.5 51.2 51.3 49.6 55.8 B Sector 13.8 36.3 33.8 51.2 39.2 29.6 Total average 2020.10.21 2020.11.18 2020.12.16 2021.01.18 2021.02.17 2021.03.18 32.3 45.6 42.1 29.6 45.2 39.6 35 % -14 % 2020.11.18 2020.12.16 2021.01.18 2021.02.17 2021.03.18 Total of increase rate Total score A Sector 8 % -9 % 1 % 0 % -3 % -0 % 48.0 B Sector 62 % -7 % 34 % -31 % -32 % Total average 29 % -8 % -42 % 51 55 51 51 51 50 14 36 34 51 39 30 32 46 42 30 45 40 0 10 20 30 40 50 60 2020.10.21 2020.11.18 2020.12.16 2021.01.18 2021.02.17 2021.03.18 Stock price rise probability score A sector B sector Total average 8% -9% 1% 0% -3% 62% -7% 34% -31% -32% 29% -8% -42% 35% -14% -60% -40% -20% 0% 20% 40% 60% 80% 2020.11.18 2020.12.16 2021.01.18 2021.02.17 2021.03.18 Increase rate of stock price rise A sector B sector Total average mode tour
- 3. 정보와 완전 정보 결 투자판단 있습니 위배 무단으 숙지하 Compliance notice ① The information provided by The Algorithm Company Analysis Consulting is obtained through reliable data and information and The Algorithm Company Analysis Program (TACAP), but its accuracy or completeness are not guaranteed. Furthermore, it may change over time.Therefore, we are not legally responsible for the results of the data provided by The Algorithm Company Analysis Consulting because of information errors or omissions. ② The Algorithm Company Analysis Consulting and all the information provided on it site are reference materials for investment decisions and the final responsibility of investment is up to users utilizing this information. ③ The Algorithm Company Analysis Consulting and its site do not do anything that violates the related laws such as discretionary transaction. ④ Users can not reallocate and recycle the information provided by The Algorithm Company Analysis Consulting firm let alone the information provided by its Site. ⑤ Be sure to know about application period of this algorithm analysis report in order to improve its accuracy. Tel : 070 - 4667 - 5009 Email : tacac@tacac.co.kr Homepage : tacac.co.kr Blog : tacac.blog.me SERVICES M&A, IPO, RECOVER, CORPORATE RESTRUCTURING, MANAGEMENT OF TECHNOLOGY, BUSINESS STRATEGY, FAMILY BUSINESS Request : http://tacac.co.kr/?page_id=1374 ① Consulting is o The Algorithm accuracy or com change over tim results of the d Consulting bec ② information pr investment dec up ③ do anything th transaction. ④ The Algorithm information pr ⑤ analysis report