hanwha aerospace 012450 Algorithm Investment Report
•
0 gefällt mir•239 views

hanwha aerospace 012450 Algorithm Investment Report
![[Price for scheduled purchasing]
Arbitrarily made
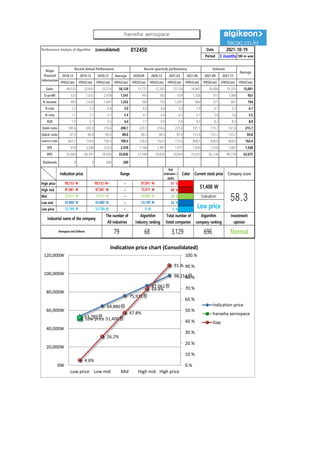
Algorithm stocks Trading Strategies (consolidated) 012450 Date
Period
Gap
(Indication /
stock)
Color
low price 53,789 W 53,789 W ~ 0 W 5 % -221,015 W -4
Low mid 64,880 W 64,880 W ~ 53,789 W 26 % -1,247,050 W -19
Mid 75,971 W 75,971 W ~ 64,880 W 48 % -2,273,084 W -30
High mid 87,061 W 87,061 W ~ 75,971 W 69 % -3,299,119 W -38
Suggested Purchase
Amount 4,755,149 W
Number of stocks
purchased 93
Indication price Range Buying / Selling Buying / Selling [Stocks]
High price 98,152 W 98,152 W~ ~ 87,061 W 91 % -4,325,154 W -44
2021-10-19
3 months
Current stock price Evaluation
Stock price rise
probability score
Investment opinion Prospective purchase amount
51,400 W Low price 50.6 Normal 10,000,000 W
37.4 40.7 42.7 27.1 38.0 35.4
2021.05.21 1.06.18 2021.07.16 2021.08.13 2021.09.13 2021.10.18
Stock price rise
probability score
A Sector 45.3 44.8 49.6 48.3 45.2 42.8
50.6
B Sector 29.6 36.7 35.8 48.3 30.8 27.9
Total average
2021.07.16 2021.08.13 2021.09.13 2021.10.18
Total of
increase rate
Total score
A Sector -1 % 10 % -3 % -7 % -6 %
-5 % 45.0
B Sector 19 % -2 % 26 % -57 % -10 %
Total average 8 % 5 % -58 % 29 % -7 %
1.06.18
45 45
50 48
45 43
30
37 36
48
31
28
37
41 43
27
38 35
0
10
20
30
40
50
60
2021.05.21 1.06.18 2021.07.16 2021.08.13 2021.09.13 2021.10.18
Stock price rise probability score
A sector
B sector
Total average
-1%
10%
-3% -7% -6%
19%
-2%
26%
-57%
-10%
8% 5%
-58%
29%
-7%
-80%
-60%
-40%
-20%
0%
20%
40%
1.06.18 2021.07.16 2021.08.13 2021.09.13 2021.10.18
Increase rate of stock price rise
A sector
B sector
Total average
hanwha aerospace](data:image/gif;base64,R0lGODlhAQABAIAAAAAAAP///yH5BAEAAAAALAAAAAABAAEAAAIBRAA7)
Empfohlen
Empfohlen
Weitere ähnliche Inhalte
Was ist angesagt?
Was ist angesagt? (20)
Ähnlich wie hanwha aerospace 012450 Algorithm Investment Report
Ähnlich wie hanwha aerospace 012450 Algorithm Investment Report (20)
Mehr von 알고리즘 기업분석 컨설팅-알기컨,algikeon
Mehr von 알고리즘 기업분석 컨설팅-알기컨,algikeon (20)
Kürzlich hochgeladen
Kürzlich hochgeladen (20)
hanwha aerospace 012450 Algorithm Investment Report
- 1. Performance Analysis of Algorithm (consolidated) 012450 Date Period 3 months 100-m won 2018.12 2019.12 2020.12 Average 2020.09 2020.12 2021.03 2021.06 2021.09 2021.12 IFRS(Con) IFRS(Con) IFRS(Con) IFRS(Con) IFRS(Con) IFRS(Con) IFRS(Con) IFRS(Con) IFRS(Con) IFRS(Con) IFRS(Con) Sales 44,532 52,641 53,214 50,129 13,771 17,242 12,124 16,865 16,006 19,355 15,001 O-profit 532 1,652 2,439 1,541 943 763 659 1,326 971 1,068 923 N-income 493 1,624 1,647 1,255 560 755 1,001 860 571 687 794 O-rate 1.2 3.1 4.6 3.0 6.8 4.4 5.4 7.9 6.1 5.5 6.1 N-rate 1.1 3.1 3.1 2.4 4.1 4.4 8.3 5.1 3.6 3.6 5.5 ROE 1.9 5.7 5.5 4.4 7.7 8.9 9.9 8.9 8.2 8.3 8.9 Debt-ratio 180.6 205.0 216.6 200.7 229.5 216.6 225.6 191.1 175.7 161.6 215.7 Quick-ratio 81.3 96.8 90.5 89.6 88.5 90.5 87.0 112.4 131.2 155.7 94.6 reserve-ratio 667.2 710.6 750.5 709.4 726.0 750.5 772.6 808.5 838.0 868.6 764.4 EPS 974 3,208 3,253 2,478 1,106 1,491 1,977 1,699 1,070 1,081 1,568 BPS 52,060 56,397 59,050 55,836 57,440 59,050 59,854 74,355 82,136 90,730 62,675 Dividends 0 0 600 200 Major Financial Information Recent Annual Performance Recent quarterly performance Estimate Average 2021-10-19 Gap (Indication / stock) Color High price ~ 91 % High mid ~ 69 % Mid ~ 48 % Low mid ~ 26 % Low price ~ 5 % Normal 53,789 W 53,789 W 0 W Industrial name of the company The number of All industries Algorithm Industry ranking Total number of listed companies Algorithm company ranking Investment opinion Aerospace and Defense 79 68 3,129 696 87,061 W 87,061 W 75,971 W 75,971 W 75,971 W 64,880 W Evaluation 98,152 W 98,152 W~ 87,061 W 51,400 W 58.3 64,880 W 64,880 W 53,789 W Low price Indication price Range Current stock price Company score 53,789원 64,880원 75,971원 87,061원 98,152원 Low price 51,400원 4.6% 26.2% 47.8% 69.4% 91.% 0.% 10.% 20.% 30.% 40.% 50.% 60.% 70.% 80.% 90.% 100.% 0W 20,000W 40,000W 60,000W 80,000W 100,000W 120,000W Low price Low mid Mid High mid High price Indication price chart (Consolidated) Indication price hanwha aerospace Gap hanwha aerospace
- 2. [Price for scheduled purchasing] Arbitrarily made Algorithm stocks Trading Strategies (consolidated) 012450 Date Period Gap (Indication / stock) Color low price 53,789 W 53,789 W ~ 0 W 5 % -221,015 W -4 Low mid 64,880 W 64,880 W ~ 53,789 W 26 % -1,247,050 W -19 Mid 75,971 W 75,971 W ~ 64,880 W 48 % -2,273,084 W -30 High mid 87,061 W 87,061 W ~ 75,971 W 69 % -3,299,119 W -38 Suggested Purchase Amount 4,755,149 W Number of stocks purchased 93 Indication price Range Buying / Selling Buying / Selling [Stocks] High price 98,152 W 98,152 W~ ~ 87,061 W 91 % -4,325,154 W -44 2021-10-19 3 months Current stock price Evaluation Stock price rise probability score Investment opinion Prospective purchase amount 51,400 W Low price 50.6 Normal 10,000,000 W 37.4 40.7 42.7 27.1 38.0 35.4 2021.05.21 1.06.18 2021.07.16 2021.08.13 2021.09.13 2021.10.18 Stock price rise probability score A Sector 45.3 44.8 49.6 48.3 45.2 42.8 50.6 B Sector 29.6 36.7 35.8 48.3 30.8 27.9 Total average 2021.07.16 2021.08.13 2021.09.13 2021.10.18 Total of increase rate Total score A Sector -1 % 10 % -3 % -7 % -6 % -5 % 45.0 B Sector 19 % -2 % 26 % -57 % -10 % Total average 8 % 5 % -58 % 29 % -7 % 1.06.18 45 45 50 48 45 43 30 37 36 48 31 28 37 41 43 27 38 35 0 10 20 30 40 50 60 2021.05.21 1.06.18 2021.07.16 2021.08.13 2021.09.13 2021.10.18 Stock price rise probability score A sector B sector Total average -1% 10% -3% -7% -6% 19% -2% 26% -57% -10% 8% 5% -58% 29% -7% -80% -60% -40% -20% 0% 20% 40% 1.06.18 2021.07.16 2021.08.13 2021.09.13 2021.10.18 Increase rate of stock price rise A sector B sector Total average hanwha aerospace
- 3. 정보와 완전 정보 결 투자판단 있습니 위배 무단으 숙지하 Compliance notice ① The information provided by The Algorithm Company Analysis Consulting is obtained through reliable data and information and The Algorithm Company Analysis Program (TACAP), but its accuracy or completeness are not guaranteed. Furthermore, it may change over time.Therefore, we are not legally responsible for the results of the data provided by The Algorithm Company Analysis Consulting because of information errors or omissions. ② The Algorithm Company Analysis Consulting and all the information provided on it site are reference materials for investment decisions and the final responsibility of investment is up to users utilizing this information. ③ The Algorithm Company Analysis Consulting and its site do not do anything that violates the related laws such as discretionary transaction. ④ Users can not reallocate and recycle the information provided by The Algorithm Company Analysis Consulting firm let alone the information provided by its Site. ⑤ Be sure to know about application period of this algorithm analysis report in order to improve its accuracy. Tel : 070 - 4667 - 5009 Email : tacac@tacac.co.kr Homepage : tacac.co.kr Blog : tacac.blog.me SERVICES M&A, IPO, RECOVER, CORPORATE RESTRUCTURING, MANAGEMENT OF TECHNOLOGY, BUSINESS STRATEGY, FAMILY BUSINESS Request : http://tacac.co.kr/?page_id=1374 ① Consulting is o The Algorithm accuracy or com change over tim results of the d Consulting bec ② information pr investment dec up ③ do anything th transaction. ④ The Algorithm information pr ⑤ analysis report