daewoong pharmaceutical 069620 Algorithm Investment Report
•
1 gefällt mir•74 views

daewoong pharmaceutical 069620 Algorithm Investment Report
![[Price for scheduled purchasing]
Arbitrarily made
Algorithm stocks Trading Strategies (consolidated) 069620 Date
Period
Gap
(Indication /
stock)
Color
2021-06-10
3 months
Current stock price Evaluation
Stock price rise
probability score
Investment opinion Prospective purchase amount
160,000 W High mid 32.3 Normal 2,500,000 W
Suggested Purchase
Amount 675,579 W
Number of stocks
purchased 4
Indication price Range Buying / Selling Buying / Selling [Stocks]
High price 185,057 W 185,057 W~ ~ 160,712 W 16 % -105,801 W -1
High mid 160,712 W 160,712 W ~ 136,366 W 0 % -3,006 W -0
Mid 136,366 W 136,366 W ~ 112,021 W -15 % 99,790 W 1
Low mid 112,021 W 112,021 W ~ 87,675 W -30 % 202,586 W 2
low price 87,675 W 87,675 W ~ 0 W -45 % 305,381 W 3
Stock price rise
probability score
A Sector 46.0 43.4 49.9 53.9 52.6 51.2
32.3
B Sector 16.7 19.6 20.4 53.9 28.8 40.0
Total average
2021.01.13 2021.02.10 2021.03.15 2021.04.12 2021.05.11 2021.06.09
31.3 31.5 35.2 12.5 40.7 45.6
69 % 11 %
2021.02.10 2021.03.15 2021.04.12 2021.05.11 2021.06.09
Total of
increase rate
Total score
A Sector -6 % 13 % 7 % -3 % -3 %
-18 % 52.3
B Sector 15 % 4 % 62 % -88 % 28 %
Total average 1 % 10 % -181 %
46 43
50
54 53 51
17
20 20
54
29
40
31 32
35
13
41
46
0
10
20
30
40
50
60
2021.01.13 2021.02.10 2021.03.15 2021.04.12 2021.05.11 2021.06.09
Stock price rise probability score
A sector
B sector
Total average
-6%
13% 7% -3% -3%
15% 4%
62%
-88%
28%
1% 10%
-181%
69%
11%
-200%
-150%
-100%
-50%
0%
50%
100%
2021.02.10 2021.03.15 2021.04.12 2021.05.11 2021.06.09
Increase rate of stock price rise
A sector
B sector
Total average
daewoong pharmaceutical](data:image/gif;base64,R0lGODlhAQABAIAAAAAAAP///yH5BAEAAAAALAAAAAABAAEAAAIBRAA7)
Empfohlen
Empfohlen
Weitere ähnliche Inhalte
Was ist angesagt?
Was ist angesagt? (20)
Ähnlich wie daewoong pharmaceutical 069620 Algorithm Investment Report
Ähnlich wie daewoong pharmaceutical 069620 Algorithm Investment Report (19)
Mehr von 알고리즘 기업분석 컨설팅-알기컨,algikeon
Mehr von 알고리즘 기업분석 컨설팅-알기컨,algikeon (20)
Kürzlich hochgeladen
Kürzlich hochgeladen (20)
daewoong pharmaceutical 069620 Algorithm Investment Report
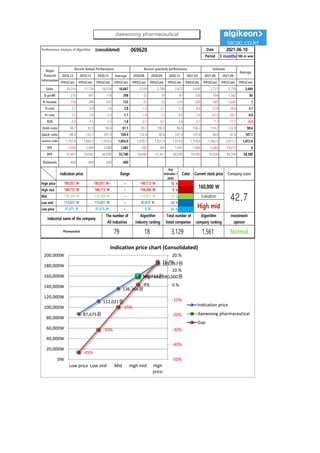
- 1. Performance Analysis of Algorithm (consolidated) 069620 Date Period 3 months 100-m won 2018.12 2019.12 2020.12 Average 2020.06 2020.09 2020.12 2021.03 2021.06 2021.09 IFRS(Con) IFRS(Con) IFRS(Con) IFRS(Con) IFRS(Con) IFRS(Con) IFRS(Con) IFRS(Con) IFRS(Con) IFRS(Con) IFRS(Con) Sales 10,314 11,134 10,554 10,667 2,539 2,768 2,672 2,696 2,727 2,758 2,669 O-profit 276 447 170 298 -32 59 87 226 594 1,562 85 N-income -154 289 241 125 -35 33 214 -209 -587 -1,647 1 O-rate 2.7 4.0 1.6 2.8 -1.3 2.1 3.3 8.4 21.8 56.6 3.1 N-rate -1.5 2.6 2.3 1.1 -1.4 1.2 8.0 -7.8 -21.5 -59.7 0.0 ROE -2.5 4.5 3.5 1.8 -2.1 -0.1 3.4 -2.7 -7.1 -17.1 -0.4 Debt-ratio 98.7 95.9 96.6 97.1 90.7 100.9 96.6 106.2 114.2 122.8 98.6 Quick-ratio 88.4 132.1 107.9 109.4 132.0 80.8 107.9 107.8 96.8 87.6 107.1 reserve-ratio 1,791.4 1,869.3 1,910.0 1,856.9 1,830.3 1,831.4 1,910.0 1,918.6 1,962.9 2,013.3 1,872.6 EPS -1,329 2,494 2,080 1,082 -302 285 1,847 -1,804 -5,063 -14,213 6 BPS 52,457 54,882 60,000 55,780 56,600 57,411 60,000 59,509 59,930 60,354 58,380 Dividends 600 600 600 600 2021-06-10 Major Financial Information Recent Annual Performance Recent quarterly performance Estimate Average Gap (Indication / stock) Color High price ~ 16 % High mid ~ 0 % Mid ~ -15 % Low mid ~ -30 % Low price ~ -45 % Indication price Range Current stock price Company score 160,712 W 160,712 W 136,366 W 136,366 W 136,366 W 112,021 W Evaluation 185,057 W 185,057 W~ 160,712 W 160,000 W 42.7 112,021 W 112,021 W 87,675 W High mid Normal 87,675 W 87,675 W 0 W Industrial name of the company The number of All industries Algorithm Industry ranking Total number of listed companies Algorithm company ranking Investment opinion Pharmaceutical 79 18 3,129 1,561 87,675원 112,021원 136,366원 160,712원 185,057원 High mid 160,000원 -45% -30% -15% .4% 15.7% -50% -40% -30% -20% -10% 0.% 10.% 20.% 0W 20,000W 40,000W 60,000W 80,000W 100,000W 120,000W 140,000W 160,000W 180,000W 200,000W Low price Low mid Mid High mid High price Indication price chart (Consolidated) Indication price daewoong pharmaceutical Gap daewoong pharmaceutical
- 2. [Price for scheduled purchasing] Arbitrarily made Algorithm stocks Trading Strategies (consolidated) 069620 Date Period Gap (Indication / stock) Color 2021-06-10 3 months Current stock price Evaluation Stock price rise probability score Investment opinion Prospective purchase amount 160,000 W High mid 32.3 Normal 2,500,000 W Suggested Purchase Amount 675,579 W Number of stocks purchased 4 Indication price Range Buying / Selling Buying / Selling [Stocks] High price 185,057 W 185,057 W~ ~ 160,712 W 16 % -105,801 W -1 High mid 160,712 W 160,712 W ~ 136,366 W 0 % -3,006 W -0 Mid 136,366 W 136,366 W ~ 112,021 W -15 % 99,790 W 1 Low mid 112,021 W 112,021 W ~ 87,675 W -30 % 202,586 W 2 low price 87,675 W 87,675 W ~ 0 W -45 % 305,381 W 3 Stock price rise probability score A Sector 46.0 43.4 49.9 53.9 52.6 51.2 32.3 B Sector 16.7 19.6 20.4 53.9 28.8 40.0 Total average 2021.01.13 2021.02.10 2021.03.15 2021.04.12 2021.05.11 2021.06.09 31.3 31.5 35.2 12.5 40.7 45.6 69 % 11 % 2021.02.10 2021.03.15 2021.04.12 2021.05.11 2021.06.09 Total of increase rate Total score A Sector -6 % 13 % 7 % -3 % -3 % -18 % 52.3 B Sector 15 % 4 % 62 % -88 % 28 % Total average 1 % 10 % -181 % 46 43 50 54 53 51 17 20 20 54 29 40 31 32 35 13 41 46 0 10 20 30 40 50 60 2021.01.13 2021.02.10 2021.03.15 2021.04.12 2021.05.11 2021.06.09 Stock price rise probability score A sector B sector Total average -6% 13% 7% -3% -3% 15% 4% 62% -88% 28% 1% 10% -181% 69% 11% -200% -150% -100% -50% 0% 50% 100% 2021.02.10 2021.03.15 2021.04.12 2021.05.11 2021.06.09 Increase rate of stock price rise A sector B sector Total average daewoong pharmaceutical
- 3. 정보와 완전 정보 결 투자판단 있습니 위배 무단으 숙지하 Compliance notice ① The information provided by The Algorithm Company Analysis Consulting is obtained through reliable data and information and The Algorithm Company Analysis Program (TACAP), but its accuracy or completeness are not guaranteed. Furthermore, it may change over time.Therefore, we are not legally responsible for the results of the data provided by The Algorithm Company Analysis Consulting because of information errors or omissions. ② The Algorithm Company Analysis Consulting and all the information provided on it site are reference materials for investment decisions and the final responsibility of investment is up to users utilizing this information. ③ The Algorithm Company Analysis Consulting and its site do not do anything that violates the related laws such as discretionary transaction. ④ Users can not reallocate and recycle the information provided by The Algorithm Company Analysis Consulting firm let alone the information provided by its Site. ⑤ Be sure to know about application period of this algorithm analysis report in order to improve its accuracy. Tel : 070 - 4667 - 5009 Email : tacac@tacac.co.kr Homepage : tacac.co.kr Blog : tacac.blog.me SERVICES M&A, IPO, RECOVER, CORPORATE RESTRUCTURING, MANAGEMENT OF TECHNOLOGY, BUSINESS STRATEGY, FAMILY BUSINESS Request : http://tacac.co.kr/?page_id=1374 ① Consulting is o The Algorithm accuracy or com change over tim results of the d Consulting bec ② information pr investment dec up ③ do anything th transaction. ④ The Algorithm information pr ⑤ analysis report