cj logistics 000120 Algorithm Investment Report
•
0 gefällt mir•85 views

cj logistics 000120 Algorithm Investment Report
![[Price for scheduled purchasing]
Arbitrarily made
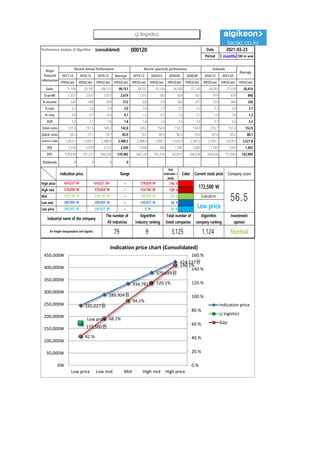
Algorithm stocks Trading Strategies (consolidated) 000120 Date
Period
Gap
(Indication /
stock)
Color
2021-03-23
3 months
Current stock price Evaluation
Stock price rise
probability score
Investment opinion Prospective purchase amount
172,500 W Low price 47.0 Normal 10,000,000 W
Suggested Purchase
Amount 4,280,660 W
Number of stocks
purchased 25
Indication price Range Buying / Selling Buying / Selling [Stocks]
High price 424,537 W 424,537 W~ ~ 379,659 W 146 % -6,254,397 W All selling
High mid 379,659 W 379,659 W ~ 334,782 W 120 % -5,140,743 W All selling
Mid 334,782 W 334,782 W ~ 289,904 W 94 % -4,027,089 W -12
Low mid 289,904 W 289,904 W ~ 245,027 W 68 % -2,913,435 W -10
low price 245,027 W 245,027 W ~ 0 W 42 % -1,799,781 W -7
Stock price rise
probability score
A Sector 45.2 46.8 47.1 48.8 49.3 41.4
47.0
B Sector 19.6 37.9 30.4 48.8 51.3 37.9
Total average
2020.10.23 2020.11.20 2020.12.18 2021.01.20 2021.02.19 2021.03.22
32.4 42.3 38.8 50.8 50.3 39.7
-1 % -27 %
2020.11.20 2020.12.18 2021.01.20 2021.02.19 2021.03.22
Total of
increase rate
Total score
A Sector 3 % 1 % 3 % 1 % -19 %
2 % 48.7
B Sector 48 % -25 % 38 % 5 % -35 %
Total average 24 % -9 % 24 %
45 47 47 49 49
41
20
38
30
49 51
38
32
42
39
51 50
40
0
10
20
30
40
50
60
2020.10.23 2020.11.20 2020.12.18 2021.01.20 2021.02.19 2021.03.22
Stock price rise probability score
A sector
B sector
Total average
3% 1% 3% 1%
-19%
48%
-25%
38%
5%
-35%
24%
-9%
24%
-1%
-27%
-40%
-20%
0%
20%
40%
60%
2020.11.20 2020.12.18 2021.01.20 2021.02.19 2021.03.22
Increase rate of stock price rise
A sector
B sector
Total average
cj logistics](data:image/gif;base64,R0lGODlhAQABAIAAAAAAAP///yH5BAEAAAAALAAAAAABAAEAAAIBRAA7)
Empfohlen
Empfohlen
Weitere ähnliche Inhalte
Was ist angesagt?
Was ist angesagt? (20)
Ähnlich wie cj logistics 000120 Algorithm Investment Report
Ähnlich wie cj logistics 000120 Algorithm Investment Report (20)
Mehr von 알고리즘 기업분석 컨설팅-알기컨,algikeon
Mehr von 알고리즘 기업분석 컨설팅-알기컨,algikeon (20)
Kürzlich hochgeladen
Kürzlich hochgeladen (20)
cj logistics 000120 Algorithm Investment Report
- 1. Performance Analysis of Algorithm (consolidated) 000120 Date Period 3 months 100-m won 2017.12 2018.12 2019.12 Average 2019.12 2020.03 2020.06 2020.09 2020.12 2021.03 IFRS(Con) IFRS(Con) IFRS(Con) IFRS(Con) IFRS(Con) IFRS(Con) IFRS(Con) IFRS(Con) IFRS(Con) IFRS(Con) IFRS(Con) Sales 71,104 92,197 104,151 89,151 28,257 25,154 26,500 27,745 28,262 27,239 26,914 O-profit 2,357 2,427 3,072 2,619 1,013 582 839 925 919 819 840 N-income 542 666 509 572 328 114 362 475 533 484 320 O-rate 3.3 2.6 2.9 3.0 3.6 2.3 3.2 3.3 3.3 3.0 3.1 N-rate 0.8 0.7 0.5 0.7 1.2 0.5 1.4 1.7 1.9 1.8 1.2 ROE 2.0 2.1 1.4 1.8 3.6 2.4 3.3 3.6 3.7 3.6 3.2 Debt-ratio 127.8 151.3 149.2 142.8 149.2 154.8 153.7 154.0 155.7 157.4 152.9 Quick-ratio 94.2 72.1 79.7 82.0 79.7 80.9 80.3 79.4 81.6 85.2 80.1 reserve-ratio 2,453.1 2,500.1 2,488.4 2,480.5 2,488.4 2,498.1 2,533.9 2,567.0 2,595.1 2,624.3 2,521.8 EPS 2,376 2,919 2,231 2,509 1,438 500 1,587 2,082 1,781 1,947 1,402 BPS 120,978 137,237 160,229 139,482 160,229 162,254 162,815 166,638 168,836 171,063 162,984 Dividends 0 0 0 0 2021-03-23 Major Financial Information Recent Annual Performance Recent quarterly performance Estimate Average Gap (Indication / stock) Color High price ~ 146 % High mid ~ 120 % Mid ~ 94 % Low mid ~ 68 % Low price ~ 42 % Indication price Range Current stock price Company score 379,659 W 379,659 W 334,782 W 334,782 W 334,782 W 289,904 W Evaluation 424,537 W 424,537 W~ 379,659 W 172,500 W 56.5 289,904 W 289,904 W 245,027 W Low price Normal 245,027 W 245,027 W 0 W Industrial name of the company The number of All industries Algorithm Industry ranking Total number of listed companies Algorithm company ranking Investment opinion Air freight transportation and logistics 79 9 3,125 1,124 245,027원 289,904원 334,782원 379,659원 424,537원 Low price 172,500원 42.% 68.1% 94.1% 120.1% 146.1% 0.% 20.% 40.% 60.% 80.% 100.% 120.% 140.% 160.% 0W 50,000W 100,000W 150,000W 200,000W 250,000W 300,000W 350,000W 400,000W 450,000W Low price Low mid Mid High mid High price Indication price chart (Consolidated) Indication price cj logistics Gap cj logistics
- 2. [Price for scheduled purchasing] Arbitrarily made Algorithm stocks Trading Strategies (consolidated) 000120 Date Period Gap (Indication / stock) Color 2021-03-23 3 months Current stock price Evaluation Stock price rise probability score Investment opinion Prospective purchase amount 172,500 W Low price 47.0 Normal 10,000,000 W Suggested Purchase Amount 4,280,660 W Number of stocks purchased 25 Indication price Range Buying / Selling Buying / Selling [Stocks] High price 424,537 W 424,537 W~ ~ 379,659 W 146 % -6,254,397 W All selling High mid 379,659 W 379,659 W ~ 334,782 W 120 % -5,140,743 W All selling Mid 334,782 W 334,782 W ~ 289,904 W 94 % -4,027,089 W -12 Low mid 289,904 W 289,904 W ~ 245,027 W 68 % -2,913,435 W -10 low price 245,027 W 245,027 W ~ 0 W 42 % -1,799,781 W -7 Stock price rise probability score A Sector 45.2 46.8 47.1 48.8 49.3 41.4 47.0 B Sector 19.6 37.9 30.4 48.8 51.3 37.9 Total average 2020.10.23 2020.11.20 2020.12.18 2021.01.20 2021.02.19 2021.03.22 32.4 42.3 38.8 50.8 50.3 39.7 -1 % -27 % 2020.11.20 2020.12.18 2021.01.20 2021.02.19 2021.03.22 Total of increase rate Total score A Sector 3 % 1 % 3 % 1 % -19 % 2 % 48.7 B Sector 48 % -25 % 38 % 5 % -35 % Total average 24 % -9 % 24 % 45 47 47 49 49 41 20 38 30 49 51 38 32 42 39 51 50 40 0 10 20 30 40 50 60 2020.10.23 2020.11.20 2020.12.18 2021.01.20 2021.02.19 2021.03.22 Stock price rise probability score A sector B sector Total average 3% 1% 3% 1% -19% 48% -25% 38% 5% -35% 24% -9% 24% -1% -27% -40% -20% 0% 20% 40% 60% 2020.11.20 2020.12.18 2021.01.20 2021.02.19 2021.03.22 Increase rate of stock price rise A sector B sector Total average cj logistics
- 3. 정보와 완전 정보 결 투자판단 있습니 위배 무단으 숙지하 Compliance notice ① The information provided by The Algorithm Company Analysis Consulting is obtained through reliable data and information and The Algorithm Company Analysis Program (TACAP), but its accuracy or completeness are not guaranteed. Furthermore, it may change over time.Therefore, we are not legally responsible for the results of the data provided by The Algorithm Company Analysis Consulting because of information errors or omissions. ② The Algorithm Company Analysis Consulting and all the information provided on it site are reference materials for investment decisions and the final responsibility of investment is up to users utilizing this information. ③ The Algorithm Company Analysis Consulting and its site do not do anything that violates the related laws such as discretionary transaction. ④ Users can not reallocate and recycle the information provided by The Algorithm Company Analysis Consulting firm let alone the information provided by its Site. ⑤ Be sure to know about application period of this algorithm analysis report in order to improve its accuracy. Tel : 070 - 4667 - 5009 Email : tacac@tacac.co.kr Homepage : tacac.co.kr Blog : tacac.blog.me SERVICES M&A, IPO, RECOVER, CORPORATE RESTRUCTURING, MANAGEMENT OF TECHNOLOGY, BUSINESS STRATEGY, FAMILY BUSINESS Request : http://tacac.co.kr/?page_id=1374 ① Consulting is o The Algorithm accuracy or com change over tim results of the d Consulting bec ② information pr investment dec up ③ do anything th transaction. ④ The Algorithm information pr ⑤ analysis report