cj 001040 Algorithm Investment Report
•
0 gefällt mir•88 views

cj 001040 Algorithm Investment Report
![[Price for scheduled purchasing]
Arbitrarily made
Algorithm stocks Trading Strategies (consolidated) 001040 Date
Period
Gap
(Indication /
stock)
Color
2020-12-26
3 months
Current stock price Evaluation
Stock price rise
probability score
Investment opinion Prospective purchase amount
88,400 W Low price 54.5 Normal 9,800,000 W
Suggested Purchase
Amount 5,035,182 W
Number of stocks
purchased 57
Indication price Range Buying / Selling Buying / Selling [Stocks]
High price 233,146 W 233,146 W~ ~ 214,098 W 164 % -8,244,604 W All selling
High mid 214,098 W 214,098 W ~ 195,050 W 142 % -7,159,652 W All selling
Mid 195,050 W 195,050 W ~ 176,002 W 121 % -6,074,700 W All selling
Low mid 176,002 W 176,002 W ~ 156,954 W 99 % -4,989,747 W -28
low price 156,954 W 156,954 W ~ 0 W 78 % -3,904,795 W -25
Stock price rise
probability score
A Sector 48.5 47.3 50.4 43.9 50.2 47.5
54.5B Sector 40.4 60.0 27.5 43.9 38.3 25.4
Total average
2020.07.30 2020.08.28 2020.09.25 2020.10.29 2020.11.26 2020.12.24
44.5 53.6 38.9 50.0 44.3 36.4
-13 % -21 %
2020.08.28 2020.09.25 2020.10.29 2020.11.26 2020.12.24
Total of
increase rate
Total score
A Sector -3 % 6 % -15 % 12 % -6 %
-7 % 43.0B Sector 33 % -118 % 37 % -15 % -51 %
Total average 17 % -38 % 22 %
49 47 50
44
50 47
40
60
28
44
38
25
44
54
39
50
44
36
0
10
20
30
40
50
60
70
2020.07.30 2020.08.28 2020.09.25 2020.10.29 2020.11.26 2020.12.24
Stock price rise probability score
A sector
B sector
Total average
-3%
6%
-15%
12%
-6%
33%
-118%
37%
-15%
-51%
17%
-38%
22%
-13%
-21%
-150%
-100%
-50%
0%
50%
2020.08.28 2020.09.25 2020.10.29 2020.11.26 2020.12.24
Increase rate of stock price rise
A sector
B sector
Total average
cj](data:image/gif;base64,R0lGODlhAQABAIAAAAAAAP///yH5BAEAAAAALAAAAAABAAEAAAIBRAA7)
Empfohlen
Empfohlen
Weitere ähnliche Inhalte
Was ist angesagt?
Was ist angesagt? (20)
Ähnlich wie cj 001040 Algorithm Investment Report
Ähnlich wie cj 001040 Algorithm Investment Report (20)
Mehr von 알고리즘 기업분석 컨설팅-알기컨,algikeon
Mehr von 알고리즘 기업분석 컨설팅-알기컨,algikeon (20)
Kürzlich hochgeladen
Kürzlich hochgeladen (20)
cj 001040 Algorithm Investment Report
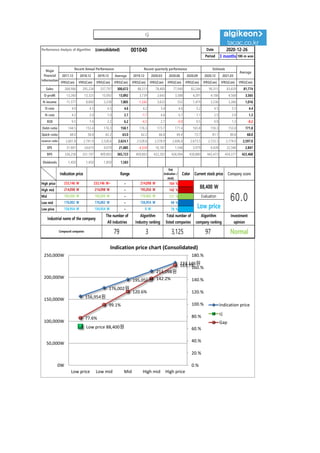
- 1. Performance Analysis of Algorithm (consolidated) 001040 Date Period 3 months 100-m won 2017.12 2018.12 2019.12 Average 2019.12 2020.03 2020.06 2020.09 2020.12 2021.03 IFRS(Con) IFRS(Con) IFRS(Con) IFRS(Con) IFRS(Con) IFRS(Con) IFRS(Con) IFRS(Con) IFRS(Con) IFRS(Con) IFRS(Con) Sales 268,986 295,234 337,797 300,672 88,513 78,400 77,940 82,244 90,315 83,659 81,774 O-profit 13,260 13,325 15,092 13,892 3,739 2,643 3,588 4,291 4,106 4,568 3,565 N-income 11,377 8,800 3,238 7,805 -1,542 3,633 552 1,419 2,236 3,266 1,016 O-rate 4.9 4.5 4.5 4.6 4.2 3.4 4.6 5.2 4.5 5.5 4.4 N-rate 4.2 3.0 1.0 2.7 -1.7 4.6 0.7 1.7 2.5 3.9 1.3 ROE 9.5 7.0 2.2 6.2 -4.2 2.7 -0.0 0.5 0.9 1.3 -0.2 Debt-ratio 144.5 153.4 176.3 158.1 176.3 173.7 171.4 165.8 159.3 153.0 171.8 Quick-ratio 68.0 58.8 62.2 63.0 62.2 66.8 69.4 73.7 81.1 89.6 68.0 reserve-ratio 2,601.8 2,741.9 2,528.6 2,624.1 2,528.6 2,578.9 2,606.8 2,673.5 2,723.3 2,774.0 2,597.0 EPS 31,901 24,675 9,079 21,885 -4,324 10,187 1,548 3,979 9,428 22,340 2,847 BPS 336,258 351,107 409,803 365,723 409,803 422,283 426,904 430,880 442,473 454,377 422,468 Dividends 1,450 1,450 1,850 1,583 2020-12-26 Major Financial Information Recent Annual Performance Recent quarterly performance Estimate Average Gap (Indication / stock) Color High price ~ 164 % High mid ~ 142 % Mid ~ 121 % Low mid ~ 99 % Low price ~ 78 % Indication price Range Current stock price Company score 214,098 W 214,098 W 195,050 W 195,050 W 195,050 W 176,002 W Evaluation 233,146 W 233,146 W~ 214,098 W 88,400 W 60.0176,002 W 176,002 W 156,954 W Low price Normal 156,954 W 156,954 W 0 W Industrial name of the company The number of All industries Algorithm Industry ranking Total number of listed companies Algorithm company ranking Investment opinion Compound companies 79 3 3,125 97 156,954원 176,002원 195,050원 214,098원 233,146원 Low price 88,400원 77.6% 99.1% 120.6% 142.2% 163.7% 0.% 20.% 40.% 60.% 80.% 100.% 120.% 140.% 160.% 180.% 0W 50,000W 100,000W 150,000W 200,000W 250,000W Low price Low mid Mid High mid High price Indication price chart (Consolidated) Indication price cj Gap cj
- 2. [Price for scheduled purchasing] Arbitrarily made Algorithm stocks Trading Strategies (consolidated) 001040 Date Period Gap (Indication / stock) Color 2020-12-26 3 months Current stock price Evaluation Stock price rise probability score Investment opinion Prospective purchase amount 88,400 W Low price 54.5 Normal 9,800,000 W Suggested Purchase Amount 5,035,182 W Number of stocks purchased 57 Indication price Range Buying / Selling Buying / Selling [Stocks] High price 233,146 W 233,146 W~ ~ 214,098 W 164 % -8,244,604 W All selling High mid 214,098 W 214,098 W ~ 195,050 W 142 % -7,159,652 W All selling Mid 195,050 W 195,050 W ~ 176,002 W 121 % -6,074,700 W All selling Low mid 176,002 W 176,002 W ~ 156,954 W 99 % -4,989,747 W -28 low price 156,954 W 156,954 W ~ 0 W 78 % -3,904,795 W -25 Stock price rise probability score A Sector 48.5 47.3 50.4 43.9 50.2 47.5 54.5B Sector 40.4 60.0 27.5 43.9 38.3 25.4 Total average 2020.07.30 2020.08.28 2020.09.25 2020.10.29 2020.11.26 2020.12.24 44.5 53.6 38.9 50.0 44.3 36.4 -13 % -21 % 2020.08.28 2020.09.25 2020.10.29 2020.11.26 2020.12.24 Total of increase rate Total score A Sector -3 % 6 % -15 % 12 % -6 % -7 % 43.0B Sector 33 % -118 % 37 % -15 % -51 % Total average 17 % -38 % 22 % 49 47 50 44 50 47 40 60 28 44 38 25 44 54 39 50 44 36 0 10 20 30 40 50 60 70 2020.07.30 2020.08.28 2020.09.25 2020.10.29 2020.11.26 2020.12.24 Stock price rise probability score A sector B sector Total average -3% 6% -15% 12% -6% 33% -118% 37% -15% -51% 17% -38% 22% -13% -21% -150% -100% -50% 0% 50% 2020.08.28 2020.09.25 2020.10.29 2020.11.26 2020.12.24 Increase rate of stock price rise A sector B sector Total average cj
- 3. 정보와 완전 정보 결 투자판단 있습니 위배 무단으 숙지하 Compliance notice ① The information provided by The Algorithm Company Analysis Consulting is obtained through reliable data and information and The Algorithm Company Analysis Program (TACAP), but its accuracy or completeness are not guaranteed. Furthermore, it may change over time.Therefore, we are not legally responsible for the results of the data provided by The Algorithm Company Analysis Consulting because of information errors or omissions. ② The Algorithm Company Analysis Consulting and all the information provided on it site are reference materials for investment decisions and the final responsibility of investment is up to users utilizing this information. ③ The Algorithm Company Analysis Consulting and its site do not do anything that violates the related laws such as discretionary transaction. ④ Users can not reallocate and recycle the information provided by The Algorithm Company Analysis Consulting firm let alone the information provided by its Site. ⑤ Be sure to know about application period of this algorithm analysis report in order to improve its accuracy. Tel : 070 - 4667 - 5009 Email : tacac@tacac.co.kr Homepage : tacac.co.kr Blog : tacac.blog.me SERVICES M&A, IPO, RECOVER, CORPORATE RESTRUCTURING, MANAGEMENT OF TECHNOLOGY, BUSINESS STRATEGY, FAMILY BUSINESS Request : http://tacac.co.kr/?page_id=1374 ① Consulting is o The Algorithm accuracy or com change over tim results of the d Consulting bec ② information pr investment dec up ③ do anything th transaction. ④ The Algorithm information pr ⑤ analysis report