1. 4.10 Very Good
3.67 Good
5.00 Excellent
4.50 Very Good
4.25 Very Good
3.60 Good
3.60 Good
2.12 Needs Improvement
3.00 Good
2.20 Needs Improvement
2.50 Needs Improvement
1.00 Poor
2.00 Needs Improvement
2.00 Needs Improvement
3.00 Good
3.00 Good
3.00 Good
3.00 Good
3.00 Good
3.00 Good
3.00 Good
3.33 Good
3.00 Good
3.00 Good
4.00 Very Good
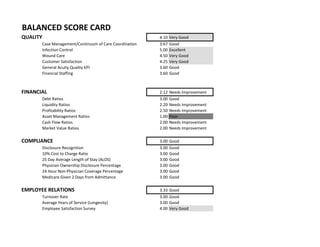
BALANCED SCORE CARD
Physician Ownership Disclosure Percentage
Asset Management Ratios
Cash Flow Ratios
Market Value Ratios
COMPLIANCE
Disclosure Recognition
10% Cost to Charge Ratio
25 Day Average Length of Stay (ALOS)
24 Hour Non-Physician Coverage Percentage
EMPLOYEE RELATIONS
Turnover Rate
Average Years of Service (Longevity)
Employee Satisfaction Survey
Medicare Given 2 Days from Admittance
QUALITY
Financial Staffing
Debt Ratios
Profitability Ratios
Case Management/Continuum of Care Coordination
Infection Control
Wound Care
Customer Satisfaction
General Acuity Quality KPI
Liquidity Ratios
FINANCIAL
3. BENCHMARK 2015 YTD SCORE DESCRIPTOR
Case Management/Continnum of Care Coordination 3.67 Good
6.0% 1.9% 5 Excellent
10.0% 0.0% 5 Excellent
25.0% 13.5% 3 Good
18.0% 17.3% 3 Good
20.0% 20.0% 3 Good
65.0% 63.0% 3 Good
7.0% 5.0% 4 Very Good
8.0% 13.0% 2 Needs Improvement
12.0% 8.0% 5 Excellent
5.0 Excellent
4.5 0 5.0 Excellent
2.8 0 5.0 Excellent
0.95 0 5.0 Excellent
0 5.0 Excellent
0 5.0 Excellent
0.7 5.0 Excellent
90.0% 96.9% 5.0 Excellent
0.59 0 5.0 Excellent
4.5 Very Good
0.8 0 5.0 Excellent
90.0% 92.5% 4.0 Very Good
31
4.25 Very Good
50.0% 75.0% 5.0 Excellent
97.4% 95.0% 4.0 Very Good
97.4% 90.0% 4.0 Very Good
QUALITY KPI
1. Returns to the STACH
2. Readmit to STACH in 30 Days
3. Home Discharge Rate
4. Mortality Rate
5. Short Stay Outliers
8. Ventilator Associated Pneumonia (VAP)
1. Hospital Acquired Pressure Ulcers (HAPU)
2. Wound Improvement
Infection Control Measures
6. Window Management
Wound Care/HBO Core Measures
7. Full Stay Discharges
8. High Cost Outliers
9. Zero Paid Days
1. Hospital Acquired Infections (HAI)
2. Catheter Associated Urinary Tract Infections (CAUTI)
3. Central Line Acquired Blood Stream Infection (CLABSI)
4. MRSA
5. VRE
6. C-Difficile Rate
7. Hand Hygiene Rate
3. Volume of HBO Treatments
Customer Satisfaction
1. Patient Satisfaction Survey Response Rate
2. Positive Recommendation
3. Positive Perception
4. 93.9% 90.0% 4.0 Very Good
3.6 Good
1.58 1.34 2.0 Needs Improvement
2.64 2.3 3.0 Good
0.49 0 5.0 Excellent
0.1 0.1 3.0 Good
1.67 0.7 5.0 Excellent
69.0% 66.7%
3.6 Good
8.7 8.4 2.0 Needs Improvement
300.00$ $309.00 3.0 Good
3.0% 3.5% 5.0 Excellent
0 0.005 3.0 Good
2 1.8 5.0 Excellent
8. Speech Therapy Cost Per Treatment
7. Patient Safety Survey Results
General Acuity Related Quality Indicators
Financial Staffing Key Indicators
5. Medication Error Rate
6. Vent Wean Rate
1. Nursing Hours Per Patient Day (NHPPD)
2. Nursing Dollars Per Patient Day (N$PPD)
3. Overtime Hours as % of Total Productive Hours
4. Contract Labor Hours as % of Total Productive Hours
5. Respiratory Hours Per Patient Day (RTHPPD)
6. Physical Therapy Cost Per Treatment
7. Occupational Therapy Cost Per Treatment
1. Case Mix Index (CMI)
2. Patient Fall Rate
3. Patient Falls with Injury
4. Restraints Days Rate
6. Physician Satisfaction Survey Results
4. Call Light Response Rate
5. Employee Satisfaction Survey Results
5. PYYTD 2015 YTD SCORE DESCRIPTOR
3.00 Good
0.67 0.77 3.0 Good
0.78 0.84 3.0 Good
0.07 0.09 3.0 Good
3.59 5.39 3.0 Good
0.45 0.52 3.0 Good
2.20 Needs Improvement
0.89 0.89 3.0 Good
0.15 0.07 1.0 Unsatisfactory
0.93 0.93 3.0 Good
-295.00 -253.00 1.0 Unsatisfactory
0.89 0.89 3.0 Good
2.50 Needs Improvement
1. Cash Return on Capital Invested
2. DuPont Formula
172 221 3.0 Good
4. Effective Rate of Return
0.03 0.14 4.0 Very Good
6. Operating Expense Ratio
0.03 0.14 4.0 Very Good
8. Profitability Index
FINANCIAL KPI
Debt Ratios
1. Asset Coverage Ratio
2. Capitalization Ratio
3. Debt Ratio
5. Quick Ratio
4. Debt Service Coverage Ratio
5. Debt-to-Equity Ratio
10. Long Term Debt to Total Asset Ratio
11. Total Expense Ratio
Liquidity Ratios
1. Acid-Test Ratio
2. Cash Ratio
3. Current Ratio
4. Net Working Capital
7. Operating Margin
Profitability Ratios
3. EBITDA
5. Gross Profit Margin
6. Debt-to-Income Ratio
7. Equity Multiplier
8. Long Term Debt to Capitalization Ratio
9. Long Term Debt to Total Asset Ratio
6. -0.02 0.01 2.0 Poor
-0.04 0.02 1.0 Unsatisfactory
11. Return on Net Assets
-0.05 0.04 2.0 Poor
-0.03 0.09 3.0 Good
55.12 13.57 1.0 Unsatisfactory
1.0 Unsatisfactory
4. Days Inventory Outstanding
5. Days Payable Outstanding
1.50 0.38 1.0 Unsatisfactory
2.00 Needs Improvement
2.00 Needs Improvement
*$$$ in Thousands
9. Return on Assets
10. Return on Debt
7. Inventory Turnover
8. Receivable Turnover Ratio
Cash Flow Indicator Ratios
1. Cash Flow Coverage Ratio
12. Retun on Net Assets
13. Return on Revenue
14. Revenue per Employee
Asset Management Ratios
1. Account Payable Turnover Ratio
2. Asset Turnover
3. Enterprise Value Muliple
4. Net Asset Value per Share
5. Price to Earnings Ratio
6. Stock Price
2. Cash Flow Return on Investment
3. Free Cash Flows
4. Price/Cash Flow Ratio
Market Value Ratios
1. Dividend Payout Ratio
2. Dividend Yield
3. Capacity Utilization Rate
6. Fixed Asset Turnover
7. BENCHMARK 2015 YTD SCORE DESCRIPTOR
*No existing information. For illustrative purposes.
Turnover Rate
Average Years of Service (Longevity)
Employee Satisfaction Survey
EMPLOYEE RELATIONS
8. BENCHMARK 2015 YTD SCORE DESCRIPTOR
24 Hour Non-Physician Coverage Percentage
Disclosure Recognition
10% Cost to Charge Ratio
25 Day Average Length of Stay (ALOS)
Physician Ownership Disclosure Percentage
COMPLIANCE KPI
9. Medicare Given 2 Days from Admittance
*No existing information. For illustrative purposes.
10. DESCRIPTION NUMERIC SCORE
Excellent (<10%ile) 5
Very Good (10-25%ile) 4
Good (25-50%ile) 3
Need Improvement (50-75%ile) 2
Poor (75-90%ile) 1
Unsatisfactory (90+%ile) 0
BALANCED SCORECARD SCORING E.g.