1. GluA1 signal peptide determines the spatial assembly
of heteromeric AMPA receptors
Xue-Yan Hea,1
, Yan-Jun Lia,1
, Chakrapani Kalyanaramanb
, Li-Li Qiua,c
, Chen Chena
, Qi Xiaoa
, Wen-Xue Liua,d
, Wei Zhange
,
Jian-Jun Yangc
, Guiquan Chena
, Matthew P. Jacobsonb
, and Yun Stone Shia,2
a
State Key Laboratory of Pharmaceutical Biotechnology and MOE Key Laboratory of Model Animal for Disease Study, Model Animal Research Center,
Nanjing University, Nanjing 210061 China; b
Department of Pharmaceutical Chemistry, University of California, San Francisco, CA 94158; c
Department of
Anesthesiology, Zhongda Hospital, Medical School, Southeast University, Nanjing 210009, China; d
Department of Intensive Care Medicine, Zhongda
Hospital, Medical School, Southeast University, Nanjing 210009, China; and e
Institute of Chinese Integrative Medicine, Hebei Medical University,
Shijiazhuang 050017, China
Edited by Richard L. Huganir, The Johns Hopkins University School of Medicine, Baltimore, MD, and approved July 25, 2016 (received for review December
10, 2015)
AMPA-type glutamate receptors (AMPARs) mediate fast excit-
atory neurotransmission and predominantly assemble as heter-
otetramers in the brain. Recently, the crystal structures of
homotetrameric GluA2 demonstrated that AMPARs are assem-
bled with two pairs of conformationally distinct subunits, in a
dimer of dimers formation. However, the structure of hetero-
meric AMPARs remains unclear. Guided by the GluA2 structure,
we performed cysteine mutant cross-linking experiments in full-
length GluA1/A2, aiming to draw the heteromeric AMPAR ar-
chitecture. We found that the amino-terminal domains determine
the first level of heterodimer formation. When the dimers further
assemble into tetramers, GluA1 and GluA2 subunits have pre-
ferred positions, possessing a 1–2–1–2 spatial assembly. By swap-
ping the critical sequences, we surprisingly found that the spatial
assembly pattern is controlled by the excisable signal peptides.
Replacements with an unrelated GluK2 signal peptide demon-
strated that GluA1 signal peptide plays a critical role in determin-
ing the spatial priority. Our study thus uncovers the spatial
assembly of an important type of glutamate receptors in the brain
and reveals a novel function of signal peptides.
AMPA receptors | signal peptide | spatial assembly | stoichiometry
Ionotropic glutamate receptors mediate the excitatory neuro-
transmission in the brain (1). These receptors are homomeric
or heteromeric tetramers, which are divided into three groups—
NMDA, AMPA, and kainate receptors—based on their binding
preference to different agonists. Among them, AMPAR subunits
GluA1–4 form heteromeric as well as homomeric receptors. In
the brain, the GluA2 mRNA processing an A-to-I conversion re-
sults in the replacement of a neutral glutamine residue (GluA2Q)
to a positively charged arginine (GluA2R; GluA2 generally refers
to this edited isoform) at the pore region (2). This RNA editing
significantly changes the biophysical properties of AMPARs con-
taining GluA2 subunits. The receptors containing GluA2R are
Ca2+
-impermeable and have linear I–V curves, whereas receptors
without GluA2 are Ca2+
-permeable and show strong inward rec-
tifying I–V relationships (3, 4). In recombinant expression systems,
GluA1, GluA3, and GluA4 prefer to coassemble with GluA2 to
form heteromeric receptors, whereas they do form homomeric
receptors in the absence of GluA2 (5-8). GluA2-containing re-
ceptors are dominant in the brain, particularly in the pyramidal
neurons (9). In hippocampal CA3–CA1 synapses, the GluA1/A2 is
the major component of AMPARs, whereas GluA2/A3 contributes
to a lesser amount (9, 10).
How the heteromeric AMPARs are assembled is intriguing.
Biochemical and functional studies have revealed that AMPARs
are tetrameric assemblies (11–13). Biophysical studies have sug-
gested that GluA1 and GluA2 might randomly assemble into
heteromers so that all of the 3:1, 2:2, or 1:3 stoichiometries can
form, depending on the relative abundance of each subunits (14),
or the fixed 2:2 stoichiometry is preferred (5, 15). However, direct
evidence of how heteromeric AMPARs are assembled is lacking,
and the architectures of heteromeric AMPARs remain unclear.
Recently, high-resolution X-ray structures of ionotropic gluta-
mate receptors have provided1 detailed conformational information
on these receptors. The X-ray crystal structure of GluA2 homo-
mers demonstrates that the receptors have a twofold symmetry
(16–18), with two pairs of conformationally distinct subunits.
Viewed at the amino-terminal domain (ATD) level, the A-type
conformation represents the subunits away from the symmetric
axis, and the B-type conformation represents the subunits proxi-
mal to the symmetric center, suggesting that GluA2 homomers
are thus arranged in an A–B–A′–B′ architecture (16–18). The struc-
ture of heteromeric NMDA-type glutamate receptor (GluN1/N2B)
also shows a twofold symmetry, with GluN1 at the A positions
and GluN2B at the B positions in a 1–2–1–2 (GluN1–GluN2–
GluN1–GluN2) fashion (19). The ATD structure of heteromeric
kainate receptors (GluK2/K5) shows similar architecture, with
GluK5 at the A positions and GluK2 at the B positions (20).
Thus, it is suspected that the heteromeric AMPARs might pos-
sess a similar symmetry to NMDAR and kainate receptors.
Here, we used disulfide-bond cross-linking experiments to es-
tablish the GluA1/A2 heteromeric AMPAR assembly. We found
that GluA1/A2 prefers to form 2:2 stoichiometry with 1–2–1–2
(GluA1–GluA2–GluA1–GluA2) architecture, which was mainly
determined by the amino-terminal excisable signal peptides (SPs).
Furthermore, replacements with an unrelated GluK2 SP revealed
Significance
In the brain, AMPA-type glutamate receptors, especially het-
eromeric GluA1/A2s, are the major postsynaptic receptors me-
diating fast excitatory neurotransmission. Recently, the crystal
structure of GluA2 homomeric AMPA-type glutamate receptors
(AMPARs) revealed some interesting features, such as the four
subunits in each AMPAR are of two different conformations.
However, what the heteromeric GluA1/A2 receptors look like is
unknown. In this study, we used a biochemical technique called
cysteine cross-linking assay to analyze the spatial architecture
of GluA1/A2s. We determined that GluA1/GluA2s have pre-
ferred spatial assembly. Surprisingly, this spatial assembly pat-
tern is dictated by the excisable signal peptides, but not the
intrinsic sequences of the subunit proteins.
Author contributions: Y.S.S. designed research; X.-Y.H., Y.-J.L., L.-L.Q., C.C., W.-X.L., and Y.S.S.
performed research; C.C. established models; X.-Y.H., Y.-J.L., C.K., C.C., Q.X., W.Z., J.-J.Y., G.C.,
M.P.J., and Y.S.S. analyzed data; and X.Y.-H. and Y.S.S. wrote the paper.
The authors declare no conflict of interest.
This article is a PNAS Direct Submission.
1
X.-Y.H. and Y.-J.L. contributed equally to this work.
2
To whom correspondence should be addressed. Email: yunshi@nju.edu.cn.
This article contains supporting information online at www.pnas.org/lookup/suppl/doi:10.
1073/pnas.1524358113/-/DCSupplemental.
www.pnas.org/cgi/doi/10.1073/pnas.1524358113 PNAS | Published online September 6, 2016 | E5645–E5654
NEUROSCIENCEPNASPLUS
2. that the SP of GluA1 played a major role in determining AMPAR
spatial assembly. This work uncovered the architecture of GluA1/A2
AMPARs in the brain and revealed a novel function of SPs for
transmembrane proteins.
Results
GluA1 and GluA2 Form Heterodimers in ATDs. The crystal struc-
tures of homotetrameric GluA2 demonstrate that AMPARs are
assembled with two pairs of conformationally distinct subunits
(16–18). The different subunit conformations in the AMPAR
complex further increase the assembly complexity of heteromeric
AMPARs. Regarding GluA1/A2 receptors, if GluA1 and GluA2
can be randomly assembled, there would be eight different pos-
sible spatial arrangements (Fig. S1). For example, a receptor
composed of one GluA1 and three GluA2s (1:3 stoichiometry)
would have two possible architectures, such as 1–2–2–2 (with
GluA1 in the A-type conformation) and 2–1–2–2 (with GluA1 in
the B-type conformation) (Fig. S1A). Similarly, there would be
two assembly possibilities for a receptor with 3:1 stoichiometry
(Fig. S1B). If the receptor prefers to assemble in 2:2 stoichiom-
etry (15), there would be four differential spatial arrangements
(Fig. S1C). Even if the receptor has a fixed 2:2 stoichiometry and
the preferred spatial symmetry (5), it still could be assembled into
1–2–1–2 or 2–1–2–1 architecture.
To understand the assembly of heteromeric GluA1/A2 recep-
tors, we built a model of homomeric GluA1 receptors based on
the X-ray structure of homomeric GluA2 AMPAR [Protein
Data Bank identifier (PDB ID) 3KG2; ref. 18 and Fig. 1A].
The structure of the GluA1 model was Y-shaped, with four
subunits presenting two different conformations in the tetra-
mer, arranged in A–B–A′–B′ architecture (Fig. 1 A and B).
Both ATD and ligand-binding domain (LBD) assembled as
dimer of dimers. Notably, the subunit pairs that form the ATD
dimer swapped partners in the LBD.
To experimentally verify the dimer formation in ATDs and
LBDs in our GluA1 model, we generated a series of cysteine
mutants of GluA1 and GluA2 and tested the oligomer formation
by nonreducing Western blot assays. The wild-type (WT) GluA1
contains 13 native cysteine residues, which might interfere with
the introduced cysteines by forming spontaneous cross-linking
background bands (Fig. S2A). According to the GluA1 model,
Cys-57 and -305 in the ATD and Cys-714 and -769 in the LBD
probably form native disulfide bonds, and Cys-93, -89, -186, and
-421 are buried in the protein interior. The remaining five cys-
teine residues, including Cys-524, -585, -811, -825, and -875, were
mutated to nonreducing alanines. As expected, the mutated
GluA1 (GluA1m) showed reduced background on the non-
reducing Western gel (Fig. S2A). Similarly, we generated a mu-
tated GluA2 (GluA2m) in which four surface cysteine residues,
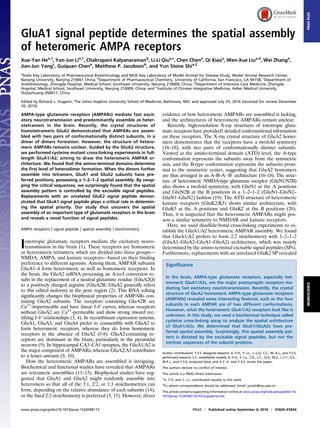
Fig. 1. Heteromeric dimers in the ATD and LBD of
GluA1/A2 receptor. (A) Homomeric GluA1 model
with the four subunits colored individually. (B and C)
Cartoon diagram for the view from the top of ATD
(B) and close-up of the interface between subunits A
and B (C) showing the positions cysteine mutants
were introduced to cross-link the A and B subunits in
a tetramer assembly. (D) Western blot for GluA1 and
GluA2 ATD cross-links created by cysteine muta-
genesis designed in C. (E and F) Cartoon diagram for
the view from the top of LBD (E) and stereoview
(F) showing cysteine mutants designed to cross-link the
B and A′ subunits in a GluA1/A2 tetramer assembly. (G)
Western blot for GluA1 and GluA2 LBD cross-links
created by cysteine mutagenesis designed in F.
E5646 | www.pnas.org/cgi/doi/10.1073/pnas.1524358113 He et al.
3. Cys-436, -528, -589, and -815, were mutated to alanine residues.
The GluA2m had a reduced background, as expected (Fig. S2B).
These two mutants were functional with the same biophysical
properties as WT receptors. The I–V curves were strongly rec-
tified for GluA1m and linear for GluA1m/A2m (Fig. S2 C and
D). Therefore, all of the following experiments were based on
these mutated forms of GluA1 and GluA2.
The ATD of GluA1 model forms a dimer of dimers like that of
the GluA2 template (Fig. 1B). The ATDs of subunit A and B
(and so for A′ and B′) interact with a hydrophobic area, forming
the first level of dimer (Fig. 1 B and C). The Cα atoms of Leu-137
residues in subunit A and B are at the distance of ∼8.1 Å, op-
timal for spontaneous formation of a disulfide bond (Fig. 1C).
Introduction of a cysteine residue at this position led to the
formation of a dimer band at ∼250 kDa on the nonreducing
Western gel (Fig. 1D). Similarly, introduction of a cysteine at the
corresponding site in GluA2 (GluA2m_L137C) also showed a
dimer band (Fig. 1D). In the GluA1 model, residue Ala-148 in
subunit A is close to residue Asp-173 in subunit B at the distance
of 6.1 Å between two Cα atoms, whereas residue Ala-148 in
subunit B is close to residue Asp-173 in subunit A at the distance
of 5.5 Å (Fig. 1C). In addition, the distance between the two Ala-
148 residues and two Asp-173 residues in subunits A and B is too
far to form a disulfide bond. To examine whether GluA1 and
GluA2 could form heterodimers at the amino-terminal interface
of subunit A–B, we introduced these cysteine mutations in
GluA1 and GluA2. We found that GluA1m_A148C alone or
GluA1m_D173C alone only showed monomer bands, whereas
double mutations showed a dimer band (Fig. 1D). Similar results
were seen in GluA2m, where the disulfide band could be formed
between residues GluA2m_A148C and GluA2m_D177C (Fig.
1D). Additionally, a heterodimer could be detected both when
GluA1m_A148C were coexpressed with GluA2m_D177C and
when GluA1m_D173C coexpressed with GluA2m_A148C (Fig.
1D). Therefore, heterodimers could be formed in the ATDs of
GluA1/A2 receptors.
GluA1 and GluA2 Form Heterodimers in LBDs. To examine whether
heterodimers would also form in the LBD, in which subunit A
and B′ (A′ and B) would make pairs, we chose residues Leu-479
and -747 as candidates that could form a disulfide band in the
model (Fig. 1E). The Cα atom of residue Leu-479 in subunit A′ is
close to that of the Leu-747 residue in subunit B at the distance
of 5.6 Å, and the Cα atom of residue Leu-479 in subunit B is
close to that of the Leu-747 residue in subunit A′ at the distance
of 5.6 Å (Fig. 1F). However, the Leu-479 residues in A′ and B
are far from each other, and so are the Leu-747 residues. According
to our nonreducing Western analyses, the high-molecular-mass di-
mer band was only shown in GluA1m_L479C_L747C double mu-
tations, but not in the GluA1m_L479C or GluA1m_L747C single
mutant (Fig. 1G). The corresponding pair of L483C and L751C
in GluA2m showed a similar dimer band. In addition, coexpression
of GluA1m_L479C and GluA2m_L751C formed a heterodimer
band, as did coexpression of GluA1m_L747C and GluA2m_L483C
(Fig. 1G). Collectively, a heterodimer could be formed in the LBDs
of GluA1/A2 receptors.
GluA1 and GluA2 Have Preferred Positions in Tetrameric Assemblies.
Thus far, we have demonstrated heterodimer formation in the
ATD and LBD of GluA1/A2 receptors. However, how do the
heterodimers assemble into a tetramer? Does GluA1 (or GluA2)
prefer to localize to subunit A (A′) or B (B′)? We therefore
examined the interface between dimers. In between ATD dimers
of the GluA2 homotetramer, subunits B and B′ interact with
each other (around Val-209), whereas in between LBD dimers,
subunits A and A′ interact with each other (around Ile-664) (18).
We introduced cysteine residues at these interfaces of GluA1 and
GluA2 and found that the spontaneous cross-linking between
LBD dimers (A1m_I660C and A2m_I664C; Fig. 2 A–C and Fig.
S3 C and D) was much stronger and clearer than between ATD
dimers (A1m_G205C and A2m_V209C in Fig. S3 A and B).
Thus, further experiments with coexpression of GluA1 and
GluA2 were carried out with the mutations at the LBD interface.
We reasoned that, if GluA1 prefers to assemble into the A
(and A′) positions and GluA2 prefers the B (B′) positions, then
coexpression of GluA1m_I660C with GluA2m would still gen-
erate a GluA1 dimer band. Indeed, when GluA1m_I660C was
coexpressed with the same amount of or up to four times as much
GluA2m, high-molecular-mass bands corresponding to dimer size
were constantly detected on the nonreducing Western gel (Fig.
2B). Interestingly, increasing GluA2m amount in the expression
system only slightly, but not significantly, reduced the dimer band
strength (Fig. 2 B, Lower, shows the quantification), suggesting that
GluA1 sticks to position A and A′ in heteromeric GluA1/A2 re-
ceptors [the rectification indexes (RIs) indicating linear I–V curves;
Table S1]. We further analyzed coexpression of GluA2m_I664C
with GluA1m and found that the addition of GluA1 sharply re-
duced the GluA2 dimer band strength (Fig. 2C). The 1:1 ratio
coexpression reduced the dimer band strength to ∼30%. With a
1:2 and 1:4 ratio, the GluA2 dimer bands almost disappeared,
suggesting that GluA2 prefers to locate on position B (B′). A the-
oretical comparison between 1–2–1–2, 2–1–2–1 and random as-
sembly demonstrated that the 1–2–1–2 assembly model can best
fit our data for coexpression of GluA1 and GluA2 (Discussion).
Therefore, these data indicate that the heteromeric AMPARs have
a preferred 2:2 stoichiometry and assemble into a 1–2–1–2 con-
formation (Fig. 2I).
We noticed that the total GluA2m_I664C expression (dimer
plus monomer) appeared to decrease when coexpressed with
GluA1m with a nonreducing Western assay (Fig. 2C), which might
complicate the interpretation of our results. However, after dimers
disassembled by DTT, the expression levels of GluA2 were con-
stant (Fig. S3F), suggesting that the apparent expression change in
the absence of DTT was due to higher sensitivity of antibody to
dimers. The GluA1 antibody was also more sensitive to dimers,
and GluA1 expression was not affected by coexpression of GluA2
(Fig. S3E). Furthermore, the whole-lysed receptor proteins used
in our experiments contained the immature dimer or monomer
intermediate, which might interfere with our cross-linking bands.
We thus biotinylated and isolated the surface mature receptors
and analyzed their cross-linking patterns (Fig. S4). The results
were the same as whole-lysed receptors, suggesting that the im-
mature intermediates contribute little to the receptor pool under
our experimental conditions.
The spontaneous disulfide band formation between the A–A′
interface in LBD reduces the maximal channel opening in
AMPAR GluA2Q (18) and kainate receptor GluK2 (21). We
wondered whether this is the case for heteromeric AMPARs.
In the presence of the AMPAR desensitization blocker tri-
chloromethiazide (TCM), the glutamate-induced currents of
GluA1m_I660C were significantly enhanced by reducing reagent
DTT, whereas the currents of GluA1m were not (Fig. S5 A and B).
The GluA2 with arginine in the pore has little currents in HEK
cells; therefore, we made GluA2Qm by mutating the arginine res-
idue to glutamine. The glutamate-induced currents of GluA2Qm
were insensitive to DTT, whereas those of GluA2Qm_I664C were
significantly enhanced by DTT (Fig. S5 C and D), consistent with
the previous report (18). In addition, in the presence of trans-
membrane AMPAR regulatory proteins (TARPs), the GluA2R
could have significant currents (22). We found in the presence of
the prototypical TARP γ-2, the GluA2Rm_I664C currents
were significantly increased by DTT (Fig. S5 E and F). Then,
we tested the glutamate currents of heteromeric receptors.
GluA1m_I660C/GluA2m currents were significantly enhanced
by DTT, whereas GluA1m/GluA2m_I664C currents were in-
sensitive (Fig. 2 D–F). These data further supported the notion
He et al. PNAS | Published online September 6, 2016 | E5647
NEUROSCIENCEPNASPLUS
4. that, in the heteromeric GluA1/A2 receptor, the dimer of dimers
interface in LBDs is between GluA1 subunits.
TARP γ-2 Does Not Change the Heterotetrameric AMPAR Architecture.
AMPARs are modulated by auxiliary subunits in the brain, in-
cluding TARPs, cornichons, GSG1L, SynDIG1, CKAMP44, and
other proteins (23–28). Among them, TARPs are reported to
affect AMPAR synthesis, maturation, trafficking, and function
(29). To investigate whether TARPs participate in determining
the stoichiometry and assembly of heteromeric AMPARs, we
cotransfected TARP γ-2 with GluA1 and GluA2 mutants. In
the presence of γ-2, the GluA1m_I660C and GluA2m still
cross-linked to form dimer bands, whereas GluA2m_I664C and
GluA1m had diminished dimer bands (Fig. 2 G and H), similar
to the results without γ-2 (Fig. 2 B and C). It should be noted
that, without TARP γ-2, the GluA1m_I660C dimer bands
slightly decreased with the coexpression of GluA2m, whereas
they were more stable with γ-2 (quantification in Fig. 2B
compared with Fig. 2G), indicating that TARP γ-2 might en-
force the spatial assembly priority of heteromeric AMPARs
with 1–2–1–2 architecture.
The Amino-Terminal Sequences Determine the Spatial Priority of
Heteromeric AMPAR Assembly. According to previous reports,
ATDs could affect AMPAR assembly (11, 30–33). To determine
whether ATDs play a role in determining AMPAR spatial as-
sembly, we made chimeric construct of GluA1–2 by linking
GluA1 amino-terminal sequence (ATS; ATD plus SP) to the
LBD of GluA2m, and GluA2-1 by fusing the ATS of GluA2 to
the LBD of GluA1m. When GluA2-1_I660C was coexpressed
with GluA1-2, the GluA1 dimer bands were significantly di-
minished, whereas GluA1-2_I664C and GluA2-1 showed rela-
tively constant GluA2 dimer bands (Fig. 3 A and B), indicating
that the dimer of dimers interface in LBDs is now between
GluA2 subunits. Consistent with the Western data, DTT en-
hanced the glutamate currents of GluA1-2_I664C/GluA2-1, but
not that of GluA2-1_I660C/GluA1-2 (Fig. 3 E–G). The dimer
bands of GluA1_2-I664C were further stabilized by TARP γ-2
when coexpressed with GluA2-1 (Fig. 3 C and D).
To identify the specific domains in ATDs contributing to
AMPAR assembly, we switched only the ATD interface (AIF)
between two subunits to construct GluA1_AIF2 and GluA2_AIF1
(Fig. S6A). However, this interchange of AIFs resulted in an
unaffected assembly pattern with 1–2–1–2 architecture (Fig. S6 B
and C).
Collectively, swapping the ATSs of GluA1 and GluA2 altered
the spatial assembly of the downstream structure (Fig. 3H), but
the determining domain is not the AIFs in ATDs.
Switching SPs Reverses the Architecture of GluA1/A2. We then only
switched the SPs to construct SP2_GluA1 (GluA2 SP fused to
GluA1) and SP1_GluA2 (GluA1 SP fused to GluA2), re-
spectively. The dimer bands of SP2_GluA1_I660C were signifi-
cantly diminished with the coexpression of SP1_GluA2, whereas
Fig. 2. GluA1 and GluA2 have preferred positions in
tetrameric assemblies. (A) Stereoview showing cys-
teine mutants designed to cross A and A′ subunits in
a LBD tetramer assembly, with each subunit colored
the same as for the GluA1 tetramer shown in Fig. 1.
(B) The GluA1m_I660C mutation showed spontane-
ous disulfide-bond formation. Quantifications of ra-
tio between the dimer to the monomer band indicated
GluA1 in the A conformation. (C) Spontaneous cross-
link in GluA2m_I664C mutation was diminished by
coexpression with GluA1m. Quantifications of ratio
between the dimer to the mono band indicated
GluA2 in the B conformation. (D–F) The glutamate-
induced currents were enhanced by DTT in the
GluA1m_I660C/GluA2m channel (n = 8), but not in the
GluA1m/GluA2m_I664C channel (n = 8). Values are
means ± SEMs. **P < 0.01 (t test). (G and H) AMPAR
subunits TARP γ-2 did not change heterotetrameric
AMPAR assembly. (I) Model of heteromeric AMPARs
with a preferred 2:2 stoichiometry and assemble into
1–2–1–2 conformation.
E5648 | www.pnas.org/cgi/doi/10.1073/pnas.1524358113 He et al.
5. SP1_GluA2_I664C maintained relatively stable dimer bands with
the coexpression of SP2_GluA1 (Fig. 4 A and B). This pattern
was maintained in the presence of TARP γ-2 (Fig. 4 C and D).
DTT-enhancing experiments further demonstrated that the disul-
fide bond was now formed between GluA2 LBDs (Fig. 4 E and F).
Thus, swapping SPs changed the architecture of GluA1/A2 into
2–1–2–1 (Fig. 4 G and H). The SPs are not shown in our structure
models of AMPARs; we therefore checked the first amino acids in
our models where the SPs should link. The positions of the first
residues of GluA1s and GluA2s in the WT GluA1/A2 model (Fig.
4I) are clearly different. Briefly, the two GluA1_Asn5s, the first
amino acids of GluA1s at the A and A′ positions, are at the distance
of 125 Å, and the corresponding GluA2_Asn4s are at the distance
of 93 Å. In addition, the GluA1_Asn5s is ∼6 Å closer to the cell
membrane than GluA2_Asn4s in the model (Fig. 4I).
Generally, after guiding newly synthesized peptides to enter
the endoplasmic reticulum (ER) during translation, SPs are
cleaved off and are absent in mature proteins (34, 35). However,
CRF2(a)R, a subtype of corticotropin-releasing factor receptors,
contains a pseudo-SP that is not removed in the ER (36). To test
the fate of SPs in AMPARs, we inserted a FLAG epitope before
or after the SPs of GluA1 (Fig. 5A) and GluA2. When inserted
after GluA1 SP, the expression of FLAG could be detected
readily and colocalized with GluA1 (Fig. 5 B and C). Conversely,
when inserted before the SP, the expression of FLAG was barely
detectable, whereas the expression of GluA1 was normally de-
tected, indicating that FLAG was removed together with the SP.
Insertion of the FLAG epitope before and after GluA2 SP in-
dicated that the GluA2 SP was also excised in the ER (Fig. 5C).
The FLAG tag insertion around the SPs had some effects on
the AMPAR expression level (Fig. 5 D and E). FLAG insertion
after the SP excising site enhanced their protein level, whereas
insertion before the SP inhibited their expression. Swapping SPs
had little effect on protein expression level. In addition, GluA1
and GluA2 were undetectable on Western gels when SPs were
deleted, demonstrating that SPs are required for AMPAR ex-
pression. These data are consistent with the general concepts
of N-terminal SP for membrane proteins (34, 35). We also won-
dered whether Flag insertion affected the spatial assembly of
GluA1/A2. When the FLAG epitope was inserted after excising
the site of the SP, the dimer band pattern was the same as
GluA1/A2 (Fig. S7 A and B; compare with Fig. 2). When the
FLAG epitope was inserted before SP, the dimer band of both
GluA1 and GluA2 decreased with coexpression of the other
subunit (Fig. S7 C and D), suggesting that, under this situation,
the GluA1 and GluA2 might assemble in a random manner (see
theoretical models in Fig. S9).
The SP of GluA1 Determines the Architecture of Heteromeric
Receptors. To examine which SP, of GluA1 or of GluA2, is criti-
cal in determining the spatial assembly of GluA1/A2, we replaced
the SP of GluA1 [18 amino acids (aa)] and GluA2 (21 aa) with an
unrelated SP of GluK2 receptor (31 aa), respectively (Fig. 6A).
The dimer bands of SPK_GluA1m_I660C (SP of GluK2 replacing
that of GluA1) were greatly diminished when coexpressed with
GluA2m (Fig. 6B); the GluA2_I664C dimer bands were also
greatly reduced when coexpressed with SPK_GluA1m (Fig. 6C).
The linear I–V curve of SPK_GluA1m/GluA2 indicated that the
heteromeric receptors were still preferentially formed (Fig. 6D).
Indeed, the I–V curve was still linear, even when both GluA1 and
GluA2 SPs were replaced with that of GluK2 (Fig. 6E). Therefore,
when SP of the GluA1 subunit was replaced with an unrelated
one, the heteromeric receptor lost spatial priority.
In contrast, when the GluA2 SP was replaced with the GluK2
SP, the dimer bands of GluA1_I660C were relatively stable when
coexpressed with SPK_GluA2m, whereas the dimer bands of
Fig. 3. ATSs determine the spatial priority of heteromeric AMPAR assembly. (A) The dimer bands of GluA2-1_I660C were greatly reduced when coexpressed
with GluA1-2. (B) GluA1-2_I664C showed constant GluA2 dimer band with GluA2-1. (C and D) GluA2-1 and GluA1-2 have the same preferred positions in
tetramer as shown in A and B, with coexpression of AMPAR subunits TARP γ-2. (E–G) The glutamate-induced currents were significantly enhanced by DTT only
in the GluA2-1/GluA1-2_I664C channel (n = 7). Values are means ± SEMs. ***P < 0.001 (t test). (H) Molecular surface view showing that swapping the ATSs of
GluA1 and GluA2 alters the spatial assembly.
He et al. PNAS | Published online September 6, 2016 | E5649
NEUROSCIENCEPNASPLUS
6. SPK_GluA2_I664C were greatly decreased with the coexpression
of GluA1m (Fig. 6 F and G), indicating an unaffected 1–2–1–2
architecture. Conversely, when the GluA1 SP was replaced with
SPK and the GluA2 SP was replaced with GluA1 SP, the het-
eromeric receptor displayed a preferred 2–1–2–1 architecture (Fig.
6 H and I). Furthermore, when both the GluA1 and GluA2 were
guided by the SP of GluK2 (Fig. S8 A and B) or GluA1 (Fig. S8 C
and D), neither GluA1 nor GluA2 dimer bands were stable,
whereas their I–V curves were linear (Table S1).
Together, these findings show that the SP of GluA1 alone is
essential for guiding the spatial assembly priority of GluA1/A2
heteromeric AMPAR.
The ATDs Are Critical for the Heteromerization of GluA1/A2. Previous
studies have shown that AMPARs in the absence of ATDs retain
channel activity (37, 38). To explore the stoichiometry and as-
sembly of GluA1/A2 with the truncation of ATDs, we generated
a GluA1ΔN mutant by removing the sequence between Asn-5–
Ala-379 and the GluA2ΔN mutant by deleting Asn-4–Leu-381.
The glutamate currents of GluA1ΔN in the presence of TCM
were strongly rectified (Fig. 7A). However, when GluA1ΔN and
GluA2ΔN was coexpressed in a 1:1 ratio, the glutamate currents
were partially rectified (Fig. 7B), suggesting that both homo-
meric GluA1 receptors and heteromeric GluA1/A2 receptors
were formed. Although GluA2ΔN was increased to four times
of GluA1ΔN, the I–V curve was rather linear, like that of
GluA1/A2 (Fig. 7 C and D and Fig. S2D). Therefore, the GluA1
and GluA2 without ATDs lose the priority to heteromerize.
Discussion
Guided by the crystal structure of homomeric GluA2 receptor,
we performed cysteine cross-linking experiments to study the stoi-
chiometry and assembly of GluA1/A2 receptors. The GluA1/A2
receptor forms heterodimers in both ATDs and LBDs, which then
assemble into heterotetramers, consistent with the dimer-of-dimers
theory (5, 33). The spatial assembly of the heterotetramers is
consistent with the diagonal spatial arrangement in an early study
(5). In addition, we demonstrate that the receptor prefers to as-
semble as a 1–2–1–2 architecture (Fig. 2I), which is mainly de-
termined by the amino-terminal excisable SP of GluA1.
According to the dimer-of-dimers theory, the process of
AMPAR assembly could be at least divided into two steps: The
subunit peptides first assemble to form dimers, which further
dimerize to form tetramers in the second step (5, 33). Our data
demonstrate that the heterodimers is preferred in the first step of
the assembly. This preference appears to be an intrinsic property
of GluA1 and GluA2 sequences because changing SPs do not
affect the linear I–V curves. Previous studies demonstrated that
heterodimers could be formed both in isolated ATDs of GluA2
and GluA3 (39, 40) and in kainate receptors (20, 41). The ve-
locity sedimentation study of isolated ATDs shows that the
heterodimer of GluA1/A2 ATDs has the smallest dissociation
constant (Kd); thus, the heterodimers are preferred (31). In our
study, ATDs form heterodimers in the full-length GluA1/A2.
GluA1 and GluA2 without ATD losing the heteromerization
Fig. 4. SPs determine the heteromeric AMPAR as-
sembly. (A and B) The dimer bands of SP2_A1m_660C
were greatly reduced when coexpressed with
SP1_GluA2m, whereas SP1_A2m_664C showed a
constant GluA2 dimer band with SP2_GluA1m.
(C and D) SP2_GluA1 and SP1_GluA2 have the same
preferred positions in the tetramer as shown in A
and B, with coexpression of TARP γ-2. (E and F) The
glutamate-induced currents were significantly en-
hanced by DTT only in the SP2_A1m/SP1_A2m_664C
channel (n = 10). Values are means ± SEMs. *P < 0.05
(t test). (G) Side view of GluA1/A2 with 2–1–2–1 as-
sembly. (H) Top view of GluA1/A2 in 1–2–1–2 archi-
tecture (Upper) and SP swapped GluA1/A2 in 2–1–2–
1 architecture (Lower). The first amino acids of
GluA1 and GluA2 are highlighted. The residues in
red link with GluA1 SP. The residues in green link
with GluA2 SP. (I) Close-up of the first residues of WT
GluA1/A2 model in 1–2–1–2 architecture. Lower de-
picts space relationships among the four Cα atoms
of GluA1_Asn5s and GluA2_Asn4s. The distance be-
tween GluA1_Asn5s is ∼125 Å. The distance between
GluA2_Asn4s is ∼93 Å. The line that links GluA1_Asn5s
is perpendicular to the symmetric axis, and so is that
linking GluA2_Asn4s. The GluA1_Asn5 line is ∼6 Å
proximal to membrane relative to GluA2_Asn4 line.
E5650 | www.pnas.org/cgi/doi/10.1073/pnas.1524358113 He et al.
7. priority, supporting the notion that the ATDs are critical for the
first step of heterodimerization (11, 31, 33).
In our study, LBDs also form heterodimers in the full-length
GluA1/A2. However, in ATD-truncated GluA1ΔN/GluA2ΔN
(Fig. 7), the I–V curves suggest that heteromeric receptors are
not preferred. Therefore, the LBD dimerization should be sec-
ondary to ATD dimerization. It has been proposed that, during
the first level of dimerization, not only the ATDs, but also the
LBDs dimerize between the same pair of subunits (42). However,
the LBD dimers have to be loose enough to disperse and reas-
semble into switched dimerization partners during the second
step of dimerization (42).
The second step of assembly, the dimerization of dimers, de-
termines the spatial arrangement of heteromeric GluA1/A2 re-
ceptors. The small interface between LBD dimers is suitable for
understanding the spatial arrangement of heterotetrameric AMPARs.
Introducing cysteine residues at the interface (GluA1m_I660C and
GluA2m_I664C) results in clear and strong cross-linking bands
in homemeric receptors. Because only receptors with both A-type
subunits carrying cysteine residues are able to cross-link, the
location information of Cys-tagged subunits can be deduced by
analyzing the cross-linking patterns. Clearly the subunits that
preferred to locate at A-type positions would have constantly
high cross-linking bands, and the subunits that preferred to lo-
cate at B-type positions would have diminished dimer bands in
coexpression experiments. If the subunits are assembled in a
random manner, the cross-linking bands of both subunits would
decrease. Thus, three simple models (1–2–1–2, 2–1–2–1, and
random) are proposed, and their cross-linking dimer patterns are
predicted (Fig. S9A). Indeed, we found that these three types of
patterns can all happen by manipulating the amino-terminal SPs.
GluA1 coexpression with GluA2 either guided by SP2 or SPK
has a 1–2–1–2 type of cross-linking pattern. SP1_GluA2 coex-
pression with GluA1 guided by SP2 or SPK has a 2–1–2–1 type of
cross-linking pattern. In the other five conditions, when both
subunits are guided by identical SPs or without the SP of GluA1,
the receptors are likely assembled in a random model. For these
five conditions, because these receptor subunits have intact
Fig. 5. SPs were cleaved off after AMPAR translation. (A) Schematic representation of the constructs. The FLAG tag (green box) was inserted either behind
the amino-terminal SP (black box) or behind the starting methionine residue. (B) Representative immunofluorescence staining for GluA1 (red) and GluA2 (red)
in transfected HEK 293T cells with a GluA1m or GluA2m construct, respectively. Nuclei were stained with Hoechst 33258 (blue). (C) Representative immu-
nofluorescence staining for GluA1 (red) and FLAG (green) in transfected HEK 293T cells with GluA1m SP-FLAG or GluA1m FLAG-SP construct designed in A,
respectively. Nuclei were stained with Hoechst 33258 (blue). (D and E) Relative expression level of GluA1 (D) and GluA2 (E) when manipulations were carried
out around SP.
He et al. PNAS | Published online September 6, 2016 | E5651
NEUROSCIENCEPNASPLUS
8. ATDs, they would have preferred to assemble into heterodimers
at the first assembly step, as discussed. Then, they might further
dimerize in a random manner so that the cross-linking bands are
both decreased. The theoretical prediction of cross-linking pat-
terns for this preferred heterodimer-random model is only
slightly different from the complete random model, and our
experimental data could not distinguish them from each other. A
close comparison of the cross-linking pattern of GluA1/A2 with
the 1–2–1–2 model showed that they are not strictly matched.
The 1–2–1–2 model predicts that the dimers are constantly high
when GluA1m_I660C is coexpressed with one to four times the
GluA2m, yet a slight decrease of dimer bands was observed.
The model also predicts that there are zero dimers when
GluA2m_I664C is coexpressed with one to four times the GluA1m,
yet small amounts of dimer bands have been observed. These ob-
servations suggest that GluA1/GluA2 stoichiometry might vary, so
that 3:1 or 1:3 stoichiometry could form under certain conditions
(14), although the 2:2 stoichiometry with the 1–2–1–2 architecture
is highly preferred.
The elements controlling the second step of assembly, the
dimerization of dimers, was previously unclear. A few sites—
including the Lurcher site (alanine to threonine mutation) (11,
33), the R–Q RNA editing site (43), the flop-flip domains (44),
and transmembrane domains (45)—have been suggested to af-
fect the tetramerization step of the assembly, probably by changing
the velocity of the second dimerization. Here, we clearly demon-
strated that the GluA1 SP plays a critical role in determining the
spatial arrangement of heteromeric receptor tetramerization.
These results are rather surprising, because the SPs are generally
cleaved off and degraded (34, 35) after guiding the newly syn-
thesized peptides to enter the ER. Very few SPs are retained and
have been implicated in protein function such as that of the se-
cretory protein HRP (46). The maintained pseudo-SP of the
membrane protein CRF2(a)R affects the receptor oligomerization
(36, 47). In this study, SPs of GluA1 and GluA2 were cleaved off
from the mature receptors (Fig. 5), suggesting that they belong to
the traditional amino-terminal SPs. That a cleavable SP plays a
role in late assembly of protein ternary structures, to our knowl-
edge, has not been reported before, thus probably implying a
novel function of SPs. Our finding also raises questions about
when the SPs are excised. For GluA1/GluA2 receptors, a simple
model would be that the SPs (at least the GluA1 SP) are cleaved
off after the heterotetramer formation in the ER because the SPs
have clearly cis effects on the spatial assembly. Alternatively, al-
though less likely, the SPs are excised earlier, but have passed the
spatial code to downstream signal molecules.
The SPs are not conserved, even between family proteins like
AMPAR subunits. However, the SPs are conserved among spe-
cies, including frog, turtle, chicken, and mammals, in either GluA1
or GluA2 (Fig. S10). This homogeneity of SPs among species
Fig. 6. GluA1 SP determines the heteromeric AMPAR
assembly. (A) Sequences of SPs from GluA1, GluA2, and
GluK2 receptors. (B) The dimer band of SPK_A1m_660C
was greatly diminished when coexpressed with GluA2m.
(C) The dimer band GluA2m_664C was greatly reduced
when coexpressed with SPK_A1m. (D and E) The I–V
curve of SPK_GluA1m/GluA2 (D) (n = 16) and
SPK_GluA1m/SPK_GluA2 (E) (n = 20). (F and G) The
dimer bands of GluA1m_660C were relatively stable
when coexpressed with SPK_GluA2m (F), whereas
the dimer bands of SPK_GluA2m_664C were greatly
decreased with GluA1m (G). (H and I) The dimer
bands of SPK_GluA1m_660C were greatly decreased
when coexpressed with SP1_GluA2m (H), whereas
the dimer bands of SP1_GluA2m_664C were rela-
tively stable with SPK_GluA1m (I). (J) SP changed the
architecture of GluA1/A2 (top view). The first amino
acids were colored. The residues that link to GluA1,
GluA2, and GluK2 SP are labeled in red, green, and
yellow, respectively.
E5652 | www.pnas.org/cgi/doi/10.1073/pnas.1524358113 He et al.
9. indicates that the AMPAR spatial assembly is evolutionally
conserved.
Native AMPARs are modulated by auxiliary subunits in the
brain. We and others have previously shown that one to four
TARPs bind to each AMPAR (11, 15). By tethering TARP γ-2
or -8 with GluA1 and GluA2, we have determined that kainite- vs.
glutamate-induced currents (KA/Glu ratio) are determined by the
number of TARPs that are linked (15). Furthermore, coexpression
of TARP-tethered GluA1 (or GluA2) with untethered GluA2 (or
GluA1) showed an intermediate KA/Glu ratio, which can be best
explained with two TARPs in each receptor. Regardless of the
effects of TARPs on AMPAR assembly, the observation also
suggests that GluA1/A2 form tetramers with 2:2 stoichiometry.
Our data here show that TARP γ-2 does not alter the spatial
assembly priority of heteromeric AMPARs, but, rather, enforces
it. Assuming that almost all native AMPARs in neurons contain
TARPs, the GluA1/A2 heteromeric AMPARs in the brain might
have fixed stoichiometry and architecture.
In conclusion, our results suggest that GluA1/A2, the most
abundant AMPARs in the brain, prefer to assemble into heter-
otetramers in a 1–2–1–2 fashion. This spatial assembly is de-
termined by the SP of GluA1.
Methods
Protein Modeling. Protein sequences corresponding to rat GluA1 and GluA2
were downloaded from the UniProt database. These sequences were sub-
sequently aligned to the sequence of the crystal structure (PDB ID 3KG2) by
using BLAST. GluA1 and GluA2 sequences were, respectively, 71% and 97%
identical to the 3KG2 sequence. We used the protein homology modeling
program Protein Local Optimization Program (now commercially available as
PRIME; Schrodinger, Inc.) to build the models (48). We modeled each protein
chain separately and merged them together to construct the heterotetramer
GluA1/A2 models. The models were depicted by using the PyMOL program.
Molecular Biology. The full-length rat GluA2 (flip) and TARP γ-2 subunits were
subcloned into the pIRES2-GFP vector, and rat GluA1 (flip) were in pIRES2-
mCherry vector for expression in HEK 293T cells (15). Single or multiple
cysteine substitutions and the Q/R editing site were generated by using
overlapping PCR (Vazyme Biotech, P505). To make constructs of GluA1 and
GluA2 amino-terminal chimeras, the amino termini of GluA1 (397 residues
including SP) and GluA2 (402 residues including SP) were exchanged by
overlapping PCR. To make constructs of GluA1 and GluA2 SP chimeras, the
SPs of GluA1 (18 residues), GluA2 (21 residues), and rat GluK2 were ex-
changed by overlapping PCR. Constructs with mutant codons were con-
firmed by sequencing over the entire length of the coding region.
Western Blots for Cysteine Cross-Linking. For AMPAR cross-linking experi-
ments, HEK 293T cells were transiently transfected by using Lipofectamine
2000 reagent (Invitrogen) following the manufacturer’s instructions. After
4 h, DNA–Lipofectamine 2000 complexes were removed by changing culture
medium containing 100 μM 6-nitro-7-sulfamoylbenzo[f]quinoxaline-2,3-dione
(Abcam). After 2 d, cells were either performed recording or lysed in radi-
oimmunoprecipitation assay buffer containing 150 mM NaCl, 50 mM Tris
(pH 7.4), 1% Nonidet P-40, 0.5% sodium deoxycholate, and complete Pro-
tease Inhibitor Mixture Tablets (Roche). Lysis was performed on ice for 30 min,
and cell lysates were centrifuged for 30 min at 17,000 × g in a top bench
centrifuge at 4 °C. After centrifugation, the supernatant was mixed with 4×
loading buffer and immediately loaded into 6% SDS/PAGE gels in the absence
(nonreducing condition) or presence of DTT. Protein bands were transferred
to PVDF membranes (EMD Millipore) at 75 V for 3 h. The membranes were
blocked for 1 h at room temperature in 150 mM NaCl, 10 mM Tris·HCl, pH
7.6, and 0.1% Tween 20 containing 5% nonfat milk and then probed with
anti-GluA1 antibody (Abcam, catalog no. ab31232), anti-GluA2/3 antibody
(Millipore, AB1506), or anti-Stargazin antibody (EMD Millipore, catalog no.
AB9876). The protein detection was performed by using the ECL substrate
(Thermo Fisher Scientific Life Sciences) before exposure.
Membrane Protein Extraction. Cells were washed three times with ice-cold PBS
before adding 1 mM solution of Sulfo-NHS-LC-Biotin (Thermo Fisher Scientific
Life Sciences, catalog no. 21335) in PBS for biotinylating cell surface pro-
teins. The cells were incubated by reacting on ice for 30 min. Reactions were
quenched with 50 mM glycine, followed by rinsing three times with ice-cold
Tris-buffered saline. Cells were then lysed by sonicating in 0.5% Triton X-100
containing lysis buffer (with protease inhibitors) on ice. After centrifuging
cell lysate at 13,800 × g for 10 min at 4 °C, clarified supernatants were
transferred to monomeric avidin agarose (Thermo Fisher Scientific Life Sci-
ences, catalog no. 20228). Incubation for 1 h at room temperature was per-
formed, with end-over-end mixing for coupling biotinylated proteins to
monomeric avidin agarose. The agarose was washed three times with PBS.
Finally, the bound membrane proteins were eluted by incubating with non-
reducing SDS/PAGE sample buffer containing 50 mM biotin at 70 °C for 10 min.
Fig. 7. The ATDs are critical for the heteromerization of GluA1/A2. (A) The glutamate current of GluA1mΔN was strongly rectified (n = 6). (B) The glu-
tamate current of GluA1mΔN/GluA2mΔN (1:1) was partially rectified (n = 6). (C) I–V curve of GluA1mΔN/GluA2mΔN (1:4) was rather linear (n = 12).
(D) Quantifications of RIs in A–C.
He et al. PNAS | Published online September 6, 2016 | E5653
NEUROSCIENCEPNASPLUS
10. Electrophysiology. Agonist-evoked currents were recorded from transfected
HEK 293T cells, as described (49). Patch-clamp recordings were performed 24–
48 h after transfection in room temperature. The transfected HEK 293T cells
were bathed in the extracellular solution containing the following (in mM):
NaCl 150, KCl 2.8, MgCl2 0.5, CaCl2 2, and Hepes 10 (pH 7.4). Whole-cell
patches were recorded from positively transfected cells identified by epi-
fluorescence microscopy with glass pipettes (3–6 MΩ) filled with solution
containing (in mM): CsF 110, CsCl 30, NaCl 4, CaCl2 0.5, EGTA 10, Hepes 10,
and spermine 0.1 (pH 7.3) with CsOH. A concentration of 1 mM glutamate
(and/or 10 mM DTT) was applied to patches in extracellular solution con-
taining 0.5 mM TCM to prevent desensitization, at pH 7.4. All cells were
voltage-clamped at −60 mV, and the current data were collected with an
Axoclamp 700B amplifier and Digidata 1440A (Molecular Devices), filtered
at 2 kHz, and digitized at 10 kHz. The patch data are analyzed by using
Clampfit software.
Statistical Analysis. The ratio of dimers was quantified by using the image
quantification software ImageJ. Data are expressed as mean ± SEM of at least
three independent experiments. Statistical analyses were carried out by us-
ing GraphPad Prism software (Version 6). Specific tests used were multiple
comparisons in one-way ANOVA and t test. All P values <0.05 were consid-
ered statistically significant.
ACKNOWLEDGMENTS. This work was initiated during the postdoctoral
training of Y.S.S. in Prof. Roger A. Nicoll’s laboratory at the University of
California, San Francisco. We thank Prof. Nicoll for his generosity and thought-
ful comments on the manuscript. This work is supported by National Basic
Research Program of China Grants 2014CB942804 and 2015BAI08B00; Na-
tional Science Foundation of China Grants 31371061, 31571060, 31500830,
and 31200808; and Natural Science Foundation of Jiangsu Province Grant
BK20140018.
1. Traynelis SF, et al. (2010) Glutamate receptor ion channels: Structure, regulation, and
function. Pharmacol Rev 62(3):405–496.
2. Sommer B, Köhler M, Sprengel R, Seeburg PH (1991) RNA editing in brain controls a
determinant of ion flow in glutamate-gated channels. Cell 67(1):11–19.
3. Cull-Candy S, Kelly L, Farrant M (2006) Regulation of Ca2+-permeable AMPA recep-
tors: Synaptic plasticity and beyond. Curr Opin Neurobiol 16(3):288–297.
4. Jia Z, et al. (1996) Enhanced LTP in mice deficient in the AMPA receptor GluR2.
Neuron 17(5):945–956.
5. Mansour M, Nagarajan N, Nehring RB, Clements JD, Rosenmund C (2001) Heteromeric
AMPA receptors assemble with a preferred subunit stoichiometry and spatial ar-
rangement. Neuron 32(5):841–853.
6. Burnashev N, et al. (1992) Calcium-permeable AMPA-kainate receptors in fusiform
cerebellar glial cells. Science 256(5063):1566–1570.
7. Verdoorn TA, Burnashev N, Monyer H, Seeburg PH, Sakmann B (1991) Structural
determinants of ion flow through recombinant glutamate receptor channels. Science
252(5013):1715–1718.
8. Hollmann M, Hartley M, Heinemann S (1991) Ca2+ permeability of KA-AMPA–gated
glutamate receptor channels depends on subunit composition. Science 252(5007):
851–853.
9. Lu W, et al. (2009) Subunit composition of synaptic AMPA receptors revealed by a
single-cell genetic approach. Neuron 62(2):254–268.
10. Wenthold RJ, Petralia RS, Blahos J II, Niedzielski AS (1996) Evidence for multiple
AMPA receptor complexes in hippocampal CA1/CA2 neurons. J Neurosci 16(6):
1982–1989.
11. Kim KS, Yan D, Tomita S (2010) Assembly and stoichiometry of the AMPA receptor
and transmembrane AMPA receptor regulatory protein complex. J Neurosci 30(3):
1064–1072.
12. Rosenmund C, Stern-Bach Y, Stevens CF (1998) The tetrameric structure of a gluta-
mate receptor channel. Science 280(5369):1596–1599.
13. Mano I, Teichberg VI (1998) A tetrameric subunit stoichiometry for a glutamate re-
ceptor-channel complex. Neuroreport 9(2):327–331.
14. Washburn MS, Numberger M, Zhang S, Dingledine R (1997) Differential dependence
on GluR2 expression of three characteristic features of AMPA receptors. J Neurosci
17(24):9393–9406.
15. Shi Y, Lu W, Milstein AD, Nicoll RA (2009) The stoichiometry of AMPA receptors and
TARPs varies by neuronal cell type. Neuron 62(5):633–640.
16. Dürr KL, et al. (2014) Structure and dynamics of AMPA receptor GluA2 in resting, pre-
open, and desensitized states. Cell 158(4):778–792.
17. Chen L, Dürr KL, Gouaux E (2014) X-ray structures of AMPA receptor-cone snail toxin
complexes illuminate activation mechanism. Science 345(6200):1021–1026.
18. Sobolevsky AI, Rosconi MP, Gouaux E (2009) X-ray structure, symmetry and mecha-
nism of an AMPA-subtype glutamate receptor. Nature 462(7274):745–756.
19. Lee CH, et al. (2014) NMDA receptor structures reveal subunit arrangement and pore
architecture. Nature 511(7508):191–197.
20. Kumar J, Schuck P, Mayer ML (2011) Structure and assembly mechanism for hetero-
meric kainate receptors. Neuron 71(2):319–331.
21. Das U, Kumar J, Mayer ML, Plested AJ (2010) Domain organization and function in
GluK2 subtype kainate receptors. Proc Natl Acad Sci USA 107(18):8463–8468.
22. Kott S, Werner M, Körber C, Hollmann M (2007) Electrophysiological properties of
AMPA receptors are differentially modulated depending on the associated member
of the TARP family. J Neurosci 27(14):3780–3789.
23. Schwenk J, et al. (2009) Functional proteomics identify cornichon proteins as auxiliary
subunits of AMPA receptors. Science 323(5919):1313–1319.
24. Shanks NF, et al. (2012) Differences in AMPA and kainate receptor interactomes fa-
cilitate identification of AMPA receptor auxiliary subunit GSG1L. Cell Reports 1(6):
590–598.
25. Schwenk J, et al. (2012) High-resolution proteomics unravel architecture and molec-
ular diversity of native AMPA receptor complexes. Neuron 74(4):621–633.
26. von Engelhardt J, et al. (2010) CKAMP44: a brain-specific protein attenuating short-
term synaptic plasticity in the dentate gyrus. Science 327(5972):1518–1522.
27. Kalashnikova E, et al. (2010) SynDIG1: An activity-regulated, AMPA- receptor-inter-
acting transmembrane protein that regulates excitatory synapse development.
Neuron 65(1):80–93.
28. Tomita S, et al. (2003) Functional studies and distribution define a family of trans-
membrane AMPA receptor regulatory proteins. J Cell Biol 161(4):805–816.
29. Jackson AC, Nicoll RA (2011) The expanding social network of ionotropic glutamate
receptors: TARPs and other transmembrane auxiliary subunits. Neuron 70(2):178–199.
30. Leuschner WD, Hoch W (1999) Subtype-specific assembly of alpha-amino-3-hydroxy-5-
methyl-4-isoxazole propionic acid receptor subunits is mediated by their N-terminal
domains. J Biol Chem 274(24):16907–16916.
31. Rossmann M, et al. (2011) Subunit-selective N-terminal domain associations organize
the formation of AMPA receptor heteromers. EMBO J 30(5):959–971.
32. Ayalon G, Segev E, Elgavish S, Stern-Bach Y (2005) Two regions in the N-terminal
domain of ionotropic glutamate receptor 3 form the subunit oligomerization inter-
faces that control subtype-specific receptor assembly. J Biol Chem 280(15):
15053–15060.
33. Ayalon G, Stern-Bach Y (2001) Functional assembly of AMPA and kainate receptors is
mediated by several discrete protein-protein interactions. Neuron 31(1):103–113.
34. Rutz C, Klein W, Schülein R (2015) N-terminal signal peptides of G protein-coupled
receptors: Significance for receptor biosynthesis, trafficking, and signal transduction.
Prog Mol Biol Transl Sci 132:267–287.
35. Hegde RS, Bernstein HD (2006) The surprising complexity of signal sequences. Trends
Biochem Sci 31(10):563–571.
36. Rutz C, et al. (2006) The corticotropin-releasing factor receptor type 2a contains an
N-terminal pseudo signal peptide. J Biol Chem 281(34):24910–24921.
37. Tomita S, Shenoy A, Fukata Y, Nicoll RA, Bredt DS (2007) Stargazin interacts func-
tionally with the AMPA receptor glutamate-binding module. Neuropharmacology
52(1):87–91.
38. Pasternack A, et al. (2002) Alpha-amino-3-hydroxy-5-methyl-4-isoxazolepropionic acid
(AMPA) receptor channels lacking the N-terminal domain. J Biol Chem 277(51):
49662–49667.
39. Jin R, et al. (2009) Crystal structure and association behaviour of the GluR2 amino-
terminal domain. EMBO J 28(12):1812–1823.
40. Sukumaran M, et al. (2011) Dynamics and allosteric potential of the AMPA receptor
N-terminal domain. EMBO J 30(5):972–982.
41. Kumar J, Schuck P, Jin R, Mayer ML (2009) The N-terminal domain of GluR6-subtype
glutamate receptor ion channels. Nat Struct Mol Biol 16(6):631–638.
42. Gan Q, Salussolia CL, Wollmuth LP (2015) Assembly of AMPA receptors: Mechanisms
and regulation. J Physiol 593(1):39–48.
43. Greger IH, Khatri L, Kong X, Ziff EB (2003) AMPA receptor tetramerization is medi-
ated by Q/R editing. Neuron 40(4):763–774.
44. Penn AC, Balik A, Wozny C, Cais O, Greger IH (2012) Activity-mediated AMPA receptor
remodeling, driven by alternative splicing in the ligand-binding domain. Neuron
76(3):503–510.
45. Gan Q, Dai J, Zhou HX, Wollmuth LP (2016) The transmembrane domain mediates
tetramerization of α-amino-3-hydroxy-5-methyl-4-isoxazolepropionic acid (AMPA)
receptors. J Biol Chem 291(12):6595–6606.
46. Harrington JM, et al. (2014) A retained secretory signal peptide mediates high density
lipoprotein (HDL) assembly and function of haptoglobin-related protein. J Biol Chem
289(36):24811–24820.
47. Teichmann A, et al. (2012) The pseudo signal peptide of the corticotropin-releasing
factor receptor type 2A prevents receptor oligomerization. J Biol Chem 287(32):
27265–27274.
48. Jacobson MP, Friesner RA, Xiang Z, Honig B (2002) On the role of the crystal envi-
ronment in determining protein side-chain conformations. J Mol Biol 320(3):597–608.
49. Herring BE, et al. (2013) Cornichon proteins determine the subunit composition of
synaptic AMPA receptors. Neuron 77(6):1083–1096.
E5654 | www.pnas.org/cgi/doi/10.1073/pnas.1524358113 He et al.
11. Supporting Information
He et al. 10.1073/pnas.1524358113
Fig. S1. Possible spatial assemblies of heteromeric GluA1/A2 receptors. The models are colored based on the crystal structure of GluA2 homomers (PDB ID
3KG2). The subunits colored in red represent the spatial positions of GluA1. The subunits in cyan represent GluA2s. (A) Surface view from the top (Upper) and
the side (Lower) of GluA1/A2 showing heteromeric architectural models in 1:3 stoichiometry. The top numbers are the spatial coding of the subunits in
clockwise direction starting from the upper right, where 1 represents GluA1 and 2 represents GluA2. (B) The top and side views of GluA1/A2 showing het-
eromeric architectural models in 3:1 stoichiometry. (C) The top and side views of GluA1/A2 showing heteromeric architectural models in 2:2 stoichiometry.
He et al. www.pnas.org/cgi/content/short/1524358113 1 of 12
12. A GluA1 GluA1m GluA2 GluA2m
Dimer
Monomer
Dimer
Monomer
GluA1 GluA2
C
GluA1m/GluA2m
-100 -50 0 50 100
-2000
-1000
0
1000
2000
RI = 0.71 ± 0.04
Voltage (mV)
Currents(pA)
GluA1m
-100 -50 0 50 100
-1000
-500
0
500
1000
RI = 0.15 ± 0.04
Voltage (mV)
Currents(pA)
B
D
250
95
kD
130
250
95
kD
130
Fig. S2. GluA1m and GluA2m formed functional heteromeric GluA1/A2 receptors. (A) Nonreducing Western blot for WT GluA1 and mutated GluA1 (GluA1m,
Cys-524, -585, -811, -825, and -875 were mutated to nonreducing alanines). Note spontaneous oligomerizations formed only in WT GluA1. (B) Nonreducing
Western blot for WT GluA2 and mutated GluA2 (GluA2m, Cys-436, -528, -589, and -815 were mutated to alanine residues). Note that spontaneous oligo-
merizations formed only in WT GluA2. (C) The glutamate-induced currents of GluA1m in HEK cells was strongly rectified (RI = 0.15 ± 0.04; n = 6). (D) I–V curve
of GluA1m/GluA2m (1:1) was linear (RI = 0.71 ± 0.04; n = 17).
He et al. www.pnas.org/cgi/content/short/1524358113 2 of 12
13. Fig. S3. Expression levels of GluA1 and GluA2 were not changed in coexpression. (A and B) Weak cross-linking bands were detected in nonreducing Western
gel when cysteine residue was introduced at the interface between the ATD dimers of GluA1 (G205C) and GluA2 (V209C). GluA1m_L137C and GluA2m_L137C
were control. (C and D) Strong and clear cross-linking bands were seen when cysteine residue was introduced at the interface between the LBD dimers of GluA1
(I660C) and GluA2 (I664C). All dimer bands disappeared in the presence of DTT. (E) GluA1m_I660C coexpressed with one to four times of GluA2m. (Left) In the
absence of DTT, the dimer band density was stronger than monomer and was consistently high with the coexpression of GluA2m. (Right) The bands of GluA1 in
the presence of DTT were not changed by the coexpression of GluA2m. (F) GluA2m_I664C coexpressed with one to four times of GluA1m. (Left) In the absence
of DTT, the dimer band density was stronger than monomer and was significantly decreased with the coexpression of GluA1m. (Right) The bands of GluA2 in
the presence of DTT were not changed by the coexpression of GluA1m.
He et al. www.pnas.org/cgi/content/short/1524358113 3 of 12
14. Fig. S4. The cross-linking patterns of surface GluA1/A2. (A and B) Intracellular protein GAPDH and ER protein BIP were not with purified surface GluA1 and
GluA2 (M), but with the input control. (C) The dimer band of surface GluA1m_I664C was not changed by the coexpression of one to four times GluA2m (n = 5).
(D) The dimer band of surface GluA2m_I664C was significantly diminished with the coexpression of one to four times GluA1m (n = 5).
He et al. www.pnas.org/cgi/content/short/1524358113 4 of 12
15. Fig. S5. The glutamate-induced currents of both GluA1m_I660C and GluA2m_I664C were sensitive to DTT. (A and B) The glutamate-induced currents were
significantly enhanced by reducing agent (10 mM DTT) in the GluA1m_I660C channel (n = 13), whereas the currents of GluA1m were not (n = 7). Values are
means ± SEMs. ** P < 0.01 (t test). (C and D) The glutamate-induced currents were significantly enhanced by DTT in the GluA2Qm_I664C channel (n = 9),
whereas the currents of GluA2Qm were not (n = 10). Values are means ± SEMs. *** P < 0.001 (t test). (E and F) With TARP γ-2, the GluA2Rm_I664C currents
were significantly enhanced by DTT (n = 4), whereas the GluA2Rm currents were not (n = 5). Values are means ± SEMs; ** P < 0.01 (t test).
He et al. www.pnas.org/cgi/content/short/1524358113 5 of 12
16. Fig. S6. Swapping of the amino-terminal interface does not change heterotetrameric AMPAR assembly. (A) Cartoon diagram for the view from the bottom of
ATD showing the AIF between GluA1/A2 dimers (purple in GluA2) and the corresponding sites (green) in GluA1. (B and C) The spontaneous dimer bands of
GluA1m_AIF2_660C were relatively stable when coexpressed with GluA2m_AIF1 (B), whereas the dimer bands of GluA2m_AIF1_664C were greatly decreased
with the coexpression of GluA1m_AIF2 (C). Values are means ± SEMs. n = 7 (B); n = 4 (C); P < 0.01 (one-way ANOVA).
He et al. www.pnas.org/cgi/content/short/1524358113 6 of 12
17. Fig. S7. The cross-linking pattern for GluA1/A2 when FLAG epitope was inserted around SP. (A and B) FLAG insertion after the excising site of GluA1 and
GluA2 did not change the cross-linking pattern. (C) The GluA1m_I660C dimer band was significantly decreased with the coexpression of GluA2m when FLAG
was inserted before the SP of both subunits. (D) The GluA2m_I664C dimer band was significantly decreased with the coexpression of GluA1m when FLAG was
inserted before the SP of both subunits. It is noted that the molecular mass of GluA2 shifted up with GluA1 coexpression, suggesting that GluA1 promoted
GluA2 maturation.
He et al. www.pnas.org/cgi/content/short/1524358113 7 of 12
18. Fig. S8. GluA1/A2 with identical SPs lost the spatial assembly priority. (A and B) The spontaneous dimer bands of SPK_GluA1m_660C were greatly decreased
when coexpressed with SPK_GluA2m (A). The dimer bands of SPK_GluA2m_664C were also greatly decreased with the coexpression of SPK_GluA1m (B). Values
are means ± SEMs; n = 4 (A); n = 3 (B); P < 0.01 (one-way ANOVA). (C and D) The spontaneous dimer bands of GluA1m_660C were greatly decreased when
coexpressed with SP1_GluA2m (C). The dimer bands of SP1_GluA2m_664C were also greatly decreased with the coexpression of GluA1m (D). Values are means ±
SEMs; n = 3 (C and D); P < 0.001 (one-way ANOVA).
He et al. www.pnas.org/cgi/content/short/1524358113 8 of 12
19. Fig. S9. Theoretical model of spatial assembly for the GluA1/A2 heterotetramer. Cysteine residues were introduced at the interface between LBD dimers. The
Cys-tagged subunit was coexpressed with an untagged pattern with variable ratios. The possible position of the subunits was predicted with three models (i.e.,
preferred 1–2–1–2, preferred 2–1–2–1, and random assembly). A fourth model assumed that GluA1/A2 preferred to form heterodimers and then assembled
into tetramers in a random manner. The experimental data were compared with those models. (A) GluA1m/A2m and GluA1m/SPK_GluA2m had similar cross-
linking patterns. The dimer bands of GluA1 subunits were relatively stable with the coexpression of one to four times GluA2m. The cross-linking patterns are
closely represented by the 1–2–1–2 model. (B) SP1_GluA1m/SP1_GluA2m and SPK_GluA1m/SP1_GluA2m had similar cross-linking pattern that can be best
explained with the 2–1–2–1 model. (C) Under five conditions, the GluA1/A2 cross-linking pattern were close to the hetero-random model, where heteromeric
dimers were preferred to form before random assembly into tetramers. (D) Summary of how SPs change the spatial assembly pattern.
He et al. www.pnas.org/cgi/content/short/1524358113 9 of 12
20. Fig. S10. Alignment of SPs of GluA1 and GluA2 among species. (A) Alignment of SPs of GluA1s from different species. (B) Alignment of SPs of GluA2s from
different species.
He et al. www.pnas.org/cgi/content/short/1524358113 10 of 12
21. Table S1. RIs of AMPAR mutations expressed in HEK cells
AMPAR subunit composition RI n Conclusion
A1 0.00 ± 0.00 4 Rectified
A1/A2 0.75 ± 0.07 6 Linear
Fig. 2 related
A1m/A2m_664C 0.78 ± 0.09 6 Linear
2 x A1m/A2m_664C 0.25 ± 0.02 5 PR
4 x A1m/A2m_664C 0.10 ± 0.02 5 Rectified
A1m_660C/A2m 0.62 ± 0.09 6 Linear
A1m_660C/ 2 x A2m 0.78 ± 0.08 6 Linear
A1m_660C/ 4 x A2m 0.75 ± 0.05 6 Linear
A1m_660C/A2m_664C 0.70 ± 0.06 7 Linear
Fig. 3 related
A1m/A1-2m 0.61 ± 0.05 8 Linear
A2-1m/A2m 0.59 ± 0.04 9 Linear
A2-1m/A1-2_664C 0.59 ± 0.02 7 Linear
2 x A2-1m/A1-2_664C 0.47 ± 0.06 4 PR
4 x A2-1m/A1-2_664C 0.24 ± 0.09 6 PR
A2-1_660C/A1-2m 0.73 ± 0.06 7 Linear
A2-1_660C/ 2 x A1-2m 0.64 ± 0.07 7 Linear
A2-1_660C/ 4 x A1-2m 0.51 ± 0.06 6 Linear
Fig. 4 related
A1m/SP1_A2m 0.51 ± 0.07 19 Linear
SP2_A1m /A2m 0.63 ± 0.07 9 Linear
SP2_A1m/SP1_A2m 0.75 ± 0.04 9 Linear
SP2_A1m/SP1_A2m_664C 0.78 ± 0.04 7 Linear
2 x SP2_A1m/SP1_A2m_664C 0.20 ± 0.09 5 PR
4 x SP2_A1m/SP1_A2m_664C 0.18 ± 0.05 8 PR
SP2_A1m_660C/SP1_A2m 0.76 ± 0.06 8 Linear
SP2_A1m_660C/ 2 x SP1_A2m 0.79 ± 0.05 5 Linear
SP2_A1m_660C/ 4 x SP1_A2m 0.81 ± 0.04 5 Linear
Fig. 6 related
SPK_A1m/A2m 0.71 ± 0.07 7 Linear
SPK_A1m/A2m_664C 0.76 ± 0.05 8 Linear
2 x SPK_A1m/A2m_664C 0.41 ± 0.06 6 PR
4 x SPK_A1m/A2m_664C 0.31 ± 0.05 7 PR
SPK_A1m_660C/A2m 0.78 ± 0.05 8 Linear
SPK_A1m_660C/ 2 x A2m 0.66 ± 0.07 5 Linear
SPK_A1m_660C/ 4 x A2m 0.63 ± 0.07 6 Linear
A1m/SPK_A2m_664C 0.61 ± 0.05 9 Linear
2 x A1m/SPK_A2m_664C 0.31 ± 0.03 9 PR
4 x A1m/SPK_A2m_664C 0.13 ± 0.02 10 Rectified
A1m_660C/SPK_A2m 0.58 ± 0.04 24 Linear
A1m_660C/ 2 x SPK_A2m 0.88 ± 0.03 5 Linear
A1m_660C/ 4 x SPK_A2m 0.87 ± 0.09 5 Linear
SPK_A1m/SP1_A2m_664C 0.76 ± 0.07 6 Linear
2xSPK_A1m/SP1_A2m_664C 0.23 ± 0.06 7 PR
4xSPK_A1m/SP1_A2m_664C 0.19 ± 0.05 5 PR
SPK_A1m_660C/SP1_A2m 0.58 ± 0.05 6 Linear
SPK_A1m_660C/ 2 x SP1_A2m 0.81 ± 0.06 5 Linear
SPK_A1m_660C/ 4 x SP1_A2m 0.62 ± 0.05 9 Linear
Fig. 7 related
A1mΔN 0.07 ± 0.04 6 Rectified
A1mΔN/A2mΔN 0.24 ± 0.08 6 PR
A1mΔN/ 2 x A2mΔN 0.32 ± 0.11 7 PR
A1mΔN/ 4 x A2mΔN 0.59 ± 0.05 12 Linear
A1m 0.15 ± 0.04 6 Rectified
A1m/A2m 0.71 ± 0.04 17 Linear
A1m/ 2 x A2m 0.81 ± 0.05 7 Linear
A1m/ 4 x A2m 0.81 ± 0.06 6 Linear
Related to SI figures
A1m_AIF2/A2m_AIF1_664C 0.59 ± 0.05 6 Linear
A1m_AIF2_660C/A2m_AIF1 0.69 ± 0.05 6 Linear
SP_FLAG_A1m/SP_FLAG_A2m 0.74 ± 0.05 14 Linear
SP_FLAG_A1m/SP_FLAG_A2m_664C 0.62 ± 0.12 5 Linear
He et al. www.pnas.org/cgi/content/short/1524358113 11 of 12
22. Table S1. Cont.
AMPAR subunit composition RI n Conclusion
SP_FLAG_A1m_660C/SP_FLAG_A2m 0.62 ± 0.08 5 Linear
FLAG_SP_A1m/FLAG_SP_A2m 0.62 ± 0.10 6 Linear
FLAG_SP_A1m/FLAG_SP_A2m_664C 0.70 ± 0.04 5 Linear
FLAG_SP_A1m_660C/FLAG_SP_A2m 0.78 ± 0.03 5 Linear
SPK_A1m/SPK_A2m 0.70 ± 0.04 20 Linear
SPK_A1m/SPK_A2m_664C 0.52 ± 0.09 6 Linear
SPK_A1m_660C/SPK_A2m 0.85 ± 0.02 5 Linear
Values are means ± SEM. PR, partially rectified; refers to RIs of <0.5 but >0.15.
He et al. www.pnas.org/cgi/content/short/1524358113 12 of 12
![that the SP of GluA1 played a major role in determining AMPAR
spatial assembly. This work uncovered the architecture of GluA1/A2
AMPARs in the brain and revealed a novel function of SPs for
transmembrane proteins.
Results
GluA1 and GluA2 Form Heterodimers in ATDs. The crystal struc-
tures of homotetrameric GluA2 demonstrate that AMPARs are
assembled with two pairs of conformationally distinct subunits
(16–18). The different subunit conformations in the AMPAR
complex further increase the assembly complexity of heteromeric
AMPARs. Regarding GluA1/A2 receptors, if GluA1 and GluA2
can be randomly assembled, there would be eight different pos-
sible spatial arrangements (Fig. S1). For example, a receptor
composed of one GluA1 and three GluA2s (1:3 stoichiometry)
would have two possible architectures, such as 1–2–2–2 (with
GluA1 in the A-type conformation) and 2–1–2–2 (with GluA1 in
the B-type conformation) (Fig. S1A). Similarly, there would be
two assembly possibilities for a receptor with 3:1 stoichiometry
(Fig. S1B). If the receptor prefers to assemble in 2:2 stoichiom-
etry (15), there would be four differential spatial arrangements
(Fig. S1C). Even if the receptor has a fixed 2:2 stoichiometry and
the preferred spatial symmetry (5), it still could be assembled into
1–2–1–2 or 2–1–2–1 architecture.
To understand the assembly of heteromeric GluA1/A2 recep-
tors, we built a model of homomeric GluA1 receptors based on
the X-ray structure of homomeric GluA2 AMPAR [Protein
Data Bank identifier (PDB ID) 3KG2; ref. 18 and Fig. 1A].
The structure of the GluA1 model was Y-shaped, with four
subunits presenting two different conformations in the tetra-
mer, arranged in A–B–A′–B′ architecture (Fig. 1 A and B).
Both ATD and ligand-binding domain (LBD) assembled as
dimer of dimers. Notably, the subunit pairs that form the ATD
dimer swapped partners in the LBD.
To experimentally verify the dimer formation in ATDs and
LBDs in our GluA1 model, we generated a series of cysteine
mutants of GluA1 and GluA2 and tested the oligomer formation
by nonreducing Western blot assays. The wild-type (WT) GluA1
contains 13 native cysteine residues, which might interfere with
the introduced cysteines by forming spontaneous cross-linking
background bands (Fig. S2A). According to the GluA1 model,
Cys-57 and -305 in the ATD and Cys-714 and -769 in the LBD
probably form native disulfide bonds, and Cys-93, -89, -186, and
-421 are buried in the protein interior. The remaining five cys-
teine residues, including Cys-524, -585, -811, -825, and -875, were
mutated to nonreducing alanines. As expected, the mutated
GluA1 (GluA1m) showed reduced background on the non-
reducing Western gel (Fig. S2A). Similarly, we generated a mu-
tated GluA2 (GluA2m) in which four surface cysteine residues,
Fig. 1. Heteromeric dimers in the ATD and LBD of
GluA1/A2 receptor. (A) Homomeric GluA1 model
with the four subunits colored individually. (B and C)
Cartoon diagram for the view from the top of ATD
(B) and close-up of the interface between subunits A
and B (C) showing the positions cysteine mutants
were introduced to cross-link the A and B subunits in
a tetramer assembly. (D) Western blot for GluA1 and
GluA2 ATD cross-links created by cysteine muta-
genesis designed in C. (E and F) Cartoon diagram for
the view from the top of LBD (E) and stereoview
(F) showing cysteine mutants designed to cross-link the
B and A′ subunits in a GluA1/A2 tetramer assembly. (G)
Western blot for GluA1 and GluA2 LBD cross-links
created by cysteine mutagenesis designed in F.
E5646 | www.pnas.org/cgi/doi/10.1073/pnas.1524358113 He et al.](data:image/gif;base64,R0lGODlhAQABAIAAAAAAAP///yH5BAEAAAAALAAAAAABAAEAAAIBRAA7)