SlideShare ist ein Scribd-Unternehmen logo
1 von 2
Downloaden Sie, um offline zu lesen
© 2019 Jones Lang LaSalle IP, Inc. All rights reserved. All information contained herein is from sources deemed reliable; however, no representation or warranty is made to the accuracy thereof.
Q4 2018
Detroit
Office Insight
The fourth quarter of 2018 was highlighted by yet another high-profile
groundbreaking, as Bedrock began work on the Monroe Blocks development,
a mixed-use project totaling over 1.4 million square feet that will bring
approximately 847,000 square feet to the CBD office inventory. Construction
work is also underway on the expansion of One Campus Martius downtown,
which will increase the building’s footprint by approximately 310,000 square
feet. Market-wide, total vacancy fell by 60 basis points to 20.2 percent as
149,007 square feet was absorbed, while average asking rents rose by 1.0
percent up to $19.85 per square foot.
Molina healthcare vacated their 41,200-square-foot downtown space at 615 W
Lafayette to consolidate in Troy, while Coyote Logistics is rumored to be
considering taking space for 300 employees in Corktown. HAP began their
move to Troy, which will see about 1,100 employees shift from Southfield to
the former United Shore building. In Novi, Northern Equities announced plans
for a 210,000-square-foot addition to the Haggerty Corridor Office Park.
Downtown, the renovated Lear building at 230 E. Grand River sold for $237 per
square foot , while the 30,000-square-foot office building at the base of the
Guardian Building sold for $155 per square foot.
Outlook
Looking into 2019, we expect rent growth to continue as vacancies compress
below 20.0 percent. There are still large sublease availabilities in the region,
most notably in the I-275 corridor; it will be interesting to keep an eye on the
lease-up time for these large subleases. Other lease activity to monitor will be
that in the new CBD developments. With over 1.4 million square feet of space
under construction, the type of tenants attracted, as well as the rents
achieved here will be noteworthy. As sales prices in the CBD continue to
climb, more buildings could hit the market for sale in 2019.
Fundamentals Forecast
YTD net absorption -177,355 s.f. ▲
Under construction 1,608,000 s.f. ▲
Total vacancy 20.2 % ▼
Average asking rent (gross) $19.85 p.s.f. ▲
Concessions Falling ▼
-500,000
0
500,000
1,000,000
2015 2016 2017 2018
Supply and demand (s.f.) Net absorption
Deliveries
Downtown construction highlights the fourth quarter
21.7%
21.0%
19.8%
20.2%
2015 2016 2017 2018
Total vacancy
$0.00
$10.00
$20.00
$30.00
2015 2016 2017 2018
Average asking rents ($/s.f.) Class A
Class B
For more information, contact: Harrison West | harrison.west@am.jll.com
• Bedrock breaks ground on the Monroe Blocks development, adding
more square footage to their downtown projects - the Hudson’s site and
the One Campus Martius expansion are also underway.
• Vacancy fell by 60 basis points from the third quarter of 2018, while
average asking rents increased by 1.0 percent.
• Large sublease space remains in the suburbs, most notably the I-275
corridor submarkets and Troy.
© 2019 Jones Lang LaSalle IP, Inc. All rights reserved. All information contained herein is from sources deemed reliable; however, no representation or warranty is made to the accuracy thereof.
Q4 2018
Office Statistics
Detroit
For more information, contact: Harrison West | harrison.west@am.jll.com
Class
Inventory
(s.f.)
Total net
absorption
(s.f.)
YTD total net
absorption
(s.f.)
YTD total net
absorption (%
of stock)
Direct vacancy
(%)
Total
vacancy (%)
Average
direct asking
rent ($ p.s.f.)
YTD
Completions
(s.f.)
Under
Development
(s.f.)
Birmingham/Bloomfield Totals 3,979,668 19,612 -27,996 -0.7% 18.8% 19.0% $27.42 0 0
Dearborn Totals 2,705,625 -2,714 83,713 3.1% 24.3% 24.5% $17.32 150,000 0
Downriver Totals 483,907 2,434 13,885 2.9% 36.8% 38.3% $12.82 0 0
Farmington/Farmington Hills Totals 4,658,516 -82,651 -126,444 -2.7% 17.4% 18.5% $18.10 0 0
Macomb Totals 1,333,505 51,072 89,349 6.7% 10.6% 10.6% $14.67 0 0
North Oakland Totals 2,260,888 40,320 107,470 4.8% 16.5% 16.5% $18.34 53,240 0
Northern I-275 Corridor Totals 4,467,691 74,018 10,096 0.2% 10.5% 12.3% $19.32 0 0
Royal Oak / SE Oakland Totals 782,998 11,106 76,612 9.8% 5.6% 5.7% $16.82 76,288 55,000
Southern I-275 Corridor Totals 1,077,525 1,948 -108,132 -10.0% 0.0% 23.3% $0.00 0 0
Southfield Totals 13,235,696 -44,679 -174,845 -1.3% 28.2% 30.3% $18.17 0 0
Troy Totals 11,003,062 49,733 -161,799 -1.5% 23.0% 25.3% $19.73 0 0
Washtenaw Totals 6,673,772 -4,262 -14,614 -0.2% 9.6% 11.1% $25.80 60,000 30,000
Suburbs Totals 52,662,853 115,937 -273,399 -0.5% 19.6% 21.6% $19.55 339,528 85,000
CBD Totals 13,477,209 -2,806 72,682 0.5% 13.9% 15.2% $22.24 160,000 1,523,000
New Center Totals 1,486,775 35,876 23,362 1.6% 18.1% 18.2% $19.22 0 0
Urban Totals 14,963,984 33,070 96,044 0.6% 14.3% 15.5% $21.64 160,000 1,523,000
Detroit Totals 67,626,837 149,007 -177,355 -0.3% 18.4% 20.2% $19.85 499,528 1,608,000
Birmingham/Bloomfield A 1,569,497 16,564 -8,411 -0.5% 26.9% 27.2% $29.52 0 0
Dearborn A 446,890 0 -1,150 -0.3% 1.0% 1.0% $24.00 150,000 0
Farmington/Farmington Hills A 618,109 1,453 36,885 6.0% 8.1% 8.1% $22.69 0 0
Macomb A 295,494 -2,022 -2,474 -0.8% 3.7% 3.7% $18.97 0 0
North Oakland A 541,905 1,071 54,842 10.1% 15.3% 15.3% $20.85 53,240 0
Northern I-275 Corridor A 1,113,719 4,279 -4,891 -0.4% 6.4% 7.3% $19.98 0 0
Royal Oak / SE Oakland A 76,288 0 76,288 100.0% 0.0% 0.0% $0.00 76,288 55,000
Southern I-275 Corridor A 832,753 0 -109,432 -13.1% 0.0% 30.1% $0.00 0 0
Southfield A 2,970,217 -9,987 -37,048 -1.2% 24.0% 27.0% $21.06 0 0
Troy A 1,924,131 31,181 50,769 2.6% 14.4% 18.2% $24.90 0 0
Washtenaw A 3,278,983 18,473 127,960 3.9% 8.7% 8.7% $29.05 60,000 30,000
Suburbs A 13,667,986 61,012 183,338 1.3% 14.0% 17.2% $24.64 339,528 235,000
CBD A 6,354,714 22,124 83,445 1.3% 8.9% 11.0% $23.78 160,000 1,523,000
Urban A 6,354,714 22,124 83,445 1.3% 8.9% 11.0% $23.78 160,000 1,523,000
Detroit A 20,022,700 83,136 266,783 1.3% 12.4% 15.2% $24.44 499,528 1,608,000
Birmingham/Bloomfield B 2,410,171 3,048 -19,585 -0.8% 13.5% 13.7% $24.08 0 0
Dearborn B 2,258,735 -2,714 84,863 3.8% 28.9% 29.1% $17.26 0 0
Downriver B 483,907 2,434 13,885 2.9% 36.8% 38.3% $12.82 0 0
Farmington/Farmington Hills B 4,040,407 -84,104 -163,329 -4.0% 18.8% 20.1% $17.82 0 0
Macomb B 991,381 53,094 91,823 9.3% 13.2% 13.2% $14.43 0 0
North Oakland B 1,718,983 39,249 52,988 3.1% 16.8% 16.9% $17.43 0 0
Northern I-275 Corridor B 3,353,972 69,739 14,987 0.4% 11.9% 13.9% $19.20 0 0
Royal Oak / SE Oakland B 706,710 11,106 324 0.0% 6.2% 6.3% $16.82 0 0
Southern I-275 Corridor B 244,772 1,948 1,300 0.5% 0.0% 0.0% $0.00 0 0
Southfield B 10,265,479 -34,692 -137,797 -1.3% 29.4% 31.3% $17.20 0 0
Troy B 9,078,931 18,552 -202,511 -2.2% 24.8% 26.8% $18.82 0 0
Washtenaw B 3,394,789 -22,735 -193,685 -5.7% 10.4% 13.4% $21.20 0 0
Suburbs B 38,948,237 54,925 -456,737 -1.2% 21.6% 23.2% $18.02 0 0
CBD B 7,122,495 -24,930 -10,763 -0.2% 18.3% 19.0% $20.53 0 0
New Center B 1,486,775 35,876 23,362 1.6% 18.1% 18.2% $19.22 0 0
Urban B 8,609,270 10,946 12,599 0.1% 18.3% 18.8% $20.08 0 0
Detroit B 47,557,507 65,871 -444,138 -0.9% 21.0% 22.4% $18.26 0 0

Weitere ähnliche Inhalte

Was ist angesagt?

JLL Detroit Office Insight & Statistics – Q2 2016
JLL Detroit Office Insight & Statistics – Q2 2016JLL Detroit Office Insight & Statistics – Q2 2016
JLL Detroit Office Insight & Statistics – Q2 2016Aaron Moore
 
JLL Pittsburgh Office Insight & Statistics - Q3 2019
 JLL Pittsburgh Office Insight & Statistics - Q3 2019 JLL Pittsburgh Office Insight & Statistics - Q3 2019
JLL Pittsburgh Office Insight & Statistics - Q3 2019Tobiah Bilski
 
JLL Cleveland Office Outlook: Q4 2018
JLL Cleveland Office Outlook: Q4 2018JLL Cleveland Office Outlook: Q4 2018
JLL Cleveland Office Outlook: Q4 2018Andrew Batson
 
JLL Cleveland Office Outlook: Q3 2018
JLL Cleveland Office Outlook: Q3 2018JLL Cleveland Office Outlook: Q3 2018
JLL Cleveland Office Outlook: Q3 2018Andrew Batson
 
JLL Cleveland Office Outlook: Q3 2017
JLL Cleveland Office Outlook: Q3 2017JLL Cleveland Office Outlook: Q3 2017
JLL Cleveland Office Outlook: Q3 2017Andrew Batson
 
JLL Pittsburgh Office Insight & Statistics - Q1 2020
JLL Pittsburgh Office Insight & Statistics - Q1 2020JLL Pittsburgh Office Insight & Statistics - Q1 2020
JLL Pittsburgh Office Insight & Statistics - Q1 2020Tobiah Bilski
 
JLL Cleveland Office Outlook: Q3 2019
JLL Cleveland Office Outlook: Q3 2019JLL Cleveland Office Outlook: Q3 2019
JLL Cleveland Office Outlook: Q3 2019Johnathan Miller
 
JLL Pittsburgh Office Insight & Statistics - Q4 2018
JLL Pittsburgh Office Insight & Statistics - Q4 2018JLL Pittsburgh Office Insight & Statistics - Q4 2018
JLL Pittsburgh Office Insight & Statistics - Q4 2018Tobiah Bilski
 
JLL Pittsburgh Office Insight & Statistics - Q3 2018
JLL Pittsburgh Office Insight & Statistics - Q3 2018JLL Pittsburgh Office Insight & Statistics - Q3 2018
JLL Pittsburgh Office Insight & Statistics - Q3 2018Tobiah Bilski
 
Pittsburgh Office Insight & Stats Q1 2022
Pittsburgh Office Insight & Stats Q1 2022Pittsburgh Office Insight & Stats Q1 2022
Pittsburgh Office Insight & Stats Q1 2022Tobiah Bilski
 
JLL Detroit Office Outlook: Q4 2015
JLL Detroit Office Outlook: Q4 2015JLL Detroit Office Outlook: Q4 2015
JLL Detroit Office Outlook: Q4 2015Aaron Moore
 
JLL Cleveland Office Outlook: Q1 2018
JLL Cleveland Office Outlook: Q1 2018JLL Cleveland Office Outlook: Q1 2018
JLL Cleveland Office Outlook: Q1 2018Andrew Batson
 
Cushman & Wakefield's Canadian Office Statistical Summary Q4 2018
Cushman & Wakefield's Canadian Office Statistical Summary Q4 2018Cushman & Wakefield's Canadian Office Statistical Summary Q4 2018
Cushman & Wakefield's Canadian Office Statistical Summary Q4 2018Guy Masse
 
JLL Pittsburgh Office Insight & Statistics - Q2 2018
JLL Pittsburgh Office Insight & Statistics - Q2 2018 JLL Pittsburgh Office Insight & Statistics - Q2 2018
JLL Pittsburgh Office Insight & Statistics - Q2 2018 Tobiah Bilski
 
Cushman & Wakefield Montreal Americas Marketbeat Office Q12019 #CRE #RealEstate
Cushman & Wakefield Montreal Americas Marketbeat Office Q12019  #CRE #RealEstateCushman & Wakefield Montreal Americas Marketbeat Office Q12019  #CRE #RealEstate
Cushman & Wakefield Montreal Americas Marketbeat Office Q12019 #CRE #RealEstateGuy Masse
 
JLL Pittsburgh Office Insight & Statistics - Q4 2019
JLL Pittsburgh Office Insight & Statistics - Q4 2019JLL Pittsburgh Office Insight & Statistics - Q4 2019
JLL Pittsburgh Office Insight & Statistics - Q4 2019Tobiah Bilski
 
JLL Cleveland Office Outlook: Q2 2018
JLL Cleveland Office Outlook: Q2 2018JLL Cleveland Office Outlook: Q2 2018
JLL Cleveland Office Outlook: Q2 2018Andrew Batson
 
JLL Cleveland Office Outlook: Q1 2017
JLL Cleveland Office Outlook: Q1 2017JLL Cleveland Office Outlook: Q1 2017
JLL Cleveland Office Outlook: Q1 2017Andrew Batson
 
JLL Cleveland Office Outlook: Q1 2018
JLL Cleveland Office Outlook: Q1 2018JLL Cleveland Office Outlook: Q1 2018
JLL Cleveland Office Outlook: Q1 2018Andrew Batson
 

Was ist angesagt? (20)

JLL Detroit Office Insight & Statistics – Q2 2016
JLL Detroit Office Insight & Statistics – Q2 2016JLL Detroit Office Insight & Statistics – Q2 2016
JLL Detroit Office Insight & Statistics – Q2 2016
 
JLL Pittsburgh Office Insight & Statistics - Q3 2019
 JLL Pittsburgh Office Insight & Statistics - Q3 2019 JLL Pittsburgh Office Insight & Statistics - Q3 2019
JLL Pittsburgh Office Insight & Statistics - Q3 2019
 
JLL Cleveland Office Outlook: Q4 2018
JLL Cleveland Office Outlook: Q4 2018JLL Cleveland Office Outlook: Q4 2018
JLL Cleveland Office Outlook: Q4 2018
 
JLL Cleveland Office Outlook: Q3 2018
JLL Cleveland Office Outlook: Q3 2018JLL Cleveland Office Outlook: Q3 2018
JLL Cleveland Office Outlook: Q3 2018
 
JLL Cleveland Office Outlook: Q3 2017
JLL Cleveland Office Outlook: Q3 2017JLL Cleveland Office Outlook: Q3 2017
JLL Cleveland Office Outlook: Q3 2017
 
Q1 2018 | Houston Office | Research & Forecast Report
Q1 2018 | Houston Office | Research & Forecast ReportQ1 2018 | Houston Office | Research & Forecast Report
Q1 2018 | Houston Office | Research & Forecast Report
 
JLL Pittsburgh Office Insight & Statistics - Q1 2020
JLL Pittsburgh Office Insight & Statistics - Q1 2020JLL Pittsburgh Office Insight & Statistics - Q1 2020
JLL Pittsburgh Office Insight & Statistics - Q1 2020
 
JLL Cleveland Office Outlook: Q3 2019
JLL Cleveland Office Outlook: Q3 2019JLL Cleveland Office Outlook: Q3 2019
JLL Cleveland Office Outlook: Q3 2019
 
JLL Pittsburgh Office Insight & Statistics - Q4 2018
JLL Pittsburgh Office Insight & Statistics - Q4 2018JLL Pittsburgh Office Insight & Statistics - Q4 2018
JLL Pittsburgh Office Insight & Statistics - Q4 2018
 
JLL Pittsburgh Office Insight & Statistics - Q3 2018
JLL Pittsburgh Office Insight & Statistics - Q3 2018JLL Pittsburgh Office Insight & Statistics - Q3 2018
JLL Pittsburgh Office Insight & Statistics - Q3 2018
 
Pittsburgh Office Insight & Stats Q1 2022
Pittsburgh Office Insight & Stats Q1 2022Pittsburgh Office Insight & Stats Q1 2022
Pittsburgh Office Insight & Stats Q1 2022
 
JLL Detroit Office Outlook: Q4 2015
JLL Detroit Office Outlook: Q4 2015JLL Detroit Office Outlook: Q4 2015
JLL Detroit Office Outlook: Q4 2015
 
JLL Cleveland Office Outlook: Q1 2018
JLL Cleveland Office Outlook: Q1 2018JLL Cleveland Office Outlook: Q1 2018
JLL Cleveland Office Outlook: Q1 2018
 
Cushman & Wakefield's Canadian Office Statistical Summary Q4 2018
Cushman & Wakefield's Canadian Office Statistical Summary Q4 2018Cushman & Wakefield's Canadian Office Statistical Summary Q4 2018
Cushman & Wakefield's Canadian Office Statistical Summary Q4 2018
 
JLL Pittsburgh Office Insight & Statistics - Q2 2018
JLL Pittsburgh Office Insight & Statistics - Q2 2018 JLL Pittsburgh Office Insight & Statistics - Q2 2018
JLL Pittsburgh Office Insight & Statistics - Q2 2018
 
Cushman & Wakefield Montreal Americas Marketbeat Office Q12019 #CRE #RealEstate
Cushman & Wakefield Montreal Americas Marketbeat Office Q12019  #CRE #RealEstateCushman & Wakefield Montreal Americas Marketbeat Office Q12019  #CRE #RealEstate
Cushman & Wakefield Montreal Americas Marketbeat Office Q12019 #CRE #RealEstate
 
JLL Pittsburgh Office Insight & Statistics - Q4 2019
JLL Pittsburgh Office Insight & Statistics - Q4 2019JLL Pittsburgh Office Insight & Statistics - Q4 2019
JLL Pittsburgh Office Insight & Statistics - Q4 2019
 
JLL Cleveland Office Outlook: Q2 2018
JLL Cleveland Office Outlook: Q2 2018JLL Cleveland Office Outlook: Q2 2018
JLL Cleveland Office Outlook: Q2 2018
 
JLL Cleveland Office Outlook: Q1 2017
JLL Cleveland Office Outlook: Q1 2017JLL Cleveland Office Outlook: Q1 2017
JLL Cleveland Office Outlook: Q1 2017
 
JLL Cleveland Office Outlook: Q1 2018
JLL Cleveland Office Outlook: Q1 2018JLL Cleveland Office Outlook: Q1 2018
JLL Cleveland Office Outlook: Q1 2018
 

Ähnlich wie JLL Detroit Office Insight & Statistics - Q4 2018

JLL Detroit Office Insight & Statistics - Q2 2019
JLL Detroit Office Insight & Statistics - Q2 2019JLL Detroit Office Insight & Statistics - Q2 2019
JLL Detroit Office Insight & Statistics - Q2 2019Harrison West
 
JLL Detroit Office Insight & Statistics - Q3 2017
JLL Detroit Office Insight & Statistics - Q3 2017JLL Detroit Office Insight & Statistics - Q3 2017
JLL Detroit Office Insight & Statistics - Q3 2017Harrison West
 
JLL Houston Office Market Report - Q4 2018
JLL Houston Office Market Report - Q4 2018JLL Houston Office Market Report - Q4 2018
JLL Houston Office Market Report - Q4 2018DavidDominy1
 
JLL Downtown Chicago Office Market Update - Q3 2016
JLL Downtown Chicago Office Market Update - Q3 2016JLL Downtown Chicago Office Market Update - Q3 2016
JLL Downtown Chicago Office Market Update - Q3 2016Hailey Harrington
 
JLL Cincinnati Office Outlook Q4 2020
JLL Cincinnati Office Outlook Q4 2020JLL Cincinnati Office Outlook Q4 2020
JLL Cincinnati Office Outlook Q4 2020Abby Armbruster
 
JLL Cleveland Office Outlook: Q2 2018
JLL Cleveland Office Outlook: Q2 2018JLL Cleveland Office Outlook: Q2 2018
JLL Cleveland Office Outlook: Q2 2018Andrew Batson
 
JLL Cincinnati Office Insight & Statistics - Q2 2016
JLL Cincinnati Office Insight & Statistics - Q2 2016JLL Cincinnati Office Insight & Statistics - Q2 2016
JLL Cincinnati Office Insight & Statistics - Q2 2016Ross Bratcher
 
JLL Pittsburgh Office Insight & Statistics - Q1 2019
JLL Pittsburgh Office Insight & Statistics - Q1 2019JLL Pittsburgh Office Insight & Statistics - Q1 2019
JLL Pittsburgh Office Insight & Statistics - Q1 2019Tobiah Bilski
 
JLL Grand Rapids Office Insight & Statistics - Q3 2018
JLL Grand Rapids Office Insight & Statistics - Q3 2018JLL Grand Rapids Office Insight & Statistics - Q3 2018
JLL Grand Rapids Office Insight & Statistics - Q3 2018Harrison West
 
JLL Pittsburgh Office Insight & Statistics - Q3 2021
JLL Pittsburgh Office Insight & Statistics - Q3 2021JLL Pittsburgh Office Insight & Statistics - Q3 2021
JLL Pittsburgh Office Insight & Statistics - Q3 2021Tobiah Bilski
 
JLL Cleveland Industrial Outlook: Q3 2018
JLL Cleveland Industrial Outlook: Q3 2018JLL Cleveland Industrial Outlook: Q3 2018
JLL Cleveland Industrial Outlook: Q3 2018Andrew Batson
 
JLL Cleveland Office Outlook: Q1 2018
JLL Cleveland Office Outlook: Q1 2018JLL Cleveland Office Outlook: Q1 2018
JLL Cleveland Office Outlook: Q1 2018Andrew Batson
 
Jll cincinnati office outlook q2 2017
Jll cincinnati office outlook   q2 2017Jll cincinnati office outlook   q2 2017
Jll cincinnati office outlook q2 2017Abby Armbruster
 
JLL Pittsburgh Office Outlook - Q4 2015
JLL Pittsburgh Office Outlook - Q4 2015JLL Pittsburgh Office Outlook - Q4 2015
JLL Pittsburgh Office Outlook - Q4 2015Andrew Batson
 
JLL Cleveland Industrial Outlook: Q4 2018
JLL Cleveland Industrial Outlook: Q4 2018JLL Cleveland Industrial Outlook: Q4 2018
JLL Cleveland Industrial Outlook: Q4 2018Andrew Batson
 

Ähnlich wie JLL Detroit Office Insight & Statistics - Q4 2018 (17)

JLL Detroit Office Insight & Statistics - Q2 2019
JLL Detroit Office Insight & Statistics - Q2 2019JLL Detroit Office Insight & Statistics - Q2 2019
JLL Detroit Office Insight & Statistics - Q2 2019
 
JLL Detroit Office Insight & Statistics - Q3 2017
JLL Detroit Office Insight & Statistics - Q3 2017JLL Detroit Office Insight & Statistics - Q3 2017
JLL Detroit Office Insight & Statistics - Q3 2017
 
JLL Houston Office Report Q4
JLL Houston Office Report Q4JLL Houston Office Report Q4
JLL Houston Office Report Q4
 
JLL Houston Office Market Report - Q4 2018
JLL Houston Office Market Report - Q4 2018JLL Houston Office Market Report - Q4 2018
JLL Houston Office Market Report - Q4 2018
 
JLL Downtown Chicago Office Market Update - Q3 2016
JLL Downtown Chicago Office Market Update - Q3 2016JLL Downtown Chicago Office Market Update - Q3 2016
JLL Downtown Chicago Office Market Update - Q3 2016
 
JLL Houston 2018 Q1 Office Market Report
JLL Houston 2018 Q1 Office Market ReportJLL Houston 2018 Q1 Office Market Report
JLL Houston 2018 Q1 Office Market Report
 
JLL Cincinnati Office Outlook Q4 2020
JLL Cincinnati Office Outlook Q4 2020JLL Cincinnati Office Outlook Q4 2020
JLL Cincinnati Office Outlook Q4 2020
 
JLL Cleveland Office Outlook: Q2 2018
JLL Cleveland Office Outlook: Q2 2018JLL Cleveland Office Outlook: Q2 2018
JLL Cleveland Office Outlook: Q2 2018
 
JLL Cincinnati Office Insight & Statistics - Q2 2016
JLL Cincinnati Office Insight & Statistics - Q2 2016JLL Cincinnati Office Insight & Statistics - Q2 2016
JLL Cincinnati Office Insight & Statistics - Q2 2016
 
JLL Pittsburgh Office Insight & Statistics - Q1 2019
JLL Pittsburgh Office Insight & Statistics - Q1 2019JLL Pittsburgh Office Insight & Statistics - Q1 2019
JLL Pittsburgh Office Insight & Statistics - Q1 2019
 
JLL Grand Rapids Office Insight & Statistics - Q3 2018
JLL Grand Rapids Office Insight & Statistics - Q3 2018JLL Grand Rapids Office Insight & Statistics - Q3 2018
JLL Grand Rapids Office Insight & Statistics - Q3 2018
 
JLL Pittsburgh Office Insight & Statistics - Q3 2021
JLL Pittsburgh Office Insight & Statistics - Q3 2021JLL Pittsburgh Office Insight & Statistics - Q3 2021
JLL Pittsburgh Office Insight & Statistics - Q3 2021
 
JLL Cleveland Industrial Outlook: Q3 2018
JLL Cleveland Industrial Outlook: Q3 2018JLL Cleveland Industrial Outlook: Q3 2018
JLL Cleveland Industrial Outlook: Q3 2018
 
JLL Cleveland Office Outlook: Q1 2018
JLL Cleveland Office Outlook: Q1 2018JLL Cleveland Office Outlook: Q1 2018
JLL Cleveland Office Outlook: Q1 2018
 
Jll cincinnati office outlook q2 2017
Jll cincinnati office outlook   q2 2017Jll cincinnati office outlook   q2 2017
Jll cincinnati office outlook q2 2017
 
JLL Pittsburgh Office Outlook - Q4 2015
JLL Pittsburgh Office Outlook - Q4 2015JLL Pittsburgh Office Outlook - Q4 2015
JLL Pittsburgh Office Outlook - Q4 2015
 
JLL Cleveland Industrial Outlook: Q4 2018
JLL Cleveland Industrial Outlook: Q4 2018JLL Cleveland Industrial Outlook: Q4 2018
JLL Cleveland Industrial Outlook: Q4 2018
 

Kürzlich hochgeladen

SVN Live 5.6.24 Weekly Property Broadcast
SVN Live 5.6.24 Weekly Property BroadcastSVN Live 5.6.24 Weekly Property Broadcast
SVN Live 5.6.24 Weekly Property BroadcastSVN International Corp.
 
9990771857 Call Girls in Dwarka Sector 3 Delhi (Call Girls) Delhi
9990771857 Call Girls in Dwarka Sector 3 Delhi (Call Girls) Delhi9990771857 Call Girls in Dwarka Sector 3 Delhi (Call Girls) Delhi
9990771857 Call Girls in Dwarka Sector 3 Delhi (Call Girls) Delhidelhimodel235
 
Shapoorji Pallonji Joyville Vista Pune | Spend Your Family Time Together
Shapoorji Pallonji Joyville Vista Pune | Spend Your Family Time TogetherShapoorji Pallonji Joyville Vista Pune | Spend Your Family Time Together
Shapoorji Pallonji Joyville Vista Pune | Spend Your Family Time Togetheraidasheikh47
 
9990771857 Call Girls in Dwarka Sector 7 Delhi (Call Girls) Delhi
9990771857 Call Girls in Dwarka Sector 7 Delhi (Call Girls) Delhi9990771857 Call Girls in Dwarka Sector 7 Delhi (Call Girls) Delhi
9990771857 Call Girls in Dwarka Sector 7 Delhi (Call Girls) Delhidelhimodel235
 
9990771857 Call Girls Dwarka Sector 8 Delhi (Call Girls ) Delhi
9990771857 Call Girls  Dwarka Sector 8 Delhi (Call Girls ) Delhi9990771857 Call Girls  Dwarka Sector 8 Delhi (Call Girls ) Delhi
9990771857 Call Girls Dwarka Sector 8 Delhi (Call Girls ) Delhidelhimodel235
 
9990771857 Call Girls in Dwarka Sector 137 Noida (Call Girls) Delhi
9990771857 Call Girls in Dwarka Sector 137 Noida (Call Girls) Delhi9990771857 Call Girls in Dwarka Sector 137 Noida (Call Girls) Delhi
9990771857 Call Girls in Dwarka Sector 137 Noida (Call Girls) Delhidelhimodel235
 
2k Shot Call girls Karol Bagh Delhi 9205541914
2k Shot Call girls Karol Bagh Delhi 92055419142k Shot Call girls Karol Bagh Delhi 9205541914
2k Shot Call girls Karol Bagh Delhi 9205541914Delhi Call girls
 
2k Shot Call girls Aiims Delhi 9205541914
2k Shot Call girls Aiims Delhi 92055419142k Shot Call girls Aiims Delhi 9205541914
2k Shot Call girls Aiims Delhi 9205541914Delhi Call girls
 
Majestique Viman Nagar Pune Brochure.pdf
Majestique Viman Nagar Pune Brochure.pdfMajestique Viman Nagar Pune Brochure.pdf
Majestique Viman Nagar Pune Brochure.pdfBabyrudram
 
BDSM⚡Call Girls in Sector 55 Noida Escorts >༒8448380779 Escort Service
BDSM⚡Call Girls in Sector 55 Noida Escorts >༒8448380779 Escort ServiceBDSM⚡Call Girls in Sector 55 Noida Escorts >༒8448380779 Escort Service
BDSM⚡Call Girls in Sector 55 Noida Escorts >༒8448380779 Escort ServiceDelhi Call girls
 
M3M The Line Brochure - Premium Investment Opportunity for Commercial Ventures
M3M The Line Brochure - Premium Investment Opportunity for Commercial VenturesM3M The Line Brochure - Premium Investment Opportunity for Commercial Ventures
M3M The Line Brochure - Premium Investment Opportunity for Commercial Venturessheltercareglobal
 
Kohinoor Flats In Hinjewadi Phase 2 | Homes Built To Suit Your Needs
Kohinoor Flats In Hinjewadi Phase 2 | Homes Built To Suit Your NeedsKohinoor Flats In Hinjewadi Phase 2 | Homes Built To Suit Your Needs
Kohinoor Flats In Hinjewadi Phase 2 | Homes Built To Suit Your Needsaidasheikh47
 
9990771857 Call Girls Dwarka Sector 9 Delhi (Call Girls ) Delhi
9990771857 Call Girls Dwarka Sector 9 Delhi (Call Girls ) Delhi9990771857 Call Girls Dwarka Sector 9 Delhi (Call Girls ) Delhi
9990771857 Call Girls Dwarka Sector 9 Delhi (Call Girls ) Delhidelhimodel235
 
M3M 129 E Brochure Noida Expressway, Sector 129, Noida
M3M 129 E Brochure Noida Expressway, Sector 129, NoidaM3M 129 E Brochure Noida Expressway, Sector 129, Noida
M3M 129 E Brochure Noida Expressway, Sector 129, Noidasarak0han45400
 
Call Girls In Laxmi Nagar Delhi +91-8447779280! !Best Woman Seeking Man Escor...
Call Girls In Laxmi Nagar Delhi +91-8447779280! !Best Woman Seeking Man Escor...Call Girls In Laxmi Nagar Delhi +91-8447779280! !Best Woman Seeking Man Escor...
Call Girls In Laxmi Nagar Delhi +91-8447779280! !Best Woman Seeking Man Escor...asmaqueen5
 
TENANT SCREENING REPORT SERVICES​ How Tenant Screening Reports Work
TENANT SCREENING REPORT SERVICES​ How Tenant Screening Reports WorkTENANT SCREENING REPORT SERVICES​ How Tenant Screening Reports Work
TENANT SCREENING REPORT SERVICES​ How Tenant Screening Reports WorkTurbo Tenant
 
Call Girls In Vasant Vihar Delhi 💯Call Us 🔝8264348440🔝
Call Girls In Vasant Vihar Delhi 💯Call Us 🔝8264348440🔝Call Girls In Vasant Vihar Delhi 💯Call Us 🔝8264348440🔝
Call Girls In Vasant Vihar Delhi 💯Call Us 🔝8264348440🔝soniya singh
 
9990771857 Call Girls in Dwarka Sector 2 Delhi (Call Girls) Delhi
9990771857 Call Girls in Dwarka Sector 2 Delhi (Call Girls) Delhi9990771857 Call Girls in Dwarka Sector 2 Delhi (Call Girls) Delhi
9990771857 Call Girls in Dwarka Sector 2 Delhi (Call Girls) Delhidelhimodel235
 
Mahindra Happinest Tathawade Pune Brochure.pdf
Mahindra Happinest Tathawade Pune Brochure.pdfMahindra Happinest Tathawade Pune Brochure.pdf
Mahindra Happinest Tathawade Pune Brochure.pdfBabyrudram
 
Call Girls In Krishna Nagar Delhi (Escort)↫8447779280↬@SHOT 1500- NIGHT 5500→...
Call Girls In Krishna Nagar Delhi (Escort)↫8447779280↬@SHOT 1500- NIGHT 5500→...Call Girls In Krishna Nagar Delhi (Escort)↫8447779280↬@SHOT 1500- NIGHT 5500→...
Call Girls In Krishna Nagar Delhi (Escort)↫8447779280↬@SHOT 1500- NIGHT 5500→...asmaqueen5
 

Kürzlich hochgeladen (20)

SVN Live 5.6.24 Weekly Property Broadcast
SVN Live 5.6.24 Weekly Property BroadcastSVN Live 5.6.24 Weekly Property Broadcast
SVN Live 5.6.24 Weekly Property Broadcast
 
9990771857 Call Girls in Dwarka Sector 3 Delhi (Call Girls) Delhi
9990771857 Call Girls in Dwarka Sector 3 Delhi (Call Girls) Delhi9990771857 Call Girls in Dwarka Sector 3 Delhi (Call Girls) Delhi
9990771857 Call Girls in Dwarka Sector 3 Delhi (Call Girls) Delhi
 
Shapoorji Pallonji Joyville Vista Pune | Spend Your Family Time Together
Shapoorji Pallonji Joyville Vista Pune | Spend Your Family Time TogetherShapoorji Pallonji Joyville Vista Pune | Spend Your Family Time Together
Shapoorji Pallonji Joyville Vista Pune | Spend Your Family Time Together
 
9990771857 Call Girls in Dwarka Sector 7 Delhi (Call Girls) Delhi
9990771857 Call Girls in Dwarka Sector 7 Delhi (Call Girls) Delhi9990771857 Call Girls in Dwarka Sector 7 Delhi (Call Girls) Delhi
9990771857 Call Girls in Dwarka Sector 7 Delhi (Call Girls) Delhi
 
9990771857 Call Girls Dwarka Sector 8 Delhi (Call Girls ) Delhi
9990771857 Call Girls  Dwarka Sector 8 Delhi (Call Girls ) Delhi9990771857 Call Girls  Dwarka Sector 8 Delhi (Call Girls ) Delhi
9990771857 Call Girls Dwarka Sector 8 Delhi (Call Girls ) Delhi
 
9990771857 Call Girls in Dwarka Sector 137 Noida (Call Girls) Delhi
9990771857 Call Girls in Dwarka Sector 137 Noida (Call Girls) Delhi9990771857 Call Girls in Dwarka Sector 137 Noida (Call Girls) Delhi
9990771857 Call Girls in Dwarka Sector 137 Noida (Call Girls) Delhi
 
2k Shot Call girls Karol Bagh Delhi 9205541914
2k Shot Call girls Karol Bagh Delhi 92055419142k Shot Call girls Karol Bagh Delhi 9205541914
2k Shot Call girls Karol Bagh Delhi 9205541914
 
2k Shot Call girls Aiims Delhi 9205541914
2k Shot Call girls Aiims Delhi 92055419142k Shot Call girls Aiims Delhi 9205541914
2k Shot Call girls Aiims Delhi 9205541914
 
Majestique Viman Nagar Pune Brochure.pdf
Majestique Viman Nagar Pune Brochure.pdfMajestique Viman Nagar Pune Brochure.pdf
Majestique Viman Nagar Pune Brochure.pdf
 
BDSM⚡Call Girls in Sector 55 Noida Escorts >༒8448380779 Escort Service
BDSM⚡Call Girls in Sector 55 Noida Escorts >༒8448380779 Escort ServiceBDSM⚡Call Girls in Sector 55 Noida Escorts >༒8448380779 Escort Service
BDSM⚡Call Girls in Sector 55 Noida Escorts >༒8448380779 Escort Service
 
M3M The Line Brochure - Premium Investment Opportunity for Commercial Ventures
M3M The Line Brochure - Premium Investment Opportunity for Commercial VenturesM3M The Line Brochure - Premium Investment Opportunity for Commercial Ventures
M3M The Line Brochure - Premium Investment Opportunity for Commercial Ventures
 
Kohinoor Flats In Hinjewadi Phase 2 | Homes Built To Suit Your Needs
Kohinoor Flats In Hinjewadi Phase 2 | Homes Built To Suit Your NeedsKohinoor Flats In Hinjewadi Phase 2 | Homes Built To Suit Your Needs
Kohinoor Flats In Hinjewadi Phase 2 | Homes Built To Suit Your Needs
 
9990771857 Call Girls Dwarka Sector 9 Delhi (Call Girls ) Delhi
9990771857 Call Girls Dwarka Sector 9 Delhi (Call Girls ) Delhi9990771857 Call Girls Dwarka Sector 9 Delhi (Call Girls ) Delhi
9990771857 Call Girls Dwarka Sector 9 Delhi (Call Girls ) Delhi
 
M3M 129 E Brochure Noida Expressway, Sector 129, Noida
M3M 129 E Brochure Noida Expressway, Sector 129, NoidaM3M 129 E Brochure Noida Expressway, Sector 129, Noida
M3M 129 E Brochure Noida Expressway, Sector 129, Noida
 
Call Girls In Laxmi Nagar Delhi +91-8447779280! !Best Woman Seeking Man Escor...
Call Girls In Laxmi Nagar Delhi +91-8447779280! !Best Woman Seeking Man Escor...Call Girls In Laxmi Nagar Delhi +91-8447779280! !Best Woman Seeking Man Escor...
Call Girls In Laxmi Nagar Delhi +91-8447779280! !Best Woman Seeking Man Escor...
 
TENANT SCREENING REPORT SERVICES​ How Tenant Screening Reports Work
TENANT SCREENING REPORT SERVICES​ How Tenant Screening Reports WorkTENANT SCREENING REPORT SERVICES​ How Tenant Screening Reports Work
TENANT SCREENING REPORT SERVICES​ How Tenant Screening Reports Work
 
Call Girls In Vasant Vihar Delhi 💯Call Us 🔝8264348440🔝
Call Girls In Vasant Vihar Delhi 💯Call Us 🔝8264348440🔝Call Girls In Vasant Vihar Delhi 💯Call Us 🔝8264348440🔝
Call Girls In Vasant Vihar Delhi 💯Call Us 🔝8264348440🔝
 
9990771857 Call Girls in Dwarka Sector 2 Delhi (Call Girls) Delhi
9990771857 Call Girls in Dwarka Sector 2 Delhi (Call Girls) Delhi9990771857 Call Girls in Dwarka Sector 2 Delhi (Call Girls) Delhi
9990771857 Call Girls in Dwarka Sector 2 Delhi (Call Girls) Delhi
 
Mahindra Happinest Tathawade Pune Brochure.pdf
Mahindra Happinest Tathawade Pune Brochure.pdfMahindra Happinest Tathawade Pune Brochure.pdf
Mahindra Happinest Tathawade Pune Brochure.pdf
 
Call Girls In Krishna Nagar Delhi (Escort)↫8447779280↬@SHOT 1500- NIGHT 5500→...
Call Girls In Krishna Nagar Delhi (Escort)↫8447779280↬@SHOT 1500- NIGHT 5500→...Call Girls In Krishna Nagar Delhi (Escort)↫8447779280↬@SHOT 1500- NIGHT 5500→...
Call Girls In Krishna Nagar Delhi (Escort)↫8447779280↬@SHOT 1500- NIGHT 5500→...
 

JLL Detroit Office Insight & Statistics - Q4 2018

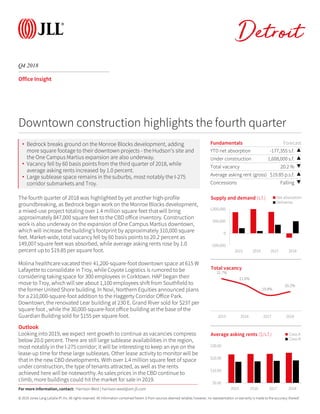
  • 1. © 2019 Jones Lang LaSalle IP, Inc. All rights reserved. All information contained herein is from sources deemed reliable; however, no representation or warranty is made to the accuracy thereof. Q4 2018 Detroit Office Insight The fourth quarter of 2018 was highlighted by yet another high-profile groundbreaking, as Bedrock began work on the Monroe Blocks development, a mixed-use project totaling over 1.4 million square feet that will bring approximately 847,000 square feet to the CBD office inventory. Construction work is also underway on the expansion of One Campus Martius downtown, which will increase the building’s footprint by approximately 310,000 square feet. Market-wide, total vacancy fell by 60 basis points to 20.2 percent as 149,007 square feet was absorbed, while average asking rents rose by 1.0 percent up to $19.85 per square foot. Molina healthcare vacated their 41,200-square-foot downtown space at 615 W Lafayette to consolidate in Troy, while Coyote Logistics is rumored to be considering taking space for 300 employees in Corktown. HAP began their move to Troy, which will see about 1,100 employees shift from Southfield to the former United Shore building. In Novi, Northern Equities announced plans for a 210,000-square-foot addition to the Haggerty Corridor Office Park. Downtown, the renovated Lear building at 230 E. Grand River sold for $237 per square foot , while the 30,000-square-foot office building at the base of the Guardian Building sold for $155 per square foot. Outlook Looking into 2019, we expect rent growth to continue as vacancies compress below 20.0 percent. There are still large sublease availabilities in the region, most notably in the I-275 corridor; it will be interesting to keep an eye on the lease-up time for these large subleases. Other lease activity to monitor will be that in the new CBD developments. With over 1.4 million square feet of space under construction, the type of tenants attracted, as well as the rents achieved here will be noteworthy. As sales prices in the CBD continue to climb, more buildings could hit the market for sale in 2019. Fundamentals Forecast YTD net absorption -177,355 s.f. ▲ Under construction 1,608,000 s.f. ▲ Total vacancy 20.2 % ▼ Average asking rent (gross) $19.85 p.s.f. ▲ Concessions Falling ▼ -500,000 0 500,000 1,000,000 2015 2016 2017 2018 Supply and demand (s.f.) Net absorption Deliveries Downtown construction highlights the fourth quarter 21.7% 21.0% 19.8% 20.2% 2015 2016 2017 2018 Total vacancy $0.00 $10.00 $20.00 $30.00 2015 2016 2017 2018 Average asking rents ($/s.f.) Class A Class B For more information, contact: Harrison West | harrison.west@am.jll.com • Bedrock breaks ground on the Monroe Blocks development, adding more square footage to their downtown projects - the Hudson’s site and the One Campus Martius expansion are also underway. • Vacancy fell by 60 basis points from the third quarter of 2018, while average asking rents increased by 1.0 percent. • Large sublease space remains in the suburbs, most notably the I-275 corridor submarkets and Troy.
  • 2. © 2019 Jones Lang LaSalle IP, Inc. All rights reserved. All information contained herein is from sources deemed reliable; however, no representation or warranty is made to the accuracy thereof. Q4 2018 Office Statistics Detroit For more information, contact: Harrison West | harrison.west@am.jll.com Class Inventory (s.f.) Total net absorption (s.f.) YTD total net absorption (s.f.) YTD total net absorption (% of stock) Direct vacancy (%) Total vacancy (%) Average direct asking rent ($ p.s.f.) YTD Completions (s.f.) Under Development (s.f.) Birmingham/Bloomfield Totals 3,979,668 19,612 -27,996 -0.7% 18.8% 19.0% $27.42 0 0 Dearborn Totals 2,705,625 -2,714 83,713 3.1% 24.3% 24.5% $17.32 150,000 0 Downriver Totals 483,907 2,434 13,885 2.9% 36.8% 38.3% $12.82 0 0 Farmington/Farmington Hills Totals 4,658,516 -82,651 -126,444 -2.7% 17.4% 18.5% $18.10 0 0 Macomb Totals 1,333,505 51,072 89,349 6.7% 10.6% 10.6% $14.67 0 0 North Oakland Totals 2,260,888 40,320 107,470 4.8% 16.5% 16.5% $18.34 53,240 0 Northern I-275 Corridor Totals 4,467,691 74,018 10,096 0.2% 10.5% 12.3% $19.32 0 0 Royal Oak / SE Oakland Totals 782,998 11,106 76,612 9.8% 5.6% 5.7% $16.82 76,288 55,000 Southern I-275 Corridor Totals 1,077,525 1,948 -108,132 -10.0% 0.0% 23.3% $0.00 0 0 Southfield Totals 13,235,696 -44,679 -174,845 -1.3% 28.2% 30.3% $18.17 0 0 Troy Totals 11,003,062 49,733 -161,799 -1.5% 23.0% 25.3% $19.73 0 0 Washtenaw Totals 6,673,772 -4,262 -14,614 -0.2% 9.6% 11.1% $25.80 60,000 30,000 Suburbs Totals 52,662,853 115,937 -273,399 -0.5% 19.6% 21.6% $19.55 339,528 85,000 CBD Totals 13,477,209 -2,806 72,682 0.5% 13.9% 15.2% $22.24 160,000 1,523,000 New Center Totals 1,486,775 35,876 23,362 1.6% 18.1% 18.2% $19.22 0 0 Urban Totals 14,963,984 33,070 96,044 0.6% 14.3% 15.5% $21.64 160,000 1,523,000 Detroit Totals 67,626,837 149,007 -177,355 -0.3% 18.4% 20.2% $19.85 499,528 1,608,000 Birmingham/Bloomfield A 1,569,497 16,564 -8,411 -0.5% 26.9% 27.2% $29.52 0 0 Dearborn A 446,890 0 -1,150 -0.3% 1.0% 1.0% $24.00 150,000 0 Farmington/Farmington Hills A 618,109 1,453 36,885 6.0% 8.1% 8.1% $22.69 0 0 Macomb A 295,494 -2,022 -2,474 -0.8% 3.7% 3.7% $18.97 0 0 North Oakland A 541,905 1,071 54,842 10.1% 15.3% 15.3% $20.85 53,240 0 Northern I-275 Corridor A 1,113,719 4,279 -4,891 -0.4% 6.4% 7.3% $19.98 0 0 Royal Oak / SE Oakland A 76,288 0 76,288 100.0% 0.0% 0.0% $0.00 76,288 55,000 Southern I-275 Corridor A 832,753 0 -109,432 -13.1% 0.0% 30.1% $0.00 0 0 Southfield A 2,970,217 -9,987 -37,048 -1.2% 24.0% 27.0% $21.06 0 0 Troy A 1,924,131 31,181 50,769 2.6% 14.4% 18.2% $24.90 0 0 Washtenaw A 3,278,983 18,473 127,960 3.9% 8.7% 8.7% $29.05 60,000 30,000 Suburbs A 13,667,986 61,012 183,338 1.3% 14.0% 17.2% $24.64 339,528 235,000 CBD A 6,354,714 22,124 83,445 1.3% 8.9% 11.0% $23.78 160,000 1,523,000 Urban A 6,354,714 22,124 83,445 1.3% 8.9% 11.0% $23.78 160,000 1,523,000 Detroit A 20,022,700 83,136 266,783 1.3% 12.4% 15.2% $24.44 499,528 1,608,000 Birmingham/Bloomfield B 2,410,171 3,048 -19,585 -0.8% 13.5% 13.7% $24.08 0 0 Dearborn B 2,258,735 -2,714 84,863 3.8% 28.9% 29.1% $17.26 0 0 Downriver B 483,907 2,434 13,885 2.9% 36.8% 38.3% $12.82 0 0 Farmington/Farmington Hills B 4,040,407 -84,104 -163,329 -4.0% 18.8% 20.1% $17.82 0 0 Macomb B 991,381 53,094 91,823 9.3% 13.2% 13.2% $14.43 0 0 North Oakland B 1,718,983 39,249 52,988 3.1% 16.8% 16.9% $17.43 0 0 Northern I-275 Corridor B 3,353,972 69,739 14,987 0.4% 11.9% 13.9% $19.20 0 0 Royal Oak / SE Oakland B 706,710 11,106 324 0.0% 6.2% 6.3% $16.82 0 0 Southern I-275 Corridor B 244,772 1,948 1,300 0.5% 0.0% 0.0% $0.00 0 0 Southfield B 10,265,479 -34,692 -137,797 -1.3% 29.4% 31.3% $17.20 0 0 Troy B 9,078,931 18,552 -202,511 -2.2% 24.8% 26.8% $18.82 0 0 Washtenaw B 3,394,789 -22,735 -193,685 -5.7% 10.4% 13.4% $21.20 0 0 Suburbs B 38,948,237 54,925 -456,737 -1.2% 21.6% 23.2% $18.02 0 0 CBD B 7,122,495 -24,930 -10,763 -0.2% 18.3% 19.0% $20.53 0 0 New Center B 1,486,775 35,876 23,362 1.6% 18.1% 18.2% $19.22 0 0 Urban B 8,609,270 10,946 12,599 0.1% 18.3% 18.8% $20.08 0 0 Detroit B 47,557,507 65,871 -444,138 -0.9% 21.0% 22.4% $18.26 0 0