Chicago's office construction history...where are we now?
•
1 gefällt mir•321 views

The question has been coming up often these days about where office development stands in this cycle.
Melden
Teilen
Melden
Teilen
Downloaden Sie, um offline zu lesen
Empfohlen
Empfohlen
Weitere ähnliche Inhalte
Ähnlich wie Chicago's office construction history...where are we now?
Ähnlich wie Chicago's office construction history...where are we now? (10)
Minneapolis-St. Paul Chart of the Week | March 28, 2016
Minneapolis-St. Paul Chart of the Week | March 28, 2016
New Zealand Economic Update - Construction March 2015
New Zealand Economic Update - Construction March 2015
Further alterations to the London Plan and beyond: wider South East perspective
Further alterations to the London Plan and beyond: wider South East perspective
Mehr von Hailey Harrington
Mehr von Hailey Harrington (7)
Can the Chicago office vacancy predict a Cubs postseason appearance?
Can the Chicago office vacancy predict a Cubs postseason appearance?
JLL Downtown Chicago Office Market Update - Q3 2016
JLL Downtown Chicago Office Market Update - Q3 2016
Chicago's office buildings are casting a long shadow
Chicago's office buildings are casting a long shadow
Kürzlich hochgeladen
Kürzlich hochgeladen (20)
9990771857 Call Girls in Dwarka Sector 6 Delhi (Call Girls) Delhi
9990771857 Call Girls in Dwarka Sector 6 Delhi (Call Girls) Delhi
David Litt Foreclosure Specialist - Your Partner in Real Estate Success
David Litt Foreclosure Specialist - Your Partner in Real Estate Success
BPTP THE AMAARIO Luxury Project Invest Like Royalty in Sector 37D Gurgaon Dwa...
BPTP THE AMAARIO Luxury Project Invest Like Royalty in Sector 37D Gurgaon Dwa...
Bptp The Amaario Launch Luxury Project Sector 37D Gurgaon Dwarka Expressway...
Bptp The Amaario Launch Luxury Project Sector 37D Gurgaon Dwarka Expressway...
2k Shots ≽ 9205541914 ≼ Call Girls In Sainik Farm (Delhi)
2k Shots ≽ 9205541914 ≼ Call Girls In Sainik Farm (Delhi)
Kohinoor Teiko Hinjewadi Phase 2 Pune E-Brochure.pdf
Kohinoor Teiko Hinjewadi Phase 2 Pune E-Brochure.pdf
Enjoy Night ≽ 8448380779 ≼ Call Girls In Huda City Centre (Gurgaon)
Enjoy Night ≽ 8448380779 ≼ Call Girls In Huda City Centre (Gurgaon)
Retail Center For Sale - 1019 River St., Belleville, WI
Retail Center For Sale - 1019 River St., Belleville, WI
Cheap Rate ✨➥9711108085▻✨Call Girls In Malviya Nagar(Delhi)
Cheap Rate ✨➥9711108085▻✨Call Girls In Malviya Nagar(Delhi)
9990771857 Call Girls in Dwarka Sector 2 Delhi (Call Girls) Delhi
9990771857 Call Girls in Dwarka Sector 2 Delhi (Call Girls) Delhi
M3M The Line Brochure - Premium Investment Opportunity for Commercial Ventures
M3M The Line Brochure - Premium Investment Opportunity for Commercial Ventures
Greater Vancouver Realtors Statistics Package April 2024
Greater Vancouver Realtors Statistics Package April 2024
BDSM⚡Call Girls in Sector 57 Noida Escorts >༒8448380779 Escort Service
BDSM⚡Call Girls in Sector 57 Noida Escorts >༒8448380779 Escort Service
Chicago's office construction history...where are we now?
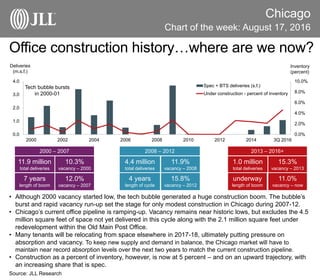
- 1. Chicago Chart of the week: August 17, 2016 Source: JLL Research Office construction history…where are we now? • Although 2000 vacancy started low, the tech bubble generated a huge construction boom. The bubble’s burst and rapid vacancy run-up set the stage for only modest construction in Chicago during 2007-12. • Chicago’s current office pipeline is ramping-up. Vacancy remains near historic lows, but excludes the 4.5 million square feet of space not yet delivered in this cycle along with the 2.1 million square feet under redevelopment within the Old Main Post Office. • Many tenants will be relocating from space elsewhere in 2017-18, ultimately putting pressure on absorption and vacancy. To keep new supply and demand in balance, the Chicago market will have to maintain near record absorption levels over the next two years to match the current construction pipeline. • Construction as a percent of inventory, however, is now at 5 percent – and on an upward trajectory, with an increasing share that is spec. 4.4 million total deliveries 4 years length of cycle 1.0 million total deliveries underway length of boom 11.9% vacancy – 2008 15.8% vacancy – 2012 15.3% vacancy – 2013 11.0% vacancy – now 2013 – 2016+2008 – 2012 11.9 million total deliveries 7 years length of boom 10.3% vacancy – 2000 12.0% vacancy – 2007 2000 – 2007 0.0% 2.0% 4.0% 6.0% 8.0% 10.0% 0.0 1.0 2.0 3.0 4.0 2000 2002 2004 2006 2008 2010 2012 2014 3Q 2016 Spec + BTS deliveries (s.f.) Under construction - percent of inventory Deliveries (m.s.f.) Inventory (percent) Tech bubble bursts in 2000-01