![recent years. Using this technology, the artificial intelligence is already trained to receive
a set of images (or urls pointing to these images) of different dresses and retrieve what
are the most similar dresses for each of the provided dresses.
Domain Background
Developing product recommendation based on image similarity is a hard challenge and
recently, with the advance of technology, this problem has been attacked with deep
learning, using very recent tools as Tensorflow and Keras (released in 2015) . For
example, just recently in 2015 a paper published by researchers at University of North
Carolina at Chapel Hill and Illinois at Urbana-Champaign used neural networks to
retrieve similar fashion images [1]. In 2016 a start-up, Thread Genius, used a similar
technology to retrieve similar fashion images [2].
Problem Statement
Inspired by the recent applications of deep learning in image similarity, the proposal for
this project is to develop a simple deep learning software that, given an image of a
dress listed by a retailer, similar listed dress images will be returned. Therefore, no
supervision to train this model is necessary, since the images itself are used,
characterizing the algorithm as an unsupervised learning algorithm. For this project
image similarity is be measured by the euclidian distance of the feature vector of the
two images being compared. In the context of the Brazilian market that is still young on
data science, a simple model would already be competitive with the current product
recommendation system presented by big ecommerce retailers.
Datasets and Inputs
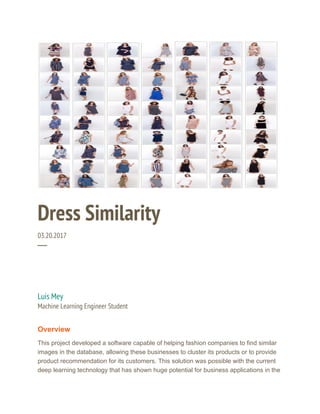
A realistic dataset from Brazilian retailers will be used. This dataset consists in about
10,000 scrapped page urls of dresses with product image, name and type, as described
by the retailer [3][4]. These images when loaded into memory consume about 17GB
and present different shapes, usually with a white or light grey background, highlighting
a colored dress that usually a model is wearing. This dataset size was enough to build a
simple image similarity software that other retailers could build without requiring
expensive processing power.
1](data:image/gif;base64,R0lGODlhAQABAIAAAAAAAP///yH5BAEAAAAALAAAAAABAAEAAAIBRAA7)
Empfohlen
Empfohlen
Weitere ähnliche Inhalte
Was ist angesagt?
Was ist angesagt? (20)
Andere mochten auch
Andere mochten auch (20)
Ähnlich wie Using Deep Learning to Find Similar Dresses
Ähnlich wie Using Deep Learning to Find Similar Dresses (20)
Kürzlich hochgeladen
Kürzlich hochgeladen (20)
Using Deep Learning to Find Similar Dresses
- 1. Dress Similarity 03.20.2017 ─ Luis Mey Machine Learning Engineer Student Overview This project developed a software capable of helping fashion companies to find similar images in the database, allowing these businesses to cluster its products or to provide product recommendation for its customers. This solution was possible with the current deep learning technology that has shown huge potential for business applications in the
- 2. recent years. Using this technology, the artificial intelligence is already trained to receive a set of images (or urls pointing to these images) of different dresses and retrieve what are the most similar dresses for each of the provided dresses. Domain Background Developing product recommendation based on image similarity is a hard challenge and recently, with the advance of technology, this problem has been attacked with deep learning, using very recent tools as Tensorflow and Keras (released in 2015) . For example, just recently in 2015 a paper published by researchers at University of North Carolina at Chapel Hill and Illinois at Urbana-Champaign used neural networks to retrieve similar fashion images [1]. In 2016 a start-up, Thread Genius, used a similar technology to retrieve similar fashion images [2]. Problem Statement Inspired by the recent applications of deep learning in image similarity, the proposal for this project is to develop a simple deep learning software that, given an image of a dress listed by a retailer, similar listed dress images will be returned. Therefore, no supervision to train this model is necessary, since the images itself are used, characterizing the algorithm as an unsupervised learning algorithm. For this project image similarity is be measured by the euclidian distance of the feature vector of the two images being compared. In the context of the Brazilian market that is still young on data science, a simple model would already be competitive with the current product recommendation system presented by big ecommerce retailers. Datasets and Inputs A realistic dataset from Brazilian retailers will be used. This dataset consists in about 10,000 scrapped page urls of dresses with product image, name and type, as described by the retailer [3][4]. These images when loaded into memory consume about 17GB and present different shapes, usually with a white or light grey background, highlighting a colored dress that usually a model is wearing. This dataset size was enough to build a simple image similarity software that other retailers could build without requiring expensive processing power. 1
- 3. Solution Statement A convolutional neural network was used to generate a feature vector for each image in the dataset. Each feature vector could be interpreted as a representation of the image in a dimension that is smaller than its pixel representation. In order to save computational effort, this convolutional neural network (CNN) took advantage of pretrained layers in the Inception V3 architecture made available by the deep learning library Keras. The resulting feature vectors were used in the similarity calculations, where the euclidean distance between the feature vectors represented image similarity. Benchmark Model and Evaluation Metric Since the similarity between two (or n) dresses has human subjectivity, the proposal for evaluation and benchmarking is to compare a sample of this project’s results with what a large ecommerce retailer suggests as similar products that the customer also would like to see. For example, the first dress below is the searched product, while the following four dresses are the ones recommended by the deep learning model and the last three are similarity recommendations from the ecommerce website used as benchmark. In order to create a numeric metric, it is possible to vote and assign 1 point if the reference image is similar with the recommendation, and zero otherwise. After evaluating 10 randomly sampled images, the performance of the model versus the benchmark could me measured as the number of samples considered similar divided by the total number of sampled images (10). Figure 1 - Dress similarity example. The first dress in the left is used as reference, while the remaining are recommended products due to similarity. 2
- 4. Project Design In summary, this project is designed to have 5 steps: 1. Load the images from retailers; Using the image urls available in the dataset, it is possible to use the skimage library to load all the images and store them in a variable. 2. Preprocess the images to fit into the CNN; Due to the shape of each image not matching the pre-trained network required input the images need to be reshaped and then stacked as vectors with a shape like (n_images, image_height, image_width, image_channel), where channel is 3 because the images are colored. 3. Build the CNN using a pre-trained network as a base model; It is possible to use Keras pre-trained Inception V3 model as a base model. This base model receives a (256,256,3) image as input and returns a flat vector. From this flat output vector it is possible to add additional layers, as an additional dense layer with 1024 nodes and a prediction layer with 2 nodes. 4. Generate the feature vectors; Having some simple information about the dresses, as if it is long or short, it is possible to train the layers below the base model, fine tuning these layers to provide information on the dresses. Then the output from the 1024 nodes base layer generated from each image can be used as a feature vector to represent the image. 5. Retrieve the n-closest images given a reference image. Finally, a distance metric can be used to calculate how different one feature vector is from the other feature vectors present in the database. This distance metric can be as simple as an euclidean distance that has a numpy implementation. Therefore, being able to calculate these distances allows anyone to just provide an image as input to the model that will calculate or retrieve the feature vector, calculate the minimal distance from other images and finally return n-closest images to the provided input. 3
- 5. Data Analysis During the data exploration it was possible to notice that the dataset required some preprocessing to assure data quality before feeding it to the model. The dataset presented some issues regarding dress labeling. For example, it was possible to notice that some dresses were used by the ecommerce both in the short section and in the long dress section. This type of event could harm the first step of model training that consisted in training the final layers of a CNN ir order to classify the dress as short or long, making the model learn about features of a dress. Due to this ambiguous classification, the problematic examples were removed from the training set. Additionally, the major source of data, with 11,662 examples, actually had repetitive records that were removed when detected in the data exploration. Moreover, it was possible to notice that image resolution was about 300x400 pixels, higher than the required shape to feed into the pretrained Inception V3 model. This shape mismatch required some image reshaping in the preprocessing phase. In possession of the preprocessed data, it was possible train the deep learning algorithm that basically consisted in feeding images of the long and short dresses into a pre trained neural network, illustrated by Figure 2, followed by additional dense layers. Each time that a batch of images were feeded into the network, each pixel was transformed through the network up to the last node where a prediction was made. Based on the known labels, short dress or long dress, the network calculated the prediction error and updated the weights of the dense layers. The weights of the dense layers kept multiplying the output of the long convolution neural network, getting closer to a better prediction after several iterations. After processing all the images 30 times (number of epochs), the output of the 1024 nodes dense layer was used as a feature vector that represents each image and, by calculating the euclidian distance between each image it was possible to predict which image was closer to another. 4
- 6. Figure 2 - Network used for training: schematic diagram of inception V3[5] that flows into dense layers specifically added for learning about the dresses. During the exploratory visualization it was also possible to see that most of the dresses only have a generic classification as long or short, as illustrated in the Figure 2 by the first two biggest bars. Even among the most common dress types, the short dresses are 5.7 times more representative in the dataset. The next most common dresses are the printed dresses and the flat dresses that together count about 1,000 examples. Further illustration is provided by Figure 3 that has one example for each of the five most common dress types. 5
- 7. Figure 4 - Unique dress type distribution. Figure 5 - Top 5 dress types (from left to right: short, long, printed, flat, night). Methodology Implementation The initial implementation was executed in the IPython Notebook named Model.ipynb. The notebook’s first section, named “Load and Preprocess Data” is responsible for the steps 1 and 2 previously described in the Project Design section. The process starts 6
- 8. from loading the data using the url list available in a csv file, followed by a image reshape to fit into the Inception V3 model and finally a train/test split required to train and test the model. Additionally to the Model.ipynb, the utils.py file was very helpful on organizing the necessary code to load and preprocess the images. Still on the Model.ipynb, the third step mentioned in the Project Design section was executed (and also the training process mentioned in the step 4). With the help of the model.py it was possible to train the data in an architecture that consists in an input layer that receives 256x256x3 vectors, feeds into a pretrained Inception V3 model, performs an average pooling and feeds to two dense layers, where the first has 1024 nodes and the section only 2 nodes that are activated with a softmax function. This first model only trained the layers below the Inception V3, predicting if a dress was short or long using a rmsprop optimizer and a categorical cross-entropy loss with an accuracy of 90% in the test set. The fourth step in the Project Design was executed through the Scores Images IPython Notebook. This notebook used the model.py file to create another model that, instead of returning a binary classification, returned the entire dense layer of 1024 nodes, representing the image feature vector. This feature vector model was used to score and save in batch every unique image in the major ecommerce dataset. This process of calculating the feature vectors and saving them in batch is important due to the fact that in the future new products could be added, and with a batch process only this new products would require feature vector calculation, and not the entire dataset again. The fifth step in the Project Design was executed with the IPython Notebook named Create Similarity Vector. This notebook used the feature vectors to calculate the distance between each image, ranking the 4 closest ones and generating a matrix named similarity matrix. With this similarity matrix, it is possible to know what are the 4 closest images for each of the images in that the retailer has. Regarding model refinements, it is important to say that the exploratory data analysis was critical to identify the fact that duplicated images were present in the database, what resulted in poor performance of the recommendation system that kept suggesting the same image instead of a similar image. Another refinement was an image augmentation that consisted in feeding not only the images, but also the flipped version of the images. This additional process actually decreased the model accuracy from 93% to 90% for predicting if a dress was long or short, but it is possible to argue that it is important to the model to learn about symmetry because a dress that is just a mirror image should be very similar to its original version. 7
- 9. Results The deep learning model was capable of providing suggestions for similar images given a reference image. In order to evaluate these results, 10 randomly sampled reference images were used. For each of the sampled images, similarity recommendation from the original retailer were extracted using an anonymous browser in order to prevent historical cookies to be used. For the same sampled images, the similarity matrix provided what would be the recommendation from a deep learning model. Organizing the results, it is possible to compare the results as presented below. Sample 1) It seems that both recommendations are short dresses, but the deep learning model found similar shades of red, while the ecommerce solution recommended dresses with exposed shoulders. Cumulative points using the proposed metric: 1 (model) vs. 1 (benchmark). 8
- 10. Sample 2) Considering this example, it seems that both recommendations does not make much sense. It could be a sign that there are no good similar products in the database. However, it could be argued that recommending other dresses is better than recommending boots and hair equipments. Cumulative points using the proposed metric: 1 (model) vs. 1 (benchmark). Sample 3) The deep learning recommendation seems to be similar to the reference image, with very colorful dresses, usually without sleeves and summer like. Having in mind the subjectivity of the comparison, it is possible to argue that the deep learning recommendation seems to be better than the ecommerce proposed solution for this example. Cumulative points using the proposed metric: 2 (model) vs. 1 (benchmark). 9
- 11. Sample 4) The deep learning model recommended what seems to be very similar dresses due to the similar color and size. Considering the ecommerce recommendation, it is possible to notice that probably the recommendation was based on the dress category/style “Sommer” that is common to the reference image. Cumulative points using the proposed metric: 3 (model) vs. 2 (benchmark). Sample 5) The deep learning recommendation appears to have a good suggestion here because of the patterns in the dresses. The ecommerce recommendation seems to make sense for the grey dress that has similar color to the reference image. Cumulative points using the proposed metric: 4 (model) vs. 3 (benchmark). 10
- 12. Sample 6) This example presents similar recommendation among the possible solutions due to the fact that both are showing long and formal like dresses. Cumulative points using the proposed metric: 5 (model) vs. 4 (benchmark). Sample 7) It seems that the deep learning recommendation provided neutral color options with complex patterns and somehow light look, similarly to the reference image. The ecommerce suggestions seems more aggressive on colors, but it is possible to say that the style is similar. Cumulative points using the proposed metric: 6 (model) vs. 5 (benchmark). 11
- 13. Sample 8) This sample is very interesting because it seems that the deep learning model suggested long dresses, as in the reference image, but also dresses that it is possible to see the feet or even the legs. In contrast, the ecommerce suggestion was short dresses. Cumulative points using the proposed metric: 7 (model) vs. 5 (benchmark). Sample 9) This is another example that the ecommerce probably could not provide similar images, but the deep learning model could recommend dresses that usually share a common feature of having stripes. Cumulative points using the proposed metric: 8 (model) vs. 5 (benchmark). 12
- 14. Sample 10) This last sampled example is another probable behavior that the ecommerce suggests similar dresses as similar model (“DF TOP MODA”). This behavior could be incorporated in the deep learning model, making it consider a description similarity as well when recommending dresses. Regarding the deep learning recommendation, it is hard to see similarity in the images, so it is a win for the ecommerce in this example, however the deep learning model finished the test as the winner. Cumulative points using the proposed metric: 8 (model) vs. 6 (benchmark). In summary, the evaluation resulted in 80% similarity versus 60% similarity according to the proposed similarity metric. This result provides some trust regarding the model performance and, given that little preprocessing was required, there is an indication that the model is robust to compete the with ecommerce benchmark. Conclusion This project successfully accomplished the goal of creating similarity model and a process to provide recommendations based on a given image. The final model is competitive and sometimes outperforms the benchmark and also has the advantage of do not requiring a historical user behavior to train the recommendation system. Additional examples from visualizing the final model brings excitement, corroborating with the great quality achieved by the model. 13
- 15. 14
- 16. However, the model still can face difficulties, mainly when there are few similar images in the database. It is extremely interesting that the feature vectors generated in the dense layer after the convolutional neural network were capable of finding similar images using a metric as simple as the euclidean distance. For future work, it would be interesting to use product description as well, capturing similar brands, season or category and extracting even more value from this exciting deep learning technology. References [1] M. H. Kiapour, X. Han, S. Lazebnik, A. C. Berg and T. L. Berg, “Where to Buy It: Matching Street Clothing Photos in Online Shops” (2015) [2] Thread Genius, “Robo Bill Cunningham: Shazam for Fashion With Deep Neural Networks” (2016) [3] https://www.dafiti.com.br/ [4] http://www.lojasrenner.com.br/ [5] Inception V3: https://research.googleblog.com/2016/03/train-your-own-image-classifier-with.html 15