
Empfohlen
Weitere ähnliche Inhalte
Was ist angesagt?
Was ist angesagt? (20)
Ähnlich wie Fluorescence spectroscopy
Ähnlich wie Fluorescence spectroscopy (20)
Mehr von Halavath Ramesh
Mehr von Halavath Ramesh (20)
Kürzlich hochgeladen
Kürzlich hochgeladen (20)
Fluorescence spectroscopy
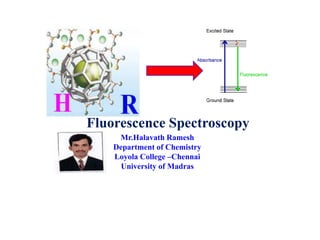
- 1. Fluorescence Spectroscopy Mr.Halavath Ramesh Department of Chemistry Loyola College –Chennai University of Madras
- 2. Objectives • 1.What is fluorescence spectroscopy ? • 2. Brief introduction about fluorescence spectroscopy • 3. Principle and theory of fluorescence spectroscopy • 4. Instrumentation • 5. Different types of data recorded by fluorescence spectroscopy a) Fluorescence Measurement b) Steady state fluorescence techniques c) Fluorescence anisotropy or Fluorescence polarization d) Luminescence quantum yield e) Ratio metric fluorescence f) Excitation Emission Matrix(EEM)
- 3. a) A-TEEM(Acquire absorbance transmittance and a fluorescence excitation emission matrix) b) Singlet oxygen measurement c) Fluorescence life time techniques d) Enzymatic reaction rate calculation e) Spectral measurents f) Quantitative measurement g) Fixed wavelength measurents h) Time course measurents i) 3-D spectra measurents j) Absorbance measurents k) Phosphors measurents 6) How to calculate signal to noise ratio 7) Factors affecting of fluorescence 7) Applications
- 4. 1. What is fluorescence spectroscopy ? Fluorescence Spectroscopy analyzes fluorescence from a molecules based on its fluorescent properties. Fluorescence is a type of luminescence caused by photons exciting a molecules raising it to an electronic excited state. 2. Brief introduction about the fluorescence spectroscopy Fluorescence is the absorption and emission of light of two different frequencies. Typically, a lower wavelength of incident light is absorbed from one direction, and a higher wavelength of light is emitted in all directions. Fluorescent molecules absorb light at a certain wavelength and emit at another.
- 5. With a known incident light wavelength, samples can be identified by their fluorescent emission spectra. Because fluorescence occurs on a molecular scale, it is the only spectroscopic technique capable of identifying single molecules. Molecules have various states referred to as energy levels. Fluorescence spectroscopy is primarily concerned with electronic and vibrational states. Generally, the species being examined has a ground electronic state (a low energy state) of interest, and an excited electronic state of higher energy. Within each of these electronic states there are various vibrational states
- 7. 3. Principle and theory of fluorescence spectroscopy In fluorescence, the species is first excited, by absorbing a photon, from its ground electronic state to one of the various vibrational states in the excited electronic state. Collisions with other molecules cause the excited molecule to lose vibrational energy until it reaches the lowest vibrational state from the excited electronic state. This process is often visualized with a Jablonski diagram. Fluorescence is the result of a three-stage process that occurs in certain molecules called fluorophores or fluorescent dyes. A fluorescent probe is a fluorophores designed to localize within a specific region of a biological specimen or to respond to a specific stimulus. The process responsible for the fluorescence of fluorescent probes and other fluorophores. Stage 1. Excitation. A photon of energy hvEX is supplied by an external source such as an incandescent lamp or a laser and absorbed by the fluorophores, creating an -
- 8. Excited electronic singlet state ( S1’) .This process distinguishes fluorescence from chemiluminescence, in which the excited state is populated by a chemical reaction. Stage 2. Excited-State Lifetime. The excited state exists for a finite time ( typically 1-10 nanosecond) .During this time, the fluorophores undergoes conformational changes and is also subject to a multitude of possible interactions with its molecular environment. These processes have two important consequences. First, the energy of S1’ is partially dissipated, yielding a relaxed singlet excited state(s1) from which fluorescence emission originates. Second, not all the molecules initially excited by absorption (stage 1) return to the ground state (so) by fluorescence emission. Other processes such as collision quenching, Fluorescence Resonance Energy Transfer(FRET) and intersystem crossing may also depopulated S1.The fluorescence quantum yield, which is the ratio of the number of fluorescence photons emitted (stage 3) to the number of photons absorbed (stage1), is a measure of the relative extent to which these processes occur.
- 9. Stage 3. Fluorescence Emission. A photon of energy hvEM is emitted , returning the fluorophores to its ground state S0. Due to energy dissipation during the excited-state lifetime, the energy of this photon is lower, and therefore of longer wavelength, than the excitation photon hvEX.The difference in energy or wavelength represented by (hvEx-hvEM) is called the stokes shift.
- 11. The stokes shift is fundamental to the sensitivity of fluorescence techniques because it allows emission photons to be detected against a low background isolated from excitation photons. In contrast absorption spectrometry requires measurement of transmitted light relative to high incident light levels at the same wavelength. Fluorescence spectra: The entire fluorescence process is cyclical. Unless the fluorophores is irreversibly destroyed in the excited state( an important phenomenon known as photo bleaching), the same fluorophores can be repeatedly excited and detected. The fact that a single fluorophores can generate many thousands of detectable photons is fundamental to the high sensitivity of fluorescence detection techniques. Instrumentation: Four essential elements of fluorescence detection system can be identified from the preceding discussion: 1. An excitation sources 2. A fluorophores 3. Wavelength filter to isolate emission photons from excitation photons and 4. a detector that registers emission photons and produces a recordable output.
- 13. 5. Different types of data recorded by fluorescence spectroscopy. a) Fluorescence Measurement : 5 different types. Luminescence, emission, excitation, synchronous and single beam. Most molecules occupy the lowest energy state at room temperature, known as the ground state. Within this ground state are vibrational levels. Before becoming excited, many molecules occupy the lowest vibrational level. The absorbed photon causes the molecule to adopt a higher vibrational energy state when a molecule absorbs a certain wavelength of light. The molecules then collide with other molecules, causing it to lose its vibrational energy and return to the lowest vibrational level of the excited state. The molecule can then return to the ground state vibrational levels. When the molecule returns to the ground state, it emits a photon of light at a wavelength different to the wavelength that excited it. This is when the molecule exhibits fluorescence.
- 14. Fluorescence is measurable by fluorometers. A fluorometers is an instrument designed to measure the various parameters of fluorescence, including its intensity and wavelength distribution of the emission after excitation. Chemists use this to identify properties and the amount of specific molecules in a sample. Most molecules occupy the lowest energy state at room temperature, known as the ground state. Within this ground state are vibrational levels. Before becoming excited, many molecules occupy the lowest vibrational level. The absorbed photon causes the molecule to adopt a higher vibrational energy state when a molecule absorbs a certain wavelength of light. The molecules then collide with other molecules, causing it to lose its vibrational energy and return to the lowest vibrational level of the excited state. The molecule can then return to the ground state vibrational levels. When the molecule returns to the ground state, it emits a photon of light at a wavelength different to the wavelength that excited it. This is when the molecule exhibits fluorescence. Fluorescence is measurable by fluorometers. A fluorometers is an instrument designed to measure the various parameters of fluorescence, including its intensity and wavelength distribution of the emission after excitation. Chemists use this to identify properties and the amount of specific molecules in a sample.
- 15. b) Steady state fluorescence techniques Because fluorescence intensity depends on the concentration of the fluorescent molecule, standard concentration curves can be generated easily and used to determine concentrations of the same molecule in unknown samples. This is useful in quenching experiments, where additives decrease the intensity of the fluorophores in a systematic way. Concentration curves can also be created to study how other molecules interact with things like proteins, and can be used for tracking protein structural changes, folding, unfolding, association and dissociation systematically.
- 18. C). Fluorescence anisotropy or Fluorescence polarization Fluorescence anisotropy or fluorescence polarization is a measurement of the changing orientation of a molecule in space, with respect to the time between the absorption and emission events. Absorption and emission indicate the spatial alignment of the molecule’s dipoles relative to the electric vector of the electromagnetic wave of excitation and emitted light, respectively. In other words, if the fluorophores population is excited with vertically polarized light, the emitted light will retain some of that polarization based on how fast it is rotating in solution. The faster the orientation motion, the more depolarized the emitted light will be. The slower the motion, the more the emitted light retains the polarization. Fluorescence anisotropy the light emitted by chromospheres by light unequal intensity different access of polarization. Considering partially polarized light travelling across x- axis's the intensity Iz and Iy can be measured by a detector and polarizer positioned on x- axis. For polarization measurement, polarizer are inserted into the excitation and emission light paths. With the excitation polarizer fixed, the emission polarizater can be rotated to measure the perpendicular (I) and parallel (I)components of the fluorescence emission.
- 21. d) Luminescence quantum yield Any process that brings about a decrease in the sample emission is referred to as fluorescence quenching . For proteins the type of quenching we will be primarily concerned with is that arising from collision between the quencher and the fluorophores. The fluorescence quantum yield (φ) is the ratio of the number of photons emitted to the number absorbed. The fluorescence intensity (F) is proportional to the amount of light absorbed.
- 23. e) Ratio metric fluorescence: Ratiometric fluorescence is the method where intensities at two or more wavelengths of an excitation or emission spectrum are measured to detect changes to local environment. Typically, a probe is used that is specifically sensitive to an environmental parameter such as ion concentration, pH, viscosity, or polarity. The application of ratiometric dyes for finding probe-sensitive properties such as ion concentration can be used by measuring spectra or kinetics.
- 24. Excitation Emission Matrix(EEM): A measurement becoming more widely used in the field of fluorescence spectroscopy is the excitation emission matrix, or EEM. An EEM is a 3D scan, resulting in a contour plot of excitation wavelength vs. emission wavelength vs. fluorescence intensity. EEMs are used for a variety of applications where multi-component analysis is required and are often referred to as providing a molecular fingerprint for many different types of samples. Some of the first published uses of EEM spectroscopy were in the 1980’s where the technique was used to study tryptophan fluorescence in low density lipoproteins in human blood serum (Koller, 1986) and to investigate fluorescent components in human plasma from tumor patients (Leiner, 1986)
- 26. A-TEEM(Acquire absorbance transmittance and a fluorescence excitation emission matrix) A-TEEM spectroscopy refers to the ability to simultaneously acquire Absorbance, Transmittance and a fluorescence Excitation Emission Matrix (A-TEEM) of a particular sample. HORIBA pioneered this technique with the patented Aqualog and Duetta system, which combines A-TEEM spectroscopy with simultaneous multichannel CCD detection to provide extremely fast results. A-TEEM spectrometers can be used for fluorescence EEMs or for absorbance measurements for multi-component analysis, but its real power is derived from the fact that the EEMs collected by the instrument are corrected for inner filter effect. This means they are true and accurate representations of the molecules of interest over a much broader and more useable concentration range (typically up to ~2 absorbance units). Therefore, these EEMs allow for much more precise fingerprinting than is possible with an EEM collected from a traditional scanning fluorometers.
- 28. Singlet oxygen measurement Singlet oxygen is produced from a photosensitizer molecule reacting with ground state oxygen. Molecular triplet states are chemically reactive due to their long decay times and the presence of unpaired valence electrons. Reactivity with ground state oxygen (3O2) will yield singlet oxygen (1O2). Singlet oxygen has an emission spectrum peak around 1270 nm, which results in photons emitted from a triplet state (phosphorescence). The lifetime of singlet oxygen is very long, but quenched when singlet oxygen reacts or comes in contact with different species. Instruments used to detect singlet oxygen typically need near-infrared detectors such as InGaAs detectors (PMT, Analog, or Arrays) and emission gratings that are blazed for efficiency in the NIR wavelength region.
- 29. The production of singlet oxygen involves the irradiation of a photosensitizer molecule in the presence of oxygen and subsequent reaction of the excited triplet state photosensitizer with the ground state oxygen resulting in the creation of excited singlet state oxygen. These include molecules such as Rose Bengal, transition metal complexes (as shown below), porphyrins, fluorescein, and others. (DeRosa, 2002) Exciting these molecules at their peak absorbance wavelengths can lead to the reactivity of these molecules in the excited state with ground state oxygen, producing singlet oxygen. Mechanisms that produce singlet oxygen are important to photodynamic therapeutics, anti-cancer agents and other skin treatments. The reactivity of singlet oxygen itself can be damaging to organic molecules, including those in biological systems, but the reactivity, if controlled is also a potential method of cancer therapy and photodynamic medicine. In photodynamic therapy, a patient with malignant cancer has a fiber optic light either inserted into, or placed just outside their body. This light emits visible wavelengths. It reacts with photosensitizer molecules (photodynamic drugs), provides energy to oxygen in the microenvironment, which, in turn, generates non-toxic singlet oxygen species to shrink or kill the tumor.
- 30. Singlet oxygen species are chemically reactive chemical varieties containing oxygen. Also known as light therapy, photodynamic therapy is a treatment for cancers that are near the surface of a body’s tissue, where the light can act on the chemical substances. It is not like radiation therapy, which uses radicals and a toxic light source. Nor does it cause systematic side effects like chemotherapy. The light and molecules photodynamic therapy uses are non-toxic and benign.
- 31. Fluorescence Lifetime Techniques 1. What is Time Correlated Single Photon Counting or TCSPC? TCSPC stands for time-correlated single photon counting. It is a method of using the timing of a pulsed excitation source, like a laser or LED, with the timing of the arrival of single photons on a detector to reconstruct the lifetime decay over many events (repetition of pulses and photons detected). This technique is based on the fact that the probability of detecting a single photon at time, t after an exciting pulse is proportional to the fluorescence intensity at time t.
- 32. Can I measure kinetic processes with fluorescence lifetimes? Using the kinetic TCSPC mode, individual measurements in as little as 1 ms can be made and up to 10,000 measurements can be seamlessly acquired. As long as a fluorescence lifetime change occurs, then this approach, rather than intensity, can be used to follow a kinetic process. Obviously, a sufficient number of photons are needed to be able to analyze the data. This can be enhanced by using a very high repetition rate, but the lifetime and time range needs to be considered, so as not to re-excite the sample before it has completely decayed. The lifetime data can then be used to construct kinetic traces for the process.