1. Protein Crystallography of Lysozyme
Anil Chaturvedi, Ashley Davalos, Carlos Hernandez, Guillermo Llamas, Mabel Wong
Department of Chemistry and Biochemistry, University of California Santa Barbara
Santa Barbara, CA 93106
Introduction
➢Lysozyme is a catalytic enzyme that is known to hydrolyze the β-(1à 4)
glycosidic linkages from the N-acetylmuramic (NAM) to N-
acetylglucosamine (NAG) in the cell wall peptidoglycans of bacterial cell
walls.
➢Crystallography and x-ray diffraction are valuable techniques for determining
the structure of proteins such as lysozyme. They are capable of revealing the
geometry of substrate binding, and active site residues that may be crucial to
the catalytic mechanism.
➢Viable x-ray diffraction data requires large singular crystals that are often
difficult to obtain. Successful crystallization is a trivial process that requires
experimentation with many different precipitating conditions. The conditions
can vary by precipitating agents, temperature, purity, pH, and concentrations.
➢From the x-ray diffraction pattern the unit cell dimensions, angles and
symmetry can be measured by using the program HKL view.
➢The reflection data collected can be converted into an electron density map
through the use of Fourier summations and other associated calculations.
Amino acids can be fitted into the electron density map and this can be used
for conformational analysis of peptides and proteins using Coot.
Methods
Results
Crystallization Diffraction
Electron Density
Conclusion
References
Acknowledgements
We would like to acknowledge Dr. Kalju Kahn for the
guidance, valuable discussions, as well as the use of the
Bioanalytical Lab and the X-Ray Analytical Facility in the
Chemistry and Biochemistry Department at UCSB. We
would also like to extend our gratitude to Kota Kaneshige
and Istvan Szabo for providing extra guidance during this
project.
Precipitating
agent
Y2 Y1 X2 X1
Concentration
2 mg/mL Nothing Nothing Nothing Nothing
10 mg/mL Big
shards
Big
shards
Small
hexagonal
cubic
Medium
hexagonal
cubic
15 mg/mL Medium
shards
Medium
shards
Medium
hexagonal
cubic
Biggest
hexagonal
cubic
30 mg/mL Small
shards
Few small
shards
Big
hexagonal
cubic
Medium
hexagonal
cubic
60 mg/mL Micro-
crystals:
Shards
Few small
shards
Micro-
crystals
Micro-
crystals
100 mg/mL Micro-
crystals:
Shards
Micro-
crystals:
Shards
Micro-
crystals
Micro-
crystals
Axis Point-to-point distance
(a, b, c)
h-axis a = 129.8 Ǻ
k-axis b = 129.8 Ǻ
l-axis c = 91.4 Ǻ
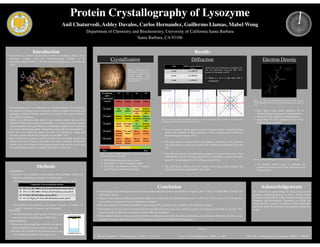
Figure 1: The image on the
left displays the result of
the most successful crystal
growth condition using
precipitating agent X1 and
buffer solution X.
Table 1: Relates the trends juxtaposing the varying concentrations
of lysozyme and precipitant agents.
➢ PEG 8000 produced the best crystals.
➢ Precipitants Y1 and Y2 produced shards.
➢ Lysozyme concentrations between 15 mg/mL
and 30 mg/mL produced best results.
➢By the hanging drop method the most successful crystals formed at a protein concentration 15 mg/mL, pH 4.5, 30% (w/v) PEG 8000, 1 M NaCl, 50
mM sodium acetate.
➢Analysis of the lysozyme diffraction pattern by HKL view revealed the unit cell dimensions to be a= 129.8 Å, b= 129.8 Å, and c= 91.4 Å, and that
the crystals are tetragonal by these crystallization conditions.
➢The same program was used to determine the space group as P43212 based on the symmetry of the diffraction pattern.
➢The program Coot was used to fit amino acids into the electron density map of an α-helical segment of a protein and elucidate its structure. This
process can also be done for lysozyme but involves difficult calculations.
➢These methods outline a basic protocol for protein crystallography, but there are other considerations and techniques that better elucidate crystal
structures. The three-dimensional structures of proteins are useful for structure-based drug design.
Poor Best
Table 2: The unit cell dimensions tabulated on the
left were determined using the HKL View
program. All the angles were 90̊ .
➢ Since a = b ≠ c, the unit cell is
tetragonal.
Figure 2: The three diffraction patterns displayed as pseudo-precession-stills of zones of reciprocal space
show the symmetries with respect to h, k, and l axes.
➢ From our analysis, the lysozyme unit cell is characterized by a tetragonal lattice
system with variations in either a primitive or body centering and is defined by
the following space group: P43212.
➢ The space group is characterized by the apparent symmetries in the reflection
data with respect to each axes caused by the rotation and translation of the unit
cell.
➢ Unit cells are specific to crystallization conditions. Lysozyme is known to form
orthorhombic crystals with space group P21212, monoclinic crystals with space
group P21, and tetragonal crystals with space group P43212.
➢ The point group, which is the first number in the space group, indicates the
rotational symmetry perpetuated by the crystal.
Figure 3: The three-dimensional positions of the segment
YSVLFDMARE was fitted using three auto-fitting algorithms in
Coot.
➢ Real Space refine Zone: optimizes fit of
electron density and preserves stereochemistry
➢ Regularize Zone: optimizes stereochemistry
➢ Rigid Body Fit Zone: optimizes the fit of the
model to electron density
Figure 4: Electron density map for the given peptide sequence.
➢ An electron density map is generated by
performing Fourier series of the intensities of the
reflection data.
Composition of the precipitating solutions
X1 30% (w/v) PEG 8000, 1 M NaCl, 50 mM Sodium acetate, pH 4.5
X2 37% (w/v) PEG 8000, 1 M NaCl, 50 mM Sodium acetate, pH 4.5
Y1 8% NaCl, 100 mM Sodium acetate, pH 4.8
Y2 2% (w/v) MgCl2, 8% NaCl, 100 mM Sodium acetate, pH 4.8
1. Bhat, R. Timasheff, S. N. Protein Science. (1992); 1: 1133-1143. 2. Yao, Y et al. CrystEngComm. (2008); 10: 166-9. 3. Hu, Z. W. et al. Biological Crystallography. (2001); 57: 840-846.
1. Crystallization
➢Lysozyme was crystallized using hanging drop technique under four
different crystallization conditions on a Linbro plate.
▪ Precipitating agent X1, X2, Y1, Y2 and buffer solutions X and Y
▪ Six different concentrations of lysozyme: 2 mg/mL, 10 mg/mL, 15
mg/mL, 30 mg/mL, 60 mg/mL, and 100 mg/mL
2. Diffraction
➢Unit cell dimensions, space group, and point group
were determined using Measure in HKL View.
3. Electron Density
➢Three auto-fitting algorithms in Coot were used to
generate different positions of each amino acid.
➢Residues that visually fit the electron density map
were verified using Density Fit Analysis tool.