
Empfohlen
Weitere ähnliche Inhalte
Kürzlich hochgeladen
Kürzlich hochgeladen (20)
Empfohlen
Empfohlen (20)
US Office Leasing Marketview
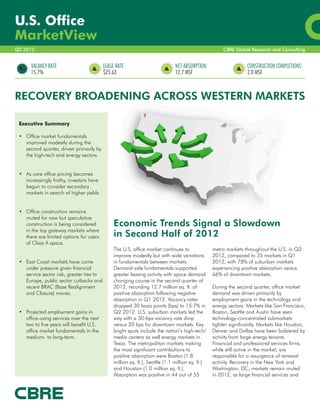
- 1. U.S. Office MarketView Q2 2012 CBRE Global Research and Consulting VACANCY RATE LEASE RATE NET ABSORPTION CONSTRUCTION COMPLETIONS 15.7% $25.63 12.7 MSF 2.0 MSF RECOVERY BROADENING ACROSS WESTERN MARKETS Executive Summary • Office market fundamentals improved modestly during the second quarter, driven primarily by the high-tech and energy sectors. • As core office pricing becomes increasingly frothy, investors have begun to consider secondary markets in search of higher yields. • Office construction remains muted for now but speculative construction is being considered Economic Trends Signal a Slowdown in the top gateway markets where there are limited options for users in Second Half of 2012 of Class A space. The U.S. office market continues to metro markets throughout the U.S. in Q2 improve modestly but with wide variations 2012, compared to 35 markets in Q1 • East Coast markets have come in fundamentals between markets. 2012, with 78% of suburban markets under pressure given financial Demand-side fundamentals supported experiencing positive absorption versus service sector risk, greater ties to greater leasing activity with space demand 66% of downtown markets. Europe, public sector cutbacks and changing course in the second quarter of recent BRAC (Base Realignment 2012, recording 12.7 million sq. ft. of During the second quarter, office market and Closure) moves. positive absorption following negative demand was driven primarily by absorption in Q1 2012. Vacancy rates employment gains in the technology and dropped 30 basis points (bps) to 15.7% in energy sectors. Markets like San Francisco, • Projected employment gains in Q2 2012. U.S. suburban markets led the Boston, Seattle and Austin have seen office-using services over the next way with a 30-bps vacancy rate drop technology-concentrated submarkets two to five years will benefit U.S. versus 20 bps for downtown markets. Key tighten significantly. Markets like Houston, office market fundamentals in the bright spots include the nation’s high-tech/ Denver and Dallas have been bolstered by medium- to long-term. media centers as well energy markets in activity from large energy tenants. Texas. The metropolitan markets making Financial and professional services firms, the most significant contributions to while still active in the market, are positive absorption were Boston (1.8 responsible for a resurgence of renewal million sq. ft.), Seattle (1.1 million sq. ft.) activity. Recovery in the New York and and Houston (1.0 million sq. ft.). Washington, DC, markets remain muted Absorption was positive in 44 out of 55 in 2012, as large financial services and
- 2. Q2 2012 professional services firms respond to has been a real positive for Boston and efficiencies. This is great news for budget current economic conditions and public the Midtown South market in Manhattan, deficits at the federal, state, and local sector woes. east coast markets in particular have level but hard on office landlords. The been negatively impacted by financial downsizing across the legal sector Recovery in the western and southern services sector risk, ties to the eurozone continues to provide another major U.S. Office | MarketView U.S. office markets outpaced the east, as and government cutbacks. Markets with headwind to office markets located in markets like Seattle, Austin, Miami and high exposure to the federal and state the major coastal gateway markets. Orlando experienced the largest governments are under pressure. The Major law firms continue to consolidate decreases in vacancy during Q2 2012. contraction in the public sector is office space as they try to lower real While activity from the technology sector leading to greater office space estate and other expenses. OFFICE LEASING MOMENTUM TO MODERATE IN THE SHORT RUN The recent deceleration of U.S. and global economic activity may spell trouble for the U.S. office market over the near term. Despite modest improvement in office demand during the past quarter, the latest sign of economic weakness may lead to a loss in leasing momentum over the next couple of quarters. Recent economic data suggests a deceleration in the labor markets, consumer spending, and business investment. Given the global headwinds, including the eurozone crisis and the slowdown in Chinese growth, the U.S. economy seems unable to shift into higher gear. The retrenchment at state and local governments has also prevented a faster U.S. economic rebound. On top of these restraints, the looming “fiscal cliff” in the U.S. in 2013 is adding another layer of uncertainty. As such, economic growth has been downwardly revised in both 2012 and 2013, as reflected in Figure 1. Figure 1: U.S. Economy Downshifts Annual Percent Change (%) 4.0 Forecast 3.5 3.0 2.5 2.0 1.5 1.0 0.5 0.0 2010Q1 2010Q2 2010Q3 2010Q4 2011Q1 2011Q2 2011Q3 2011Q4 2012Q1 2012Q2 2012Q3 2012Q4 2013Q1 2010Q2 2010Q3 2013Q4 2 Consumer Spending Real GDP Source: IHS Global Insight, Interim Forecast, July 2012
- 3. Q2 2012 U.S. Office | MarketView If these risks, Europe and fiscal cliff, are repairing the excesses of the credit and link between the U.S. economy and averted, the U.S. economy should be housing bubbles of past years. Home demand for office space. Job gains have able to weather the current soft patch prices are in better alignment with disappointed recently, averaging a paltry and gain traction later this year and in underlying household income 75,000 a month for the second quarter. 2013. There are a number of reasons fundamentals. Households have also Expectations are for job gains to remain that render us more optimistic about the lowered their debt levels while benefiting muted through year-end 2012 given longer-term trajectory of U.S. economic from a recovery in equity values. election-year uncertainty, but to improve growth. Financial conditions are easing in 2013. The office-using employment given low interest rates and the Non-financial corporate balance sheets sectors will outperform the overall labor increased willingness of banks to lend. are pristine, with firms sitting on record market. The secular shift in the U.S. Lower energy prices should also be a amounts of cash. As the economy gains economy to professional services should windfall for U.S. consumers. But the most traction, hiring among businesses should continue to benefit office-occupations important factor driving our belief that pick up, provided that the U.S. does not over the next two and five years the U.S. economy will improve is the go off the fiscal cliff and Europe does (Figure 3). progress that has been made in not implode. The labor market is the key Figure 2: U.S. Labor Market Performance: Net Gains Figure 3: Office Employment On Recovery Path Jobs (Thousands, Seasonally Adjusted) Annual Percent Change (%) 1,500 4% Forecast 1,000 3% 500 2% 0 500 1% 1,000 0% 1,500 -1% 2,000 2,500 -2% 2-Year History 2-Year Forecast 5-Year History 5-Year Forecast 2007Q1 2007Q3 2008Q1 2008Q3 2009Q1 2009Q3 2010Q1 2010Q3 2011Q1 2011Q3 2012Q1 2012Q3 2013Q1 2013Q3 2014Q1 2014Q3 2015Q1 2015Q3 Total Employment Office-Using FIRE Office-Using Services Source: Moody’s Analytics Source: CBRE Econometric Advisors 3
- 4. OFFICE CONSTRUCTION BEING CONTEMPLATED IN A HANDFUL OF MARKETS Q2 2012 Among office users, there is a notable flight to quality across major markets. Class A vacancy rates have been tightening at a fast clip, as office tenants relocate from Class B properties. The lack of new supply is leading to shortages of larger contiguous office space. Office landlords have begun to pull back on concessions, signaling the first stage of market tightening. As effective office rents rebound, there is some anecdotal evidence of speculative construction being contemplated in several markets, but this supply trend is not yet widespread. U.S. Office | MarketView Figure 4: U.S. Downtown Supply and Demand Completions and Absorption (MSF) Vacancy Rate (%) 10 14% 8 13% 6 4 12% 2 11% 0 -2 10% -4 9% -6 8% -8 -10 7% 2007Q2 2007Q3 2007Q4 2008Q1 2008Q2 2008Q3 2008Q4 2009Q1 2009Q2 2009Q3 2009Q4 2010Q1 2010Q2 2010Q3 2010Q4 2011Q1 2011Q2 2011Q3 2011Q4 2012Q1 2012Q2 Completions (L) Absorption (L) Vacancy Rate (R) Source: CBRE Econometric Advisors Figure 5: U.S. Suburban Supply and Demand Completions and Absorption (MSF) Vacancy Rate (%) 25 19% 18% 20 17% 15 16% 15% 10 14% 5 13% 12% 0 11% -5 10% 9% -10 8% 4 -15 7% 2007Q2 2007Q3 2007Q4 2008Q1 2008Q2 2008Q3 2008Q4 2009Q1 2009Q2 2009Q3 2009Q4 2010Q1 2010Q2 2010Q3 2010Q4 2011Q1 2011Q2 2011Q3 2011Q4 2012Q1 2012Q2 Completions (L) Absorption (L) Vacancy Rate (R) Source: CBRE Econometric Advisors
- 5. Q2 2012 Office construction activity in the U.S. is contributing the majority during Q2 strong rental rate growth and occupancy expected to remain at relatively low 2012. As Class A vacancy rates continue have reinvigorated the construction levels through 2014, with 2012 to decline across several U.S. markets pipeline, a 279,000-sq.-ft. speculative deliveries consistent with 2011. The and large blocks become harder to find new development project broke ground metro Washington, DC, office market in desirable submarkets, construction during Q2 2012. Additionally, in the U.S. Office | MarketView contributed the largest amount of new activity is poised to increase. Chicago CBD, a new speculative construction during Q2 2012, with 1 development project, River North, was million sq. ft. delivered, 68% of it In Houston, for example, there is only announced during the past quarter. preleased. Speculative construction was one available Class A block of space more prevalent in western markets, with over 150,000 sq. ft. in the desirable San Jose, Seattle and Inland Empire Energy Corridor. In San Francisco, where OFFICE CAPITAL MARKETS: BID-ASK SPREADS WIDENING In light of overall global market volatility core-plus offerings. While trophy assets Pricing remains strong but bid depth is in the broader equity and fixed income and high quality value-add offerings are not as deep as it had been earlier in the markets and resurgence of risk-aversion, receiving robust bidding from a deep year. By comparison, trophy assets were office investment volumes slowed in May pool of investors, good quality, stabilized receiving six to eight strong bids in Q1 to $4.1 billion, a 31% decline from a assets cannot seem to find a reception. 2012, compared to four to six bids in year ago. The decline is arguably due to This remains the best risk-return Q2 2012. Despite the reduction, this several large, unique transactions in opportunity in the market. Another factor scenario is far better than 2010 and 2011 rather than problems in 2012. impacting the market was a momentary 2011. Average office cap rates continue Year-to-date, office transaction volume pullback in debt pricing and availability, to decline for both downtown and totaled a healthier $23 billion. Investor especially for less-than-trophy assets. suburban office assets. Primary markets enthusiasm is undergoing the now- The result was a reversal of what had command premier pricing as investors familiar summer antipathy, but trophy been month-over-month increases in focus on the best assets. In the primary and value-add assets in primary markets achieved sale prices. Sellers have coastal markets, core pricing is a bit continue to garner the most interest from demonstrated a discipline of holding frothy as cap rates are back to pre- both domestic and cross-border onto their assets if they cannot achieve recession levels, in part fueled by the institutional investors. The biggest factor desired pricing, another factor behind historically low cost of capital. Investors facing the market is the complete slower office transaction volumes. have begun expanding their search for indifference capital is showing towards value-add office assets in both primary and secondary markets, in search of Figure 6: Office Market Transaction Volume and Pricing higher yields. Underwriting remains fairly disciplined for value-add assets in the weaker markets, however. Office Transaction Volume ($ Billions) Cap Rates (%) $12 7.7% Office return performance has recently 7.6% come under pressure. Based on the $10 7.5% NCREIF Property Index (NPI), office $8 7.4% returns fell for a third consecutive 7.3% quarter in Q1 2012 to 2.34% for the $6 7.2% quarter, and 13.41% on an annual 7.1% basis. Office returns now trail that of $4 7.0% both multi-housing and industrial 6.9% performance. A deceleration in office $2 value gains is the primary factor 6.8% 5 lowering office NPI returns. Going $0 6.7% forward, office return performance will Jan Feb Mar Apr May Jun Jul Aug Sep Oct Nov Dec Jan Feb Mar Apr May on average be more a function of 2011 2012 underlying net operating income growth (NOI) than cap rate compression. Office Transactions (L) Average Cap Rates (R) Source: Real Capital Analytics
- 6. THE REGIONAL Q2 2012 Q2 2012 Figure 7: 25 Largest Office Markets - Q2 2012 OFFICE MARKETS IN PERSPECTIVE U.S. Office | MarketView U.S. Office | MarketView Regional office market dynamics vary considerably, driven by the relative SEATTLE performance of industry sectors. The 97,227 SF high-tech and energy markets continue 15.9% to drive greater office space demand. By $28.37 DETROIT contrast, consolidation in financial 74,631 SF BOSTON services, government sector cuts, and 26.7% 181,755 SF BRAC moves weigh on a number of CHICAGO $17.48 14.2% regional office markets. MINNEAPOLIS/ $26.60 ST. PAUL 239,216 SF 66,999 SF 18.3% PITTSBURGH Other trends that warrant observation $26.48 MANHATTAN 18.8% 80,038 SF are heightened demand for Class B SAN 10.5% 389,070 SF space driven by technology tenants and FRANCISCO SACRAMENTO $22.36 $18.82 7.7% an accelerated pace of recovery in 115,154 SF 52,925 SF $59.48 KANSAS suburban and secondary markets 10.4% 23.5% CITY NEW JERSEY throughout the U.S. The cautious posture $44.82 $20.52 52,753 SF 157,580 SF of traditional professional services firms DENVER 17.9% 16.6% SAN JOSE WASHINGTON, DC* has resulted in increased renewal activity 107,654 SF $16.71 $24.74 53,679 SF 383,924 SF with an eye toward space utilization in 14.8% PHILADELPHIA 13.7% 13.5% many primary markets. Back office $20.00 103,255 SF $30.20 ST. LOUIS $34.80 cost-saving and on-shoring strategies 18.6% 49,024 SF will benefit secondary markets. Increased LOS $25.06 ANGELES 17.4% demand from less traditional or start-up $17.95 BALTIMORE 196,543 SF technology and media firms has had an ORANGE 64,418 SF 16.8% PHOENIX MARKET impact on Class B vacancy and average COUNTY 16.5% $30.37 80,615 SF ATLANTA asking rates. The suburban office 99,854 SF $21.59 NRA (SF x 1000) SAN DIEGO 25.1% DALLAS/ 133,316 SF markets of Austin, San Jose, Cambridge, 14.2% $20.41 FT. WORTH VACANCY RATE 66,112 SF 23.0% Salt Lake City and Orlando top the list $23.04 226,204 SF GROSS ASKING RENT 16.2% $19.85 for year-over-year decreases in suburban 19.7% market vacancy. Austin’s suburban $25.32 $17.92 vacancy rate has decreased by more than 6%—the largest year-over-year HOUSTON decrease in the U.S. 190,675 SF 45,000,000 SF TAMPA 13.9% 45,684 SF $23.31 400,000,000 SF 19.5% NATIONAL QUICK STATS $19.64 Q2 2012 Current QoQ YoY Vacancy Rate 15.7% i i Lease Rate $25.63 h h Net Absorption* 12.7 MSF h h Source: CBRE Research 6 Information contained herein, including projections, has been obtained from sources believed to be reliable. While we do not doubt its accuracy, we 7 have not verified it and make no guarantee, warranty or representation about it. It is your responsibility to confirm independently its accuracy and Construction Completions 2.0 MSF h h completeness. This information is presented exclusively for use by CBRE clients and professionals and all rights to the material are reserved and cannot be reproduced without prior written permission of the CBRE Global Chief Economist. *The arrows indicate a trend and do not represent a positive or negative value for the underlying statistic (e.g., net absorption could be negative, but still represent a positive trend over the time period).
- 7. NEW YORK Q2 2012 Recovery in the Manhattan market Manhattan’s two largest transactions all but one month. Year-over-year overall slowed in Q2 2012. Both were a historic 1.6 million-sq.-ft. average asking rents have increased by U.S. Office | MarketView Midtown and Downtown experienced renewal by Viacom, followed by a 6.3% in Midtown versus 17.7% in negative absorption of 419,000 sq. ft. 491,000-sq.-ft. renewal by Citigroup. Midtown South. and 407,000 sq. ft., respectively. Meanwhile, technology firms dominated Midtown South, on the other hand, new leasing in the Midtown South There is currently over 10 million sq. ft. increased its pace of recovery, with a market, characterized by several smaller either under construction or planned in 70-bps decrease in vacancy and asking transactions in Class B buildings. Manhattan. Roughly 5.3 million sq. ft. is rents nearing historic highs at $51.73 scheduled to come on-line Downtown at per sq. ft. The comparison of activity in the the World Trade Center in 2013, with Midtown and Midtown South markets 2.6 million sq. ft. pre-leased. Both Manhattan’s financial services sector, exemplifies the performance of markets vacancy rates and average asking rents more closely tied to global and eurozone reliant on technology versus traditional will rise in Downtown as a result of this economic uncertainty, retrenched to a financial and professional services firms. new Class A stock. Midtown has 1.3 cautious posture in Q2 2012. Renewals Leasing activity (excluding renewals) in million sq. ft. coming to market in 2013 dominated financial services activity in the Midtown market has come in below and another roughly 3.9 million sq. ft. Midtown and Downtown. Eight of its five-year average for all but one through 2015, with 7 Bryant Park and Manhattan’s top 25 transactions were month in 2012, whereas Midtown South, development projects on the far west completed by financial services firms and a market dominated by technology firm side at the Hudson Rail Yards. only two of them were new leases. activity, has beat its five-year average for WASHINGTON, DC Washington, DC, continues to struggle taking a similarly cautious posture. Six result in Department of Defense tenants with government cutbacks and political large law firms are active users in the vacating more than 6 million sq. ft. of deadlock as the upcoming elections market right now. Much of this activity leased space in Northern Virginia over approach. Any increases in professional could also result in a net decrease in the course of the next 12 to 18 months. services employment has been muted by occupied space as these firms seek more To date, roughly 3.0 million sq. ft. has decreases in the number of government efficient floor plans and a reduction in been vacated. workers. While the Downtown square footage per employee. Washington, DC, vacancy rate is down 10 bps over last quarter, metropolitan Washington, DC, has experienced a Washington, DC’s vacancy rate has recent spike in construction activity, most increased by 90 bps since last year. of it speculative. Developers are betting on the long-term viability of the market The GSA is one of the most active users and seek to fulfill demand for high in the Washington, DC, market. The net quality space. 2.8 million sq. ft. is slated effect of upcoming activity from this to come on-line over the course of the sector, however, will likely be dominated next two years with more than half of by renewals and result in a net decrease that amount available for tenant of occupied space as agencies adhere occupancy in 2013. to new space usage efficiency standards. 8 As business confidence stagnates and Metropolitan Washington,DC— economic uncertainty remains, many specifically Northern Virginia—is starting other professional services firms are to feel the effects of BRAC, which will
- 8. SAN FRANCISCO Q2 2012 San Francisco office market increase over Q1 2012. The technology Francisco. Class A asking rents have fundamentals continue to improve, and sector accounted for all of the market’s increased almost 25% since Q2 2011 U.S. Office | MarketView have been driven by the technology top 10 transactions and two-thirds of and Class B asking rents rose roughly sector. In Q2 2012, the San Francisco total market activity. 40%. There is 1.7 million sq. ft. of new Metropolitan area moved from the construction or full building renovation fifth-lowest vacancy rate in Q1 2011 to Similar to other U.S. markets, activity projects currently underway. the third-lowest nationally. Only the generated by the non-tech users is three downtown Manhattan markets dominated by renewals with boast vacancy rates lower than improvements in space usage efficiency downtown San Francisco, which dropped often resulting in a net contraction of 30 bps over the previous quarter to space. Technology firm activity, however, 9.7% in Q2 2012. While tightening of is characterized by new leases and the downtown San Francisco market expansions, as firms which already continues, the pace of recovery cooled embed space usage efficiency in their somewhat in Q2 2012, with positive culture grow, and new companies are absorption of 224,000 sq. ft. compared formed. to 867,000 sq. ft. in Q1 2012. The sharp upward trend of average asking Increases in rental rates and occupancy rents flattened a bit in Q2 2012, have renewed interest in construction reaching $44.02 per sq. ft., a 2.3% and renovation activity in downtown San HOUSTON Energy is another industry sector driving expanding energy companies to Hou- Class A vacancy rate of 2.8%, average improvements in U.S. commercial real ston. Roughly 26% of Houston’s transac- asking rents in the Energy Corridor have estate fundamentals. The Houston MSA, tion activity since January 2011 can be risen by $4.79 per sq. ft. over the course energy capital of the U.S., has seen attributed to the Eagle Ford Shale. of 2012 to $33.31 per sq. ft. healthy gains in employment. While still well below the highs of 2007, roughly The Houston metropolitan area has Developers are responding to the rapidly 88,000 jobs have been added in 2012. undergone a 190-bps year-over-year tightening suburban Houston market Mining and logging, manufacturing and decrease in office vacancy–the strongest with 2.7 million sq. ft. of construc- employment sectors tied to population performance of all of the energy-focused tion currently underway, the majority growth have seen the sharpest increases. markets. Suburban Houston in particular of it in West Houston. In the north, the Forty-eight percent of Houston’s top 25 has undergone a 220-bps decrease in Woodlands, with a Class A vacancy leases were oil and gas companies. Of vacancy with much of Q2 2012 activity rate of 1.6%, has 984,000 sq. ft. under those 12 oil and gas transactions, all taking place in West Houston. Energy- construction. With total inventory of 6.0 but two were new leases or renewals dominated suburban submarkets—En- million sq. ft., this small submarket will and expansions. Fifteen of Houston’s 25 ergy Corridor, Katy Freeway and the increase inventory by almost 17%. Three largest tenants in the market are oil and Woodlands—boast single-digit vacancy of the ten buildings currently under con- gas companies. The Eagle Ford Shale rates of 7.9%, 7.0% and 6.2%, respec- struction in Houston are speculative and formation, spanning roughly 3,000 tively. With energy companies favoring that trend is on the rise. square miles, will continue to bring jobs Class A space, this sector is particularly and significant population increases to tight and average asking rates are finally 9 South Texas as well as several new or catching up to the demand. With a
- 9. Q2 2012 Figure 8: Office Market Snapshot Lowest Vacancy Rates (%) METROPOLITAN DOWNTOWN SUBURBAN U.S. Office | MarketView CAMBRIDGE 7.6 MANHATTAN, MIDTOWN SOUTH 5.3 CAMBRIDGE 7.6 MANHATTAN 7.7 MANHATTAN, DOWNTOWN 7.9 NASHVILLE 9.3 SAN FRANCISCO 10.4 MANHATTAN, MIDTOWN 8.3 PITTSBURGH 10.0 PITTSBURGH 10.5 SAN FRANCISCO 9.7 SAN FRANCISCO 11.7 NASHVILLE 12.0 WASHINGTON, DC 10.1 SAN JOSE 12.0 Highest Vacancy Rates (%) METROPOLITAN DOWNTOWN SUBURBAN DETROIT & PALM BEACH COUNTY 26.7 TUCSON 35.7 DETROIT 27.2 LAS VEGAS 25.3 DALLAS/FT. WORTH 27.6 PALM BEACH COUNTY 26.7 PHOENIX 25.1 ST. LOUIS 25.5 LAS VEGAS 25.9 SACRAMENTO 23.5 DETROIT 25.1 SACRAMENTO & PHOENIX 25.5 INLAND EMPIRE 23.3 HARTFORD 25.0 CINCINNATI 23.5 Source: CBRE Research Figure 9: Largest Quarterly Decreases and Increases* Decreases in Vacancy METROPOLITAN DOWNTOWN SUBURBAN SEATTLE -1.3 SEATTLE -1.8 CHARLOTTE -1.6 CHARLOTTE -1.2 MIAMI -1.6 ALBUQUERQUE -1.5 BOSTON, ORLANDO & WILMINGTON -1.1 SAN ANTONIO -1.4 BOSTON -1.4 ALBUQUERQUE & PHOENIX -1.0 CINCINNATI -1.3 PHOENIX -1.3 MINNEAPOLIS/ST. PAUL -0.9 AUSTIN & WILMINGTON -1.2 MINNEAPOLIS/ST. PAUL, ORLANDO, TUCSON -1.2 Increases in Vacancy METROPOLITAN DOWNTOWN SUBURBAN FT. LAUDERDALE 0.9 TUCSON 5.2 FT. LAUDERDALE 1.1 INLAND EMPIRE 0.6 LAS VEGAS 3.5 MIAMI & SAN FRANCISCO 0.7 10 LAS VEGAS & SAN JOSE 0.5 PHOENIX 0.8 INLAND EMPIRE & SAN JOSE 0.6 OAKLAND 0.4 SALT LAKE CITY 0.7 LAS VEGAS 0.5 NEW JERSEY & KANSAS CITY 0.3 ALBUQUERQUE 0.5 JACKSONVILLE 0.4 *Percentage point change Source: CBRE Research
- 10. Figure 10: Office Vacancy - Q2 2012 Downtown Suburban Metropolitan Market Area Size Rank Q2 12 Q1 12 Q2 11 Q2 12 Q1 12 Q2 11 Q2 12 Q1 12 Q2 11 BALTIMORE 20 18.1 19.0 20.1 15.8 15.7 14.7 16.5 16.8 16.5 Q2 2012 BOSTON 7 10.8 11.5 11.8 16.5 17.9 16.7 14.2 15.3 14.8 CAMBRIDGE 50 N/A N/A N/A 7.6 8.2 10.4 7.6 8.2 10.4 HARTFORD 46 25.0 24.9 26.1 19.5 20.3 19.7 21.7 22.2 22.2 LONG ISLAND 31 N/A N/A N/A 14.4 14.8 15.6 14.4 14.8 15.6 MANHATTAN, DOWNTOWN 1 7.9 7.4 8.2 N/A N/A N/A 7.7 7.6 7.8 U.S. Office | MarketView MANHATTAN, MIDTOWN * 8.3 8.1 7.8 N/A N/A N/A N/A N/A N/A MANHATTAN, MIDTOWN SOUTH * 5.3 6.0 7.3 N/A N/A N/A N/A N/A N/A MARYLAND SUBURBAN ** N/A N/A N/A 15.0 15.0 15.0 N/A N/A N/A NEW JERSEY 8 N/A N/A N/A 16.6 16.3 16.5 16.6 16.3 16.5 PHILADELPHIA 12 14.1 14.1 14.0 22.0 21.7 21.8 18.6 18.4 18.5 PITTSBURGH 16 11.0 10.9 12.4 10.0 10.1 10.5 10.5 10.5 11.5 STAMFORD 29 N/A N/A N/A 20.1 20.1 19.4 20.1 20.1 19.4 VIRGINIA NORTHERN ** N/A N/A N/A 15.2 15.0 13.3 N/A N/A N/A WASHINGTON, DC *** 2 10.1 10.2 10.0 N/A N/A N/A 13.5 13.4 12.6 WESTCHESTER COUNTY 42 N/A N/A N/A 17.7 17.5 17.4 17.7 17.5 17.4 WILMINGTON 52 21.4 22.6 21.9 22.0 22.9 22.8 21.7 22.8 22.4 East 9.7 9.8 10.1 16.2 16.3 15.8 13.2 13.3 13.2 CHICAGO 3 14.8 14.9 15.9 22.5 22.6 23.1 18.3 18.4 19.2 CINCINNATI 34 22.1 23.4 20.8 23.5 23.6 24.3 22.9 23.5 22.9 CLEVELAND 36 18.9 19.2 22.9 21.7 22.8 23.9 20.4 21.1 23.5 COLUMBUS 39 17.0 16.9 17.0 19.7 19.7 20.9 18.8 18.7 19.7 DETROIT 17 25.1 25.6 28.1 27.2 27.5 28.5 26.7 27.1 28.4 INDIANAPOLIS 37 17.9 17.7 20.1 20.5 20.2 22.7 19.6 19.4 21.8 KANSAS CITY 23 17.3 17.0 16.4 18.1 17.9 16.6 17.9 17.6 16.5 MILWAUKEE 27 17.6 18.1 24.2 15.7 15.9 17.6 16.4 16.7 19.6 MINNEAPOLIS/ST. PAUL 18 19.1 19.6 19.0 18.6 19.8 19.1 18.8 19.7 19.1 ST. LOUIS 24 25.5 25.9 25.4 14.0 14.0 14.3 17.4 17.6 17.6 Midwest 17.6 17.8 18.8 20.9 21.1 21.7 19.6 19.8 20.5 ATLANTA 9 22.8 23.5 25.0 23.0 23.1 22.8 23.0 23.3 23.6 AUSTIN 32 13.1 14.3 16.4 16.3 17.0 22.4 15.6 16.4 21.1 CHARLOTTE 33 13.4 14.0 13.7 22.7 24.3 24.1 18.9 20.1 19.9 DALLAS/FT. WORTH 4 27.6 28.0 27.4 18.5 18.7 19.7 19.7 19.9 20.7 FT. LAUDERDALE 44 21.6 21.8 20.3 19.4 18.3 18.4 19.9 19.0 18.8 HOUSTON 6 10.8 10.7 11.6 14.8 15.5 17.0 13.9 14.4 15.8 JACKSONVILLE 48 24.9 25.7 24.5 20.8 20.4 20.0 22.1 22.0 21.4 MIAMI 28 20.2 21.8 19.7 18.7 18.0 17.6 19.2 19.3 18.3 NASHVILLE 40 20.9 21.3 24.2 9.3 9.3 11.0 12.0 12.1 14.0 ORLANDO 35 15.2 15.7 18.2 18.7 19.9 21.0 17.9 19.0 20.4 PALM BEACH COUNTY 49 N/A N/A N/A 26.7 27.3 26.0 26.7 27.3 26.0 SAN ANTONIO 45 22.3 23.7 25.6 15.7 16.1 16.4 16.9 17.5 18.1 TAMPA 25 16.5 16.7 16.8 20.0 21.0 21.9 19.5 20.3 21.1 South 19.0 19.6 20.1 18.4 18.7 19.6 18.5 18.9 19.7 ALBUQUERQUE 53 22.5 22.0 20.1 16.8 18.3 17.5 18.0 19.0 18.0 DENVER 11 11.9 13.0 14.4 15.7 16.0 16.6 14.8 15.3 16.1 HONOLULU 54 15.7 15.6 16.3 14.9 14.7 14.2 15.3 15.1 15.1 INLAND EMPIRE 47 N/A N/A N/A 23.3 22.7 23.5 23.3 22.7 23.5 LAS VEGAS 38 15.4 11.9 16.9 25.9 25.4 25.2 25.3 24.8 24.7 LOS ANGELES 5 18.3 18.3 18.1 16.5 16.9 17.5 16.8 17.2 17.6 OAKLAND 43 12.3 12.2 14.3 14.8 14.2 16.0 13.8 13.4 15.3 ORANGE COUNTY 13 N/A N/A N/A 14.2 15.0 15.8 14.2 15.0 15.8 PHOENIX 15 23.9 23.1 21.2 25.5 26.8 27.3 25.1 26.1 26.0 PORTLAND 26 10.2 9.7 9.7 19.8 20.3 20.5 15.2 15.2 15.3 SACRAMENTO 22 16.2 16.4 16.2 25.5 25.6 24.9 23.5 23.7 23.1 SALT LAKE CITY 41 18.1 17.4 16.2 13.9 14.5 16.6 15.4 15.5 16.4 SAN DIEGO 19 18.4 18.6 19.1 15.8 16.2 16.9 16.2 16.6 17.2 SAN FRANCISCO 10 9.7 10.0 13.5 11.7 11.0 11.8 10.4 10.3 12.9 SAN JOSE 21 23.7 23.5 25.1 12.0 11.4 15.6 13.7 13.2 17.0 SEATTLE 14 14.5 16.3 18.9 17.0 17.9 18.8 15.9 17.2 18.8 TUCSON 55 35.7 30.5 25.0 15.5 16.7 17.0 17.7 18.3 17.0 VENTURA COUNTY 51 N/A N/A N/A 23.2 24.0 23.0 23.2 24.0 23.0 11 WALNUT CREEK 30 N/A N/A N/A 16.3 16.9 18.3 16.3 16.9 18.3 West 14.3 14.6 16.1 17.5 17.8 18.6 16.7 17.0 17.9 UNITED STATES 12.6 12.8 13.0 17.5 17.8 18.1 15.7 16.0 16.3 * Included in Manhattan, Downtown ** Included in Washington, DC metro *** Washington, DC metro figures include Maryland Suburban, Virginia Northern and Washington, DC Downtown U.S. national figures provided by CBRE Econometric Advisors (CBRE EA), all other figures compiled by CBRE Research
- 11. contacts For more information about this U.S. Office MarketView, please contact: Q2 2012 Edward J. Schreyer, SIOR Asieh Mansour, Ph.D. James Costello Executive Managing Director Head of Research, Americas and Managing Director, Head of Americas U.S. Office | MarketView Brokerage Services, Americas Senior Managing Director Investment, Consulting and Strategy, CBRE CBRE Global Research and Consulting CBRE Global Research and Consulting t: +1 214 863 3042 t: +1 415 772 0258 t: +1 617 912 5326 e: ed.schreyer@cbre.com e: asieh.mansour@cbre.com e: jim.costello@cbre.com Follow Asieh on Twitter: @AsiehMansourCRE Raymond Wong Heather Edmonds Pamela Murphy Managing Director, COO and Director, Western U.S. Research Division, Senior Vice President, Eastern Industrial Specialist, Americas Research, CBRE Global Research and Consulting and Central U.S. Research Divisions, CBRE Global Research and Consulting CBRE Global Research and Consulting t: +1 416 815 2353 t: +1 909 418 2090 t: +1 212 984 8004 e: raymond.wong@cbre.com e: heather.edmonds@cbre.com e: pamela.murphy@cbre.com Andrea Walker Director Head of Americas Research Publications and Data, CBRE Global Research and Consulting t: +1 919 376 8608 e: andrea.walker@cbre.com FOLLOW US GOOGLE+ FACEBOOK TWITTER Global Research and Consulting This report was prepared by the CBRE U.S. Research Team which forms part of CBRE Global Research and Consulting – a network of preeminent researchers and consultants who collaborate to provide real estate market research, econometric forecasting and consulting solutions to real estate investors and occupiers around the globe. Disclaimer 12 Information contained herein, including projections, has been obtained from sources believed to be reliable. While we do not doubt its accuracy, we have not verified it and make no guarantee, warranty or representation about it. It is your responsibility to confirm independently its accuracy and completeness. This information is presented exclusively for use by CBRE clients and professionals and all rights to the material are reserved and cannot be reproduced without prior written permission of the CBRE Global Chief Economist.