

Empfohlen
Empfohlen
Weitere ähnliche Inhalte
Andere mochten auch
Andere mochten auch (20)
Ähnlich wie Cartes des sciences
Ähnlich wie Cartes des sciences (20)
Cartes des sciences
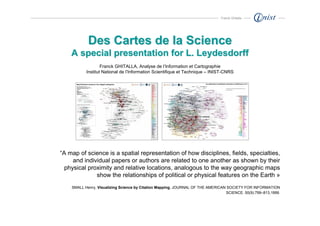
- 1. Franck Ghitalla Des Cartes de la Science A special presentation for L. Leydesdorff Franck GHITALLA, Analyse de l’Information et Cartographie Institut National de l’Information Scientifique et Technique – INIST-CNRS “A map of science is a spatial representation of how disciplines, fields, specialties, and individual papers or authors are related to one another as shown by their physical proximity and relative locations, analogous to the way geographic maps show the relationships of political or physical features on the Earth » SMALL Henry, Visualizing Science by Citation Mapping, JOURNAL OF THE AMERICAN SOCIETY FOR INFORMATION SCIENCE. 50(9):799–813,1999.
- 2. Franck Ghitalla Some informations about my projects wich were not included in my presentation http://gephi.org/ (for graph exploration) http://fr.linkfluence.net/ (a new company of eitheen persons, based on my work around « web aggregates » of information http://fr.linkfluence.net/insights-2-0/atlas/ (a synthesis of many projects we are working on) http://diseasome.eu/ (selected project in Places and Spaces) http://webatlas.fr/ (the Association wich groups all people (ingineers and researchers, companies…) who work with me My favorite books and researchers (without you and I.Rafols!) : Katy Borner, Richard Klavans and Kevin Boyack, A.-L. Barabasi, M. Newman, D. Watts and J. Kleinberg. I’m teaching et searching on Network Sciences since 1999 in France. Scientific information is a quiet new field for me.
- 3. Franck Ghitalla Objectifs des cartographies de l’I.S.T. 1) Champ de recherche des « Scientogrammes » ou « Cartes des Sciences » (de fondation en scientométrie, apports récents de l'Information Visualization et des Network Sciences, R. Klavans, K.Borner, L.Leydesdorff) 2) Explorer/exploiter des solutions de manipulation des "couches" de méta- données associées à l'IST - BasesThomson, Elsevier), source de nouvelles méthodes d’observation et d’analyse de l’IST 3) Possibilité de produire une "boussole" qui permettrait de fixer les principales propriétés d'une géographie des connaissances scientifiques. (navigation dans des données en grandes masses, hétérogènes)
- 4. Franck Ghitalla 1) Des publications, des méta-données et des cartes
- 5. Franck Ghitalla La recherche d’un principe d’ordre dans les données, à différentes échelles 1 Communauté de chercheurs français co- Visualisation du graphe d’inter- Le même type de données (sur publiants en Chimie (années 2006-2009), citations entre 7,121 revues du 2006) mais les revues ont été projet EDWoS, données Thomson-Reuters) SCI par K.Boyack et R.Klavans regroupées en fonction de la en 2007 (mesures construites à distribution des ISI Subject partir des 15 valeurs les plus Categories dans le WoS et élevées de co-citations pour réparties en 14 grands chaque revue) (densité du domaines par L. Leydesdorff) graphe : 3,16%) (densité du graphe : 38,46%, spatialisation : projet EDWoS)
- 6. Franck Ghitalla La recherche d’un principe d’ordre, avec différentes dimensions 2 Occurrences auteurs : 97559 / chercheurs et communautés La recherche en chimie en France 1.990.981 liens De 2000 à 2010 85381 Mots-clefs / vocabulaire de spécialité
- 7. Franck Ghitalla La recherche d’un principe d’ordre, à l’échelle du temps 3 2000 2010
- 8. Franck Ghitalla 2) Construction de la vue sur les données L’exemple de la « Carte des Sciences » (Map Of Sciences)
- 9. Franck Ghitalla Carte des Sciences Propriétés graphiques Processus d’agrégation des données 14 couleurs 14 domaines scientifiques (the « fourteen solution ») Taille des nœuds (proportional to the Distribution des 172 descripteurs Thomson (ISI logarithm of the number of Subject Categories) en 2006 (Science Citation citations given by each Index – SCI) category) Structure de liens 6,614 revues indexées dans le JCR (Journal (22.672 dans la Citation Report) / Réseau d’inter-citations entre carte) revues Plus de 8 millions d’articles indexés dans le WoS / Réseau de citations entre publications
- 10. Données Filtrage Hiérarchie Spatialisation For more information, please visite the website dedicated to GEPHI Labels (powerfull tool for graph visualisation : Gephi include .net and .gdf formats)
- 11. Franck Ghitalla
- 12. Franck Ghitalla
- 13. Franck Ghitalla 3) Carte et géographie de l’Information Scientifique L’exemple de la « Carte des Sciences en France» (Map Of Sciences)
- 14. Franck Ghitalla Structures de graphe Boussoles cartographiques Bases de données
- 15. Franck Ghitalla La « Carte des Sciences en France » (2009) En 2009, ont été indexés dans le Web of Science 68717 publications et documents scientifiques produits par des chercheurs associés à un laboratoire français. La production scientifique française est répartie dans 6265 revues et sources d'information (sur 11 241 que compte le WoS en 2009). Cette carte prend en compte la distribution des ISI Subject Categories dans le Science Citation Index (SCI), le Social Sciences Citation Index (SSCI) et le Art & Humanities Citation Index (A&HCI). Elle inclue donc les SHS. Nombre de noeuds : 245 Nombre de liens : 24.588 Diamètre du graphe : 4 Densité du graphe : 0,5
- 18. Franck Ghitalla 4) Mesures et Indicateurs
- 19. Franck Ghitalla Géographie de la « centralité ». Relais et connecteurs : les indices de l’interdisciplinarité? Un auteur, une publication, une revue ou une discipline peuvent être évalués pour le rôle qu’ils jouent à l’échelle d’un réseau
- 20. Franck Ghitalla Géographie de la « coopération » scientifique : le réseau des co- publications en Chimie (2006-2010) Identification des communautés par les mots- clefs et identification des mots-clefs spécialisés par les communautés (chercheurs spécialisés et vocabulaire expert) Production d’un graphe bi-partite 97.559 auteurs 85.381 mots-clefs 1.990.981 liens Visualisation des principales communautés de co-publication en Chimie (au moins 30 chercheurs et plus de 10 co-publications)
- 21. Franck Ghitalla Exploration de communautés de chercheurs : focus sémantique et social Vocabulaire spécialisé Communauté active
- 22. Franck Ghitalla 5) Instruments de navigation
- 24. Franck Ghitalla BORNER Kathy, SCHAMHORST Andrea, Visual Conceptualizations and Models of Science, in to the 2009 Références Journal of Informetrics Special Issue on the Science of Science, Journal of Informetrics, 3(3). BORNER Cathy, CHEN Chaomei, BOYACK Kevin, Visualizing Knowledge Domains, In Annual Review of Information Science & Technology, Volume 37, 2003. BRAAM Robert R., WED Henk F., VAN RAAN Anthony F. J. , Mapping of Science by Combined Co-Citation and Word Analysis. II: Dynamical Aspects, JOURNAL OF THE AMERICAN SOCIETY FOR INFORMATION SCIENCE. 42(4):252-266, 1991. BRAAM Robert Ft., MOED Henk F., VAN RAAN Anthony F.J., Mapping of Science by Combined Co-Citation and Word Analysis. I. Structural Aspects, JOURNAL OF THE AMERICAN SOCIETY FOR INFORMATION SCIENCE. 42(4):233-251, 1991. KLAVANS Richard, BOYACK K.W., Toward a Consensus Map of Science, in Journal of the American Society for Information Science and Technology (2009), vol. 60(2), pages TBD. Digital Object Identifier: DOI: 10.1002/asi.20991. KLAVANS Richard, BOYACK K.W., Quantitative evaluation of large maps of science, in Scientometrics. KLAVANS Richard, BOYACK K.W., BORNER K., Mapping the backbone of science, Jointly published by Akadémiai Kiadó, Budapest, in Scientometrics,and Springer, Dordrecht Vol. 64, No. 3 (2005) 351.374 LEYDESDORFF Loet, RAFOLS Ismael, A Global Map of Science Based on the ISI Subject Categories, Journal of the American Society for Information Science and Technology 60(2) (2009) 348-362. NEWMAN, M. E. J. (2006b), Modularity and community structure in networks, Proceedings of the National Academy of Sciences, 103(23), 8577-8582. PRICE, D. J. de Solla (1965), Networks of scientific papers, Science, 149, 510- 515. SHIFFRIN Richard M., BORNER Cathy, Mapping knowledge domains, www.pnas.org_cgi_doi_10.1073_pnas.0307852100 PNAS _ April 6, 2004 _ vol. 101 _ suppl. 1 _ 5183–5185. SMALL Henry, Visualizing Science by Citation Mapping, JOURNAL OF THE AMERICAN SOCIETY FOR INFORMATION SCIENCE. 50(9):799–813, 1999. VAN RAAN Anthony F.J., Measurement of Central Aspects of Scientific Research: Performance, Interdisciplinarity, Structure, MEASUREMENT, 3(1), 1–19, 2005, Lawrence Erlbaum Associates, Inc.
- 25. Franck Ghitalla Des Cartes de la Science Expérimentations autour de la géographie des connaissances scientifiques Franck GHITALLA, Analyse de l’Information et Cartographie Institut National de l’Information Scientifique et Technique – INIST-CNRS “A map of science is a spatial representation of how disciplines, fields, specialties, and individual papers or authors are related to one another as shown by their physical proximity and relative locations, analogous to the way geographic maps show the relationships of political or physical features on the Earth » SMALL Henry, Visualizing Science by Citation Mapping, JOURNAL OF THE AMERICAN SOCIETY FOR INFORMATION SCIENCE. 50(9):799–813,1999.