2017 Google Shopping Benchmarks Report - Sidecar
•
0 gefällt mir•376 views

We analyzed 19.1 billion user sessions on retailers’ e-commerce sites to produce the definitive account of the state of Google Shopping today: The 2017 Google Shopping Benchmarks Report. See the full research and analysis at https://hello.getsidecar.com/blog/2017-google-shopping-data-benchmarks.
Empfohlen

Empfohlen
Weitere ähnliche Inhalte
Kürzlich hochgeladen
Kürzlich hochgeladen (20)
Empfohlen
Empfohlen (20)
2017 Google Shopping Benchmarks Report - Sidecar
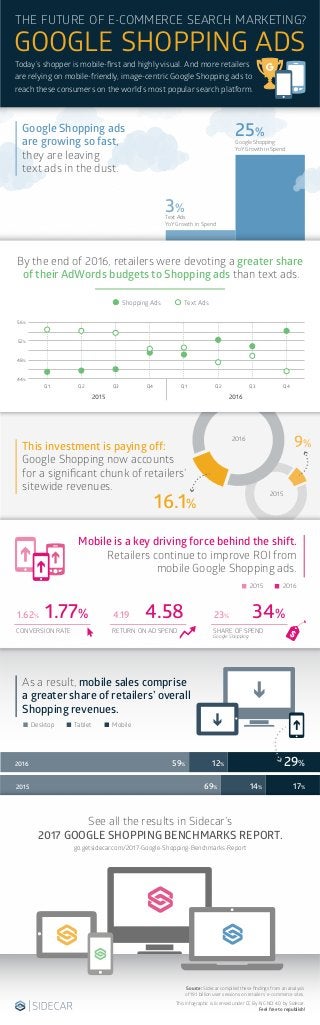
- 1. Google Shopping ads are growing so fast, they are leaving text ads in the dust. By the end of 2016, retailers were devoting a greater share of their AdWords budgets to Shopping ads than text ads. 2015 2016 Desktop Tablet Mobile 16.1% 9% Today’s shopper is mobile-first and highly visual. And more retailers are relying on mobile-friendly, image-centric Google Shopping ads to reach these consumers on the world’s most popular search platform. 2015 2016 This investment is paying off: Google Shopping now accounts for a significant chunk of retailers’ sitewide revenues. As a result, mobile sales comprise a greater share of retailers’ overall Shopping revenues. Mobile is a key driving force behind the shift. Retailers continue to improve ROI from mobile Google Shopping ads. THE FUTURE OF E-COMMERCE SEARCH MARKETING? GOOGLE SHOPPING ADS 25% 3% Google Shopping YoY Growth in Spend Text Ads YoY Growth in Spend Shopping Ads Text Ads Q1 Q2 Q3 Q4 Q1 Q2 Q3 Q4 44% 48% 52% 56% 2015 2016 1.77%1.62% 34%23% CONVERSION RATE 4.584.19 RETURN ON AD SPEND SHARE OF SPEND Google Shopping 2015 2016 See all the results in Sidecar’s 2017 GOOGLE SHOPPING BENCHMARKS REPORT. This infographic is licensed under CC By-NC-ND 4.0 by Sidecar. Feel free to republish! Source: Sidecar compiled these findings from an analysis of 19.1 billion user sessions on retailers’ e-commerce sites. 29%59% 12% 69% 14% 17% go.getsidecar.com/2017-Google-Shopping-Benchmarks-Report