

Empfohlen
Weitere ähnliche Inhalte
Ähnlich wie What is an infographic v2
Ähnlich wie What is an infographic v2 (20)
Mehr von GeoBlogs
Mehr von GeoBlogs (20)
Kürzlich hochgeladen
Kürzlich hochgeladen (20)
What is an infographic v2
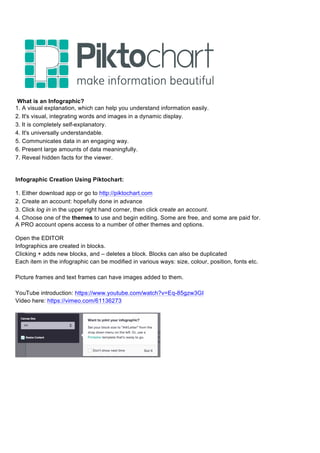
- 1. What is an Infographic? 1. A visual explanation, which can help you understand information easily. 2. It's visual, integrating words and images in a dynamic display. 3. It is completely self-explanatory. 4. It's universally understandable. 5. Communicates data in an engaging way. 6. Present large amounts of data meaningfully. 7. Reveal hidden facts for the viewer. Infographic Creation Using Piktochart: 1. Either download app or go to http://piktochart.com 2. Create an account: hopefully done in advance 3. Click log in in the upper right hand corner, then click create an account. 4. Choose one of the themes to use and begin editing. Some are free, and some are paid for. A PRO account opens access to a number of other themes and options. Open the EDITOR Infographics are created in blocks. Clicking + adds new blocks, and – deletes a block. Blocks can also be duplicated Each item in the infographic can be modified in various ways: size, colour, position, fonts etc. Picture frames and text frames can have images added to them. YouTube introduction: https://www.youtube.com/watch?v=Eq-85gzw3GI Video here: https://vimeo.com/61136273