Health Deprivation mapped
•
1 gefällt mir•523 views

You cannot address health inequalities without looking at the social determinants such as education and employment skills. This applies at the individual as well as the neighbourhood level.

Empfohlen
Weitere ähnliche Inhalte
Andere mochten auch
Ähnlich wie Health Deprivation mapped
Ähnlich wie Health Deprivation mapped (20)
Mehr von Gavin Barker
Mehr von Gavin Barker (15)
Kürzlich hochgeladen
Kürzlich hochgeladen (20)
Health Deprivation mapped
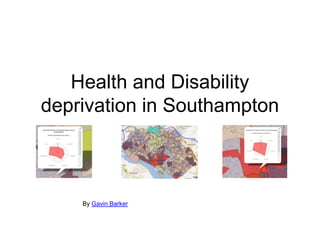
- 1. Health and Disability deprivation in Southampton By Gavin Barker
- 2. This map looks at health and disability deprivation in Southampton click image to access live map • It ranks and scores tiny geographical areas called Lower Super Output Areas or LSOA’s • Lower Super Output areas contain approximate populations of 1,000 to 1,500 people • An area is characterised as deprived relative to other areas in England on the basis of the proportion of people in the area experiencing the type of deprivation in question – in this case health & disability
- 3. It also looks at health and disability deprivation in relation to other dimensions or ‘domains’ of deprivation There are seven domains of deprivation • Income • Employment • Education & Skills • Health & Disability • Living Environment • Barriers to Housing & Services • Crime Different domains of deprivation are measured differently and for this reason you cannot compare exact scores – but you can compare their decile rank. It is useful to do this because health deprivation is affected by other issues that cannot be addressed in isolation from each other. Let’s look at a few examples.
- 4. Health challenges that these individuals face are interlinked to other urgent needs Examples • A single mother on anti-depressants struggles to hold down a job while balancing child care responsibilities • A patient’s health deteriorates during a Health long spell of unemployment. While he has recently found a job, he fears he will lose it if he takes more time out to attend the diabetic clinic • An obese patient whose housing problems still haven’t been resolved is Employment Housing given advice about healthy eating and exercise. Trying to address health issues in isolation from other needs will not work.
- 5. What applies at the individual level also applies at local area level Health Employment Housing
- 7. The health of people in Southampton is generally worse than the England average. Estimated levels 20.5% of year 6 of adult 'healthy children are eating' are worse classified as than the England obese average Key Tooth decay in children Challeng Levels of are worse es teenage than the pregnancy English are higher average Smoking related deaths are significantly higher Source: Public Health Observatories
- 8. Life expectancy is 7.7 years lower for men in the most deprived areas of Southampton compared to the least deprived areas* * Same as the England average. Based on the Slope Index of Inequality published on 5th January 2011
- 9. Child Poverty • Southampton has a relatively high number of children living in poverty compared to other areas • This is revealed in research by the charity Save The Children which points out that in 2009, the wealth of Britain’s one thousand richest people rose by one-third to more than £333 billion. And yet, in the fifth wealthiest country in the world, 1.6m youngsters in the UK live in "severe poverty" • The government's surveys defines severe poverty as a household with half the average income - for a family of four this would be pay of less than £12,500. • The definition also includes material deprivation. For example, this would mean children were unable to take a holiday or invite friends home for tea and adults were not able to pay for repairs to fridges or afford insurance Save the spreadsheet Links Children