SlideShare ist ein Scribd-Unternehmen logo
1 von 41
Downloaden Sie, um offline zu lesen
INDEPENDENT FOREST INVENTORY
OF ACACIA MANGIUM –
ANNUAL REPORT MAY 2012
Produced in conjunction with the Universidade de Trás-os-Montes e Alto Douro

GW Agropecuaria Ltda.
Barreiras, Bahia Brazil. CPNJ10.906.327/0001-66
TABLE OF CONTENTS
1
1.
Introduction .................................................................................................................... 3
1.1.
Species characterization .................................................................................................................................................. 5
1.2.
Main Goals ............................................................................................................................................................................ 6
2.
Field Material.................................................................................................................. 7
3.
Area characterization ................................................................................................. 8
3.1
Vale do buriti farm .............................................................................................................................................................. 8
3.2
Santa Maria Farm ................................................................................................................................................................ 8
4.
Climate characterization ........................................................................................... 9
4.1
Temperature ......................................................................................................................................................................... 9
4.2
Precipitation........................................................................................................................................................................ 10
4.3
Insolation .............................................................................................................................................................................. 11
5.
Edaphic and ecological characterization .......................................................... 12
6.
Methodology ............................................................................................................... 13
6.1.
Random sampling ............................................................................................................................................................. 13
7.
Fieldwork procedures ................................................................................................ 15
8.
Measurement and observation errors .................................................................. 17
8.1.
Human Errors ....................................................................................................................................................................... 17
8.2.
Measurement errors .......................................................................................................................................................... 17
9.
Diameters measurement rules ................................................................................ 18
9.1.
Dominant trees .................................................................................................................................................................. 19
9.2.
Model Tree .......................................................................................................................................................................... 19
9.3.
Wood volume calculation .............................................................................................................................................. 20
10.
Statistical analysis ........................................................................................................ 21
10.1.
Average ............................................................................................................................................................................... 21
10.2.
Variance .............................................................................................................................................................................. 22
10.3.
Standard Deviation .......................................................................................................................................................... 22
10.4.
Variance of average ....................................................................................................................................................... 23
10.5.
Standard Error..................................................................................................................................................................... 23
10.6.
Sampling Error..................................................................................................................................................................... 24
10.7.
Interval of Confidence .................................................................................................................................................... 24
11.
Results ............................................................................................................................. 25
11.1.
Hypsometric Curves (h - height in meters; d - diameter in cm) ........................................................................... 25
11.1.1. Santa Maria’s Farm .................................................................................................................................................. 25
11.1.2. Vale do Buriti’s Farm ................................................................................................................................................ 26
11.2.
Cubing Equations: ............................................................................................................................................................. 27
11.2.1. Santa Maria’s Farm .................................................................................................................................................. 27
11.2.2. Vale do Buriti’s farm ................................................................................................................................................. 28
11.3.
Santa Maria’s Farm ........................................................................................................................................................... 29
12.
Conclusions .................................................................................................................. 35
12.1.
Santa Maria’s Farm ........................................................................................................................................................... 35
12.2.
Vale do Buriti’s Farm ......................................................................................................................................................... 36
13.
Bibliographic References ......................................................................................... 37

GW Agropecuaria Ltda.
Barreiras, Bahia Brazil. CPNJ 10.906.327/0001-66
1.

INTRODUCTION

GW Group introduction
The 2012 GW Group (Brazil) Annual Report dated, May 11th 2013, has been compiled in
conjunction with the Post Graduate Masters’ students of Universidade de Trás-os-Montes e Alto Douro
(UTAD), http://www.utad.pt/vPT/Paginas/HomepageUtad.aspx, overseen by Assistant Professor
Domingos Lopes. The studies took place during November/ December 2012. The primary objectives of
the 2012 UTAD study was to provide a detailed independent forestry inventory on two mixed species
plantations belonging to the GW Group.
Such studies would characterize the geographic area, climatic conditions, soil conditions, work
procedures, volumes of wood production per hectare; based on random area sampling (to evaluate the
entire plantations is logistically unfeasible). In total 63 plots were evaluated and wood productions rates
were calculated via a “SYSTAT” program, details of which are contained within the document.
The report was originally composed in Portuguese and has been subsequently translated and signed off
by UTAD - no textual changes have been made in order to retain the integrity of the document. In this
report, UTAD have focused their studies in particular in the Acacia Mangium tree species, with the
intention for the following report (2) by UTAD, to focus on Eucalyptus and several other tree species
currently under management by the GW Group in Bahia state Brazil. These studies will commence
several months in advance of those conducted in 2012 (July onwards) and therefore it is expected
that this report will be made available by early 2014.
UTAD post graduate students will come under the guidance of the following personnel:
Prof. José Aranha (Forest Engineering and Landscape Architecture Department Director)
Prof Simone Varandas (Director of Forest Engineering Course)
Marai João Gaspar (Vice-Director of Forest Engineering Course)
Ricardo Gonçalves (Senior Project Manager, GW Portugal)
Nuno Paris (Operations Director, GW Agropecuaria ltda)
The post graduate study was the first conducted as part of the strategic partnership between the
GW Group and UTAD, and we believe forms the foundation of a long term relationship between the 2
partners. The first study offered the opportunity for students to obtain invaluable hands-on
experience of live, operating forestry projects outside of the academic background. Our intention is to
build on these foundations with UTAD. As our forestry projects develop and expand we are confident
that additional strategic partnerships will be formed to be able to offer more independent technical
audits across all our plantations globally, with in-depth analysis of each tree species progression. It is vital
that the data compiled is done independently for objective opinion to be formed, hence our eagerness
to continue to develop further partnerships.
In respect to the Acacia Mangium project, it is notable that, according to the independent study
conducted by UTAD, growth rates at our most mature Acacia Mangium projects ( three years plus) are
exceeding GW Group´s original forecasts of 31.4 cubic meters per hectare by 8.59%. Average volume
production is currently achieving 34.1 cubic meters per hectare. The agroforestry management team
remains confident that such rates will continue to improve.
We would like to take this opportunity to thank all contributors from UTAD for the compilation of this report
and look forward to further development of the partnership.
Statement Ends.

GW Agropecuaria Ltda.
Barreiras, Bahia Brazil. CPNJ 10.906.327/0001-66
UTAD introduction
The forest inventory is one of the best tools of the forest
engineer, since it allows us to know exactly what a population
area is and, therefore, decide on the best strategy to maximize
yield.
In this forest inventory, in an area belonging to GW Group,
63 plots were inventoried: 23 in Vale do Buriti’s farm and 40 in
Santa Maria’s farm. The main goal was to assess the
growth volume on these farms.
Therefore, some plots were selected on the field randomly based on the existence of a future
tree in the center of each plot. The land and the forest management are one of the main
interests of this forest inventory. Like any other economic activity, it is essential the prior
knowledge of the preexisting resources and the estimated evaluation to be produced until the
age of the final cut.
The technical information is, in essence, based on the sampling techniques. The methods used
to survey the forest populations, seek to get the lowest possible error for the same amount of
work. Due to the fact that to make a full assessment of all the trees that belongs to the
population it is too expensive in terms of resources, there was a previous evaluation of the
number of sample plots needed for study. Thus, we would be able to determine the volume per
plot, and therefore we would be able to extrapolate the total area. On the other hand, it is
necessary to take into account the specific type of forest so that the methods and sampling
procedures are adjusted to, thereby, enable reducing the cost of this inventory. This cost is
directly affected by the measurement time and the path.
After a work planning, this final report has been prepared in which is the final results and
procedures are succinctly explained.

GW Agropecuaria Ltda.
Barreiras, Bahia Brazil. CPNJ 10.906.327/0001-66
1.1. SPECIES CHARACTERIZATION
The Acacia mangium is a large tree that can reach 25 to 30 m tall, with its straight trunk that
can exceed half of the total tree height. The standing trunk has grayish-brown, with slightly
protruding shell and slightly grooved along. As for its branching, it presents thin, horizontal,
spaced, oval form with dense foliage canopies.
The leaves are alternate and simple in green and winged branches, arranged in spiral, ovallanceolate or oval-elongated, broad, leathery, with short petiole, apex elongated, ribs
protruding from the base, 12-18 cm long. The A. mangium leaves are permanent “filódios”
which did not evolve, not giving rise to true leaves, which should be pinnate.
According to the Center for Agroforestry Research of Rondônia – CPAFRO (2004), the flowers
are arranged in loose ears 10 cm long, single or united upper armpit. The flowers are
pentamerous, with a cup of 0.6-0.8 mm long, with short obtuse lobes, a corolla twice longer
than the calyx. The fruits are like pods, twisted or coiled, brown, short, dehiscent, with black
seeds, small and pending in the pod by a yellow filament, formed from September to
November. These are linear when green, with 3-5 mm width, attaining 7.8 cm in length.
The seeds are glossy and may have an ellipsoid or oval form (2.5 to 3.5 mm), within an orange
color, which may vary in intensity (Barbosa, 2002). It is native to the northern state of
Queensland, in Australia, Papua New Guinea and the Maluku and Irian Java islands, in
Indonesia (Tonny e Vieira, 2006). The distribution area latitudes are between 1 ° and 19 ° S, and
the main populations are distributed at altitudes
between sea level and 100 m, with an upper limit of
720 m known (Doran e Skelton, 1982).
The A. mangium can withstand minimum
temperatures average 12-25 º C and maximum
average 31-34 º C (Barbosa, 2002). The main
regions of distribution of this species are those with
humid tropical climate with a short dry period in the
winter and a high total annual precipitation. The
temperatures near the coastal region are high and
uniform throughout the year, hence the
inappropriateness of this species in these regions. In
figure 1 we can see the overall appearance of the
species.

Fig.1: General aspect of Acacia mangium.

GW Agropecuaria Ltda.
Barreiras, Bahia Brazil. CPNJ 10.906.327/0001-66
1.2. MAIN GOALS
The main goal of this forest inventory is to assess the current production of wood into two distinct
classes: the future trees and thinning trees. The first are those with physical conditions to reach a
final cut for having good and straight boles. Meanwhile, the latter are defective or present a
faulty growth and will not reach the final cut; they will very soon be subject to the process of
thinning. Therefore, this study includes data as the volume as a future timber trees per hectare,
the volume of timber thinning of trees, the percentage of trees and thinning per hectare and
estimates of the value of the diameter as a function of DBH. It will also be presented the
hypsometric curves and scaling equations of individual trees. The method used to select the
plots was randomized, and 23 plots were selected in the Vale do Buriti’s farm - FSPU09 and 40
plots in Santa Maria’s farm - FSPU02. The plots selected had a circular geometry and a total
area of 500 m2 each. Subsequent to field inventory, calculations were performed concerning
the volumes on the bark for all trees on the plot. For this analysis, equations have been
previously developed for this purpose, through a program called SYSTAT.
Information to be collected in sample plots:



Tilt (in degrees);



Dead trees: notes the absence or presence, then the registry by category
(Standing Dead: SD)



Trees future: Boles marked with B (good).



Thinning Trees: Reasonable or bad boles and not being a future tree.



GPS Coordinates of the center portion;



Azimuth: For each tree is important to know which is the angle relative to the north –
In degrees



Distance to the center: distance of each tree to the center of the plot in meters;

As the plots are permanent, the Hossfeld method application has already been started. Once
the trees dimensions make scaling practical, the Pressler Bitterlich methodology will be applied.
For each plot, the dominant trees were removed, in which case the plots of 500 m2 are five. As
can be seen in figure 2, GPS is placed in the tree that represents the center of the plot, suitably
marked in red and subsequently the coordinates will be withdrawn.

GW Agropecuaria Ltda.
Barreiras, Bahia Brazil. CPNJ 10.906.327/0001-66
2.

FIELD MATERIAL

















Tape-measure;
Vertex Hypsometer;
Relascope Bitterlich mirrors;
Caliper;
Compass;
Can of red paint;
Cards numbered to 100;
Pushpins;
GPS;
Leggings;
Waterproof;
Field sheets;
Pens;
Stepladder;
Insect Repellent;
Thermos water;

Fig.2: Attainment of the coordinates of the center of the plot.

GW Agropecuaria Ltda.
Barreiras, Bahia Brazil. CPNJ 10.906.327/0001-66
3.

AREA CHARACTERIZATION

3.1 VALE DO BURITI FARM
The inventoried area is located in the “Assentamento do Poção”, in the municipality of
Catolândia (60 km from the city of Barreiras), in the state of Bahia. The farm is divided into plots,
(FSPUs - Forestry Standard Production Unit) with the legal field reserve burned during the dry
season. The plot leaning against the population area in question is clean and ready to be
planted; soon the danger of fire is reduced. Nevertheless, it is necessary to pay special
attention to the neighboring farms that have a lot of vegetation.
Fig.3: Location of the Vale do Buriti’s farm….
Buriti Valley, Poção

Source: Google Earth

Latitude

53°37'12.46"E

Longitude

86°45'395.66"S

3.2 SANTA MARIA FARM
The inventoried area is also located in the “Assentamento do Poção”, in the municipality of
Catolândia (60 km from the city of Barreiras), in the state of Bahia.

Fig.4: Location of population area of Santa Maria’s Farm
Santa Maria, Poção

Source: Google Earth

Latitude

53°61’71.94”E

Longitude

86°46’279.84”S

GW Agropecuaria Ltda.
Barreiras, Bahia Brazil. CPNJ 10.906.327/0001-66
4.
4.1

CLIMATE CHARACTERIZATION
TEMPERATURE

In the climate characterization of the area in study there were used weather data, including
temperature and precipitation, recorded by the weather station in Barreiras-Bahia. The Barreiras
County is inserted in a region where the climate sub-humid to dry prevails. The average annual
temperature is 24,3ºC, standing in the average temperature values for the State of Bahia.
Regarding the average temperatures of the last 20 years (1992-2012), this year was the year in
which this was closer to 2011, as the figure 6 shows.

Fig.6: Monthly average of the minimum and maximum daily temperatures recorded by the
weather station Barreiras-Bahia during the year of 2011 in the city of Barreiras (Allmetsat).

From the analysis of this graphic we obtained the monthly average temperatures of the three
hottest months (August, September and October) and the three cooler months (June, July and
August), being 25,9ºC and 22,2ºC respectively.

GW Agropecuaria Ltda.
Barreiras, Bahia Brazil. CPNJ 10.906.327/0001-66
4.2

PRECIPITATION

The average annual precipitation in the region is 900 mm to 1.500 mm, and in the municipal
headquarters of Barreiras (where we obtained these data) there is an annual average of 1.122
mm. Rains occur mainly from October to April and are associated with the continental nature
of the atmospheric currents coming from the west or southeast.
The months from May to September are nearly dry, characterizing two well defined seasons in
terms of rain in the region: the rainy season (94% of total precipitation for the year), which arises
from October to April and a dry season (6% of the total precipitation for the year), which covers
the months from May to September. The months of November, December and January are the
ones that register the highest values of precipitation and is very common the occurrence of
lightning.

Barreiras: precipitation (mm)

Fig.7: Monthly rainfall average recorded at the weather station of Barreiras-Bahia during the
year of 2011. (Allmetsat)

GW Agropecuaria Ltda.
Barreiras, Bahia Brazil. CPNJ 10.906.327/0001-66
4.3

INSOLATION

In the graphic below we can see that the month with the lowest values of insolation is
November and the month with the highest insolation values is August. With greater amounts of
heat stroke in August on the order of 9 hours per day and less sunshine in November during six
hours per day. The period of intense sunlight lasts from May to September with values always
higher than 8 hours per day.

Barreiras: insolation (hours)

Fig.8: Monthly average of the number of hours of sunshine per day recorded by the
meteorological station of Barreiras - Bahia during the year of 2011 (Allmetsat).

GW Agropecuaria Ltda.
Barreiras, Bahia Brazil. CPNJ 10.906.327/0001-66
5.

EDAPHIC AND ECOLOGICAL CHARACTERIZATION

With the lithological chart of the area, we could verify that it was mainly composed of red
yellow latosols (lv). Moreover, the more humid areas (Buritis) contain hydromorphic soils. These
types of soil are characterized by a great capacity for water absorption, since they are highly
porous; making the rain waters disappears very quickly. The particle size is quite thin and there is
almost no presence of rocky material in outcrop.
Due to its composition, and although these soils being less fertile, they have a structure very
positive for any type of crop, they are of easy handling (very fine and dusty; Figure 9). These
soils are intrinsically linked to rainfall, because an intense development of the vegetation only
occurs in these conditions. Being a very thin soil, the preventive measures should be considered
for the soil not to degrade. During the summer, if soils are exposed to the wind, and in the rainy
season, the flood waters easily creep enough sediment to the lower areas.

Fig.9: Farms soil.

GW Agropecuaria Ltda.
Barreiras, Bahia Brazil. CPNJ 10.906.327/0001-66
6.

METHODOLOGY

6.1. RANDOM SAMPLING
These values were collected in the area according to random sampling, not stratified. In this
way, it is intended to reduce systematic errors in the selection of the sample plots where we
found their location (figure 10 and 11).

Fig.1 0: Distribution of plots in settlement in Santa Maria’s farm (FSPU02).

GW Agropecuaria Ltda.
Barreiras, Bahia Brazil. CPNJ 10.906.327/0001-66
Fig.11: Distribution of plots in settlement in the Vale do Buriti’s farm (FSPU09).

Whereas to evaluate the entire forest would have unbearable costs we established a suitable
number of plots to the study so that the accuracy was the best possible. Therefore, we selected
23 plots on the Vale do Buriti’s farm and 40 plots on the Santa Maria’s farm. The carried out
sampling proved to be sufficient to achieve the desired confidence level. In total 63 plots were
evaluated by widespread areas to inventory.
The formulas used to calculate the sample relatively to the forest which would be the target
inventory, was as follows:

Regarding the inference of the implicit error in the process of sampling rate, is described in the
following formulas:

GW Agropecuaria Ltda.
Barreiras, Bahia Brazil. CPNJ 10.906.327/0001-66
7.

FIELDWORK PROCEDURES

The first step performed in the field work was the identification of the plot to study, which must have a
future tree in the center. Once identified, we marked the center of the plot (future tree identified) with
red ink so that it is clearly visible in the future. After this step, we assessed the line of greatest slope. For this
procedure, it is necessary a clearance of 20 meters, where the slope is measured. To make an easier
data visualization, the person that held the clinometer and the compass, stood on higher ground where
the data slope and exposure were obtained.
All the plots studied presented a circular geometry, with an area of 500m2. The error indexed to this
measurement is negligible due to the slope of the land. To calculate the area of the plot we used the
corrected formula radius of the circle:

This process would require extra work, such as the calculator, which although not impossible, became
avoidable due to the use of a table of corrected radii. For this reason, we use a table of fixed radii, which
means that through the slope value, we could infer which the correct radius. After these steps we
proceeded to the numbering of the trees that were within the plot. For this purpose, we used a device
called Vertex. In addition to this equipment, we resorted to the use of a tape-measure to evaluate the
distance of each tree from the center of the plot. Subsequently, we recorded the azimuth values of each
tree. The measurement of the DBH and the base diameter of each tree were performed using a caliper
(figure 12) and we also registered the kind of tree (future tree or thinning tree) and the quality of the bole.

Fig.12: Fieldwork.

GW Agropecuaria Ltda.
Barreiras, Bahia Brazil. CPNJ 10.906.327/0001-66
Taking in consideration that in the future we might want to calculate the volume of a tree by diameter
classes (Hossfeld method), we selected those that were the closest to the central diameter of each class
by pointing them in the form field.
Through the help of Bitterlich relascope, readings were taken at 1,30 m diameter (DBH), half the value of
the same diameter (d/2) and the top reading (dt). These readings would serve to calculate the volume
of each class of trees. However, this has not happened because volume of the tree was estimated using
growth equations, since it is not possible to use Bitterlich relascope, due to the small size of the trees. It is
important to note that during the reading with the Bitterlich relascope, these were always made
perpendicular to the direction of measurement of the diameter of the tree.
The next step was to check the data table obtained, which the 5 dominant trees in each plot and, also 2
trees per diameter class for future trees and thinning trees. Using the Vertex we calculated the heights of
these trees previously marked (dominant trees and trees sample). For this procedure we ensured that the
operator would have full visibility either of the base or of the top of the tree, and the inclination was the
smallest possible. The aim would be to reduce the error associated with the measurement in the
population area.
In Santa Maria’s farm it was not possible to use the Bitterlich relascope. Alternatively, measurements of
various diameters were taken along the tree (base; 0,60cm; 1,30cm; 2,30cm; 3,30cm; 4,30cm). In the
forest area at Vale do Buriti’s farm we resorted to the use of Bitterlich relascope to collect some data in
order to establish the growth equations.
At the end of this procedure, were evaluated about 50 future trees and 50 thinning trees, in both forest
settlements, to achieve different growth equations.

GW Agropecuaria Ltda.
Barreiras, Bahia Brazil. CPNJ 10.906.327/0001-66
8.

MEASUREMENT AND OBSERVATION ERRORS

8.1. HUMAN ERRORS
Throughout the forest inventory process various types of mistakes can be made. One of the
most common is the exchange of values during the annotation. To avoid this error, the
appraiser should say the value aloud and the note taker should repeat it to prove that he
heard the value correctly. The use of inappropriate formulary or the incorrect processing data is
another common mistake. To bridge this error we should be make prior preparation and consult
adequate bibliography. There are also several mistakes of human nature mainly due the
different sensitivities of human sense.

8.2. MEASUREMENT ERRORS


Errors due the shape of the object to be measured;



Inaccuracies of the instruments;



Physical, topographical and climatic influences.

The errors inherent in a work of this nature can be of two types: random errors and systematic errors. The
random errors have unpredictable nature and operate in both directions of measurement (bilateral errors
- positive or negative), and may be subject to correction and/or mitigation. So that, the systematic errors
(which cannot be corrected) can be minimized if we fit the equipment and the experimentation plans to
planned study. These errors show dependence of the magnitude and of the direction of the error
(unilateral errors - positive or negative).

GW Agropecuaria Ltda.
Barreiras, Bahia Brazil. CPNJ 10.906.327/0001-66
9.

DIAMETERS MEASUREMENT RULES

The rules for measuring diameters are a standard methodology for forest inventories. Due to its
central role in these studies, it is essential the correct execution of the technique or otherwise, it
can be introduced systematic errors in the study that cannot be corrected.
In figure 13, we can observe six different cases of diameters trunk measurements, which vary
according to the slope of the terrain and to the type of trunk.

Fig.13: Measurement rules of DBH.
In case 1, on sloping ground, the diameter should be measured from the higher side, about 1,30
m from the base. In case 2, it is possible to see the most common case of the measurement of
DBH, that is, a tree which stands on a flat land. In this case, the measurement should be made
parallel to the ground level and approximately 1,30m from the base. In case 3, the land is flat
but the tree is sloped.
In this case, the diameter should be measured at the bottom side of the slope. In case 4, there
is a situation which both the ground and the tree is sloped. Therefore, the measurement should
be made on the higher side of the inclination. In case of the trees with the branching along the
zone of 1,30m, each branch must be measured individually. In the case of branches which
divide below 1,30m (case 5), we must count each branch as an independent individual. If,
otherwise, the split occurs at a height of more than 1,30m then the measurement is done
considering only an individual.
Another situation that can affect the diameter measurement is the presence of nodes, gumming or
wounds in the area of 1,30, and as such, we must measure up to a higher level, by making a comment in
the form field explaining what happened during the procedure.
GW Agropecuaria Ltda.
Barreiras, Bahia Brazil. CPNJ 10.906.327/0001-66
9.1. DOMINANT TREES
Is called dominant trees those that present a canopy above average overall of the forest area.
In this study, we measured the height of 5 dominant trees per plot. To assist the measurements
we used the Hypsometer Vertex. The height, with Hypsometer Vertex, is determined by making
two types of readings: the first reading is made targeting the Transponder, placed in the tree at
1,30m, and a second target to the top of the tree. We should be within a sufficient distance
from the tree to be able to observe the canopy top of that same tree. Unlike other instruments,
the Vertex does not take in consideration the distance that we might be from the tree. To avoid
measuring errors, particularly errors over/under evaluation, which can be made with the target
Hypsometer Vertex, we must take extreme care.

9.2. MODEL TREE
Model trees are those that represent the average values of forest area regarding the DBH. When we
were calculating the volume of model trees to the Vale do Buriti farm we resorted to Bitterlich relascope.
In this process, few can frame one of the bands, by choosing the most appropriate for the situation (the
distance of the tree depends on this option).
Measurements were made to 1,30m height, preferably in the horizontal plane and perpendicular to the
measurement made with the caliper. Then, we did a reading for the director point, where the diameter is
half of the diameter to 1,30m. At this point, the reading should be made to half scale used to 1,30m,
having 2 narrow bands in the case of band 1 or 4 bands corresponding to the band 1, where the
measurement should be on the band 4.
And finally, we made a target for the arrow tree (figure 14).

Fig.14: Measurement with the Bitterlich Relascope.

GW Agropecuaria Ltda.
Barreiras, Bahia Brazil. CPNJ 10.906.327/0001-66
9.3. WOOD VOLUME CALCULATION
The calculation of the volume of wood was made by scaling equations developed by Samuel
Reis, with the help of Professor Domingos Lopes. This consists in picking a considerable number
of trees in the population area (in this study were 50 for future and 50 for thinning ) in which the
dendrometric data are removed - in the case of the Vale do Buriti’s farm we used Bitterlich
Relascope and in Santa Maria’s farm measurement of the diameters was made along the bole.
In this study we used two different methods of evaluation, but with the same results. After
collecting all the data for future trees and thinning trees, we introduced the values separately
into the program SYSTAT. The scaling equations were correctly for each kind of tree: two for
future trees, two for thinning trees and two in which we put together the data of future trees
and thinning trees. These equations were applied equally to data from the two villages.
With these equations, the volume was calculated for all trees in the plot using the sharpest
equation, that is, the one which presents a value of R2 as close to 1. After obtaining the
individual volume for each tree, the volume was calculated for the plot by summing up all
independent volumes from each tree. At the end, we obtained a matrix with the result of all
plots, ready to be statistically evaluated.
With this process, it is possible to know the volume of each existing tree in the population area.
To this end, we simply have to know the value of the DBH or the height.
Note that these equations ensure a minimal error for trees in forest areas previously studied.
.

GW Agropecuaria Ltda.
Barreiras, Bahia Brazil. CPNJ 10.906.327/0001-66
10.

STATISTICAL ANALYSIS

To determine the volume of the population area we worked up the average calculations (ẋ),
the variance (s2), the standard deviation (s), the average variance (s 2/x), the standard error (Sx)
and the interval of confidence (IC). Thus, for the values of total volume obtained by scaling
equations, relating the volume over bark, we made the following calculations:

10.1. AVERAGE
The sample average is a measure of central tendency, which is represented by ẋ and makes a location in
the center of the sample. It is obtained from the following expression:

x – Volume average

xi – Individual volume in each plot

n – Number of plots sampled

GW Agropecuaria Ltda.
Barreiras, Bahia Brazil. CPNJ 10.906.327/0001-66
10.2. VARIANCE
In statistical terms, the variance is the measure more commonly used to quantify the variability
of a population. This measure of variation is obtained by averaging the sum of squares of the
deviations of individual values from the average population:

s2- Variance
- Sum of individual values of volume squared, per plot

2

- Sum of the volumes values volumes per plot squared

n – Number of plots sampled

10.3. STANDARD DEVIATION
In order to evaluate the variability of a population in terms of the original units, we must use the
square root of the variance, the standard deviation:

GW Agropecuaria Ltda.
Barreiras, Bahia Brazil. CPNJ 10.906.327/0001-66
10.4. VARIANCE OF AVERAGE
It is a measure of accuracy of the estimated average and it is calculated with the following
formula:

s2/x – variance of average
s2- variance
n- number of plots sampled
N - total number of plots

10.5. STANDARD ERROR
The standard error measures the dispersion of a population averages from the average of the
averages in the original units:

Sx –standard error
s- standard deviation
n- number of plots sampled
N- total number of plots

GW Agropecuaria Ltda.
Barreiras, Bahia Brazil. CPNJ 10.906.327/0001-66
10.6. SAMPLING ERROR
Defines the difference between the estimated average and actual average, and is, therefore, a
measure of exactness. The value of t depends on the level of probability chosen * and on the greatness
of sampling (n). As n approaches infinity the distribution of t tends to a normal distribution.

SE- sampling error;
Sx – standard error;
t - “t” of Student

10.7. INTERVAL OF CONFIDENCE
For probability level of 95%* and n-1 freedom degrees, we will find a value of t, which later will be used to
estimate the interval of confidence:

IC – interval of confidence
ẋ – average
Sx – standard error;
t - “t” of Student

GW Agropecuaria Ltda.
Barreiras, Bahia Brazil. CPNJ 10.906.327/0001-66
11.
11.1.

RESULTS
HYPSOMETRIC CURVES

11.1.1.

(H - HEIGHT IN METERS; D - DIAMETER IN CM)

SANTA MARIA’S FARM

The model h= a.db was adjusted for the database of Santa Maria’s farm, considering the
different types of trees:

- For future trees:

h = 2.786.d0.419

R2 = 0.632

- For thinning trees:

h = 3.515.d0.290

R2 = 0.598

- For data of thinning trees
+ future trees

h = 2.988.d0.380

R2 = 0.616

Height (m)

Comparing the 3 adjusted equations we obtained the following figure, where we can notice
differences in the profile of the trees:

Future
Thinning
Total

Diameter (cm)
Graphic 1: Comparison between the three hypsometric curves for Santa Maria’s farm.

When comparing the three equations (Graphic 1) it is perceptible that the future trees present
lower volume values from the remaining, in smaller DBHs, but as they grow up they can
overcome the remaining. Thus, its perspective is that in the future these trees will present better
performances.

GW Agropecuaria Ltda.
Barreiras, Bahia Brazil. CPNJ 10.906.327/0001-66
11.1.2.

VALE DO BURITI’S FARM

The model h=a.db was adjusted to the database of the Buriti’s Valley, considering the various
types of trees:

- For future trees:

h = 2.639.d0.547

R2 = 0.462

- For thinning trees:

h = 2.170.d0.647

R2 = 0.462

- For data of thinning trees
+ future trees

h = 2.277.d0.619

R2 = 0.455

Comparing the 3 adjusted equations we obtained the following figure, where we can notice
differences in the profile of the trees:

Height (m)

Future

Total

Thinning

Diameter (cm)

Graphic 2: Comparison between the three hypsometric curves for Vale do Buriti’s farm.
When comparing the 3 equations (Graphic 2) it is perceptive that thinning trees, present lower
volume values apart from the remaining, higher in DBHs. So, initially, its perspective is that in the
future these trees will have improved performances; and the futures trees will have worst
performances.

GW Agropecuaria Ltda.
Barreiras, Bahia Brazil. CPNJ 10.906.327/0001-66
11.2. CUBING EQUATIONS:
Then, we present the equations of adjusted cubing. They may be an important tool to the
managers of this area, since it facilitates the volume estimation of individual trees, requiring
inputs easily obtainable.

11.2.1.

SANTA MARIA’S FARM

The model v=a.db was adjusted for the database of Santa Maria, considering the various types
of trees:

- For the future trees:

v = 0.00034.d 1.896

R2 = 0.861

- For thinning trees:

v = 0.0011.d 1.258

R2 = 0.487

- For data of thinning trees
+ future TREES:

Ln (v) = -7.569+1.660 Ln (d)

R2 = 0.846

Equations comparison graphic

3

Volume (m )

Future
Thinning

Diameter (cm)
Graphic 3: Comparison between the 3 equations for the cubage for Santa Maria’s farm.

From the comparison of the 3 equations, in this case, the behavior is opposite to what was
previously thought. Initially, the future trees, to the same dimensions of DBH, had higher values
of volume, but in higher dimensions begin to have a lower behavior. This doesn’t mean that in
relation, for example, to the quality of the bole, the differences are not well marked and that
the appreciation of future trees will, nevertheless, be more pronounced.

GW Agropecuaria Ltda.
Barreiras, Bahia Brazil. CPNJ 10.906.327/0001-66
11.2.2.

VALE DO BURITI’S FARM

The model v=a.db was adjusted to the database of the Vale do Buriti’s farm, considering the
various types of trees:
- For future trees:

v=0.00014.d2.530

R2= 0.949

- For thinning trees:

v=0.000099.d2.706

R2= 0.883

- For data thinning trees
+ future trees

model Log(v)= a+b.Log(d) was adjusted :
Ln(v) = -9.034+ 2.616Ln(d)

R2= 0.950

Volume (m3)

Equations comparison graphic

Future
Thinning
Total

Diameter (cm)

Graphic 4: Comparison between the three cubage equations for Buriti’s valley farm.

Again, from the analysis of graphic 4, we can confirm that for the future we must select trees for
further criteria other than just the size. It is clear that, in our perspective, the use of adjusted
equations for the entire data can be a more balanced approach, and that can reflect the
average situation of the populations under study.

GW Agropecuaria Ltda.
Barreiras, Bahia Brazil. CPNJ 10.906.327/0001-66
11.3. SANTA MARIA’S FARM
Where 40 sample plots of 500 m2 were made, we obtain the following results:
In table 1, the volume of trees considered future;

Table 1: Volume of the future trees on Santa Maria’s farm:

Volume of future trees

x (average)

0,92

m3 /ha

Variance

0,20

(m3
ha-1)2

Standard deviation

0,45

m3 /ha

Average variance

0,01

(m3
ha-1)2

Standard error

0,07

m3 /ha

0,14

m3 /ha

SE (Sampling error)
SE%

0,15

IC (Interval of confidence)

]0,78;1,06[

GW Agropecuaria Ltda.
Barreiras, Bahia Brazil. CPNJ 10.906.327/0001-66

%

m3 /ha
In table 2, the volume of trees considered thinning;

Table 2: Volume of thinning trees on Santa Maria’s farm:

Volume of thinning trees

5,58

m3 /ha

Varience

3,93

(m3 ha1)2

Standard deviation

1,98

m3 /ha

Average variance

0,10

(m3 ha1)2

Standard error

0,31

m3 /ha

0,63

m3 /ha

x (average)

SE(Sampling error)
SE%

0,11

IC (Interval of confidence)

]4,95;6,21[

GW Agropecuaria Ltda.
Barreiras, Bahia Brazil. CPNJ 10.906.327/0001-66

%

m3 /ha
In table 3: total volume (thinning + future) of regarded trees;
Table 3: Total volume of the trees of Santa Maria’s farm:
Total volume of trees

6,50

x (average)

m3
/ha

4,17

Varience

Standard deviation

Average variance

Standard error

SE(Sampling error)
SE%

(m3
ha-1)2

2,04

m3
/ha

0,10

(m3
ha-1)2

0,32

m3
/ha

0,65

m3
/ha

0,10

IC (Interval of
confidence)

]5,85;7,15[

Fig.15: Santa Maria’s farm forest area.

GW Agropecuaria Ltda.
Barreiras, Bahia Brazil. CPNJ 10.906.327/0001-66

%
m3
/ha
Vale do Buriti’s Farm
Where 23 sample plots of 500 m2 were made, we obtain the following results:
In Table 4, the volume of the trees considered future;

Table 4: Volume of the future trees on the Vale do Buriti’s farm

Volume of future trees

6,06

m3 /ha

Variance

6,80

(m3 ha1)2

Standard deviation

2,61

m3 /ha

Average variance

0,30

(m3 ha1)2

Standard error

0,54

m3 /ha

1,12

m3 /ha

x (average)

SE (Sampling error)
SE%

0,18

IC (Interval of confidence)

]4,94;7,18[

GW Agropecuaria Ltda.
Barreiras, Bahia Brazil. CPNJ 10.906.327/0001-66

%

m3 /ha
In table 5, the volume of the trees considered thinning;

Table 5: Volume of the thinning trees on the Vale do Buriti’s farm
Volume of thinning trees

28,05

m3 /ha

Variance

42,73

(m3 ha1)2

Standard deviation

6,54

m3 /ha

Average variance

1,86

(m3 ha1)2

Standar error

1,36

m3 /ha

2,82

m3 /ha

x (average)

SE (Sampling error)
SE%

0,01

IC (Interval of confidence)

]25,23;30,87[

GW Agropecuaria Ltda. Barreiras,
Bahia Brazil. CPNJ 10.906.327/0001-66

%

m3 /ha
In table 6, the total volume (thinning + future) of regarded trees;
Table 6: Total Volume of the trees of the Vale do Buriti’s farm.
Total volume of the trees

34,11

m3 /ha

Variance

31,50

(m3 ha1)2

Standard deviation

5,61

m3 /ha

Average variance

1,37

(m3 ha1)2

Standard error

1,17

m3 /ha

2,43

m3 /ha

x (average)

SE (Sampling error)
SE%

0,07

IC (Interval of confidence)

]31,68;36,54[

Fig.16: Vale do Buriti’s farm forest area.
GW Agropecuaria Ltda.
Barreiras, Bahia Brazil. CPNJ 10.906.327/0001-66

%

m3 /ha
12.

CONCLUSIONS

The conclusions that can be drawn from this work, actually more than conclusions, and the
comments to make are subdivided into the places where this work took place. It is thought that,
thus, it is more efficient in the definition of future lines of action in each one of them.

12.1. SANTA MARIA’S FARM
Regarding the results presented above, we highlight the low sampling error which gives them
credibility.
Sampling error of the future tree volume is relatively higher because of the bigger dispersion of
sampling, namely, the fact of having few futures trees per hectare directly influences this result.
As would be expected, the results in this forest area have a higher associated error due to a
lower sampling rate in the field, which causes a difference between the sampled area and the
total forest area, very high. However, the results are very good, giving us a sampling error
around 0.1%, which cannot be considered very high compared with other studies surveyed.
The firebreaks on all perimeters of the forest areas should be as wide as possible and should be
kept clean whenever possible. It is essential that at the time of the dry season this should always
be without vegetation.
With regard to the high quality boles intended for these forest settlements, pruning should be
done up to 4-5 meters height. Thus, these same pruning must take into account the cut
branches so that they do not exceed 2cm in diameter. In the general forest area, we should
regard the constant competition between the trees, so that they grow as much as possible,
along with gains in its diameter, with particular attention to the thinning performed.

GW Agropecuaria Ltda.
Barreiras, Bahia Brazil. CPNJ 10.906.327/0001-66
12.2. VALE DO BURITI’S FARM
Regarding the results of the Vale do Buriti’s farm, presented earlier. Again the sampling error of
the future tree volume is relatively high, due to the same reasons given above. As would be
expected, the results in this population area have a lower associated error due to a higher
sampling rate field, which causes a difference between the sampled area and the total forest
area, smaller. Nevertheless, the results are very good and give us sampling errors around 0.07%,
which is very low.
Thus, for the Vale do Buriti’s farm we achieved an average volume of 34,1m3/ha in all the trees.
Considering their age and reasonable handling in the first months of life it is a very satisfactory
value, being possible to achieve, without a doubt, a higher value.
We must bear in mind that the years of the largest increases in volume are still to come, and
may be possible to achieve the annual average volume initially expected.
In the case of this forest area we have a value of future trees per hectare quite reasonable
making the choice of trees that will make to harvest easier, as we have a larger number of trees
to choose from. This number of future trees, along with a proper fertilization and forestry
management, can be translated into a very productive and homogeneous forest area.
In this population area there are some risk factors identical to those of Santa Maria’s farm.
As for the boles intended for these forest areas, we can evaluate that they are of great quality,
and there are one or another individual tree with this desirable quality. Even so, the bole up to
4-5 meters high must be kept free of branching. So, pruning must take into account the cut
branches, so that they do not exceed two cm in diameter. In the general population area we
should take in consideration the constant competition between the trees so that they grow
together with the greatest possible gains in diameter, and thus special attention to the thinning
that might be made.

GW Agropecuaria Ltda.
Barreiras, Bahia Brazil. CPNJ 10.906.327/0001-66
13.

BIBLIOGRAPHIC REFERENCES

- MARQUES, C.P., FONSECA, T., 2006, “Apontamentos de Inventário florestal”, UTAD, Vila Real.

-MARQUES, C.P., LOPES, D., FONSECA, T., 2007, “Apontamentos de Dendrometria”, UTAD, Vila
Real.

-ALLMETSAT, 13-12-2012, http://pt.allmetsat.com/clima/brasil.php?code=83236.

-INMET, 13-12-2012, http://www.inmet.gov.br/portal/.

-EMBASA, 13-12-2012, www.embasa.ba.gov.br.

-IPEF, 15-01-2013, http://www.ipef.br/identificacao/acacia.mangium.asp

GW Agropecuaria Ltda.
Barreiras, Bahia Brazil. CPNJ 10.906.327/0001-66
ANNEXES

GW Agropecuaria Ltda.
Barreiras, Bahia Brazil. CPNJ 10.906.327/0001-66
Plots Map – Santa Maria

GW Agropecuaria Ltda.
Barreiras, Bahia Brazil. CPNJ 10.906.327/0001-66
Plots Maps – Vale do Buriti

GW Agropecuaria Ltda.
Barreiras, Bahia Brazil. CPNJ 10.906.327/0001-66
Precipitation Graphic from City of Barreiras

GW Agropecuaria Ltda.
Barreiras, Bahia Brazil. CPNJ 10.906.327/0001-66

Weitere ähnliche Inhalte

Ähnlich wie GW Group Independent forestry investment report acacia crops Brazil

UN Redd Programme 2011-2015 Strategy - English
UN Redd Programme 2011-2015 Strategy - EnglishUN Redd Programme 2011-2015 Strategy - English
UN Redd Programme 2011-2015 Strategy - Englishaditya
 
Draft evalreport en_revisedaug29
Draft evalreport en_revisedaug29Draft evalreport en_revisedaug29
Draft evalreport en_revisedaug29Dr Lendy Spires
 
Uruguay Case Study - NAP-Ag Programme
Uruguay Case Study - NAP-Ag ProgrammeUruguay Case Study - NAP-Ag Programme
Uruguay Case Study - NAP-Ag ProgrammeUNDP Climate
 
Technical considerations in identification of Adaptation Technologies in the ...
Technical considerations in identification of Adaptation Technologies in the ...Technical considerations in identification of Adaptation Technologies in the ...
Technical considerations in identification of Adaptation Technologies in the ...Dr. Joshua Zake
 
P26032 lrg-newsletter-december-2013 fa-hr(1)
P26032 lrg-newsletter-december-2013 fa-hr(1)P26032 lrg-newsletter-december-2013 fa-hr(1)
P26032 lrg-newsletter-december-2013 fa-hr(1)REMEDIAnetwork
 
Strategy and framework for developing text
Strategy and framework for developing textStrategy and framework for developing text
Strategy and framework for developing textcenafrica
 
Collaboration letter taxonomist
Collaboration letter taxonomistCollaboration letter taxonomist
Collaboration letter taxonomisttoniespeleo
 
2828_Forestry_Conference book for print
2828_Forestry_Conference book for print2828_Forestry_Conference book for print
2828_Forestry_Conference book for printManoj Neupane
 
Tranzfo rprogress18month hobart-1
Tranzfo rprogress18month hobart-1Tranzfo rprogress18month hobart-1
Tranzfo rprogress18month hobart-1basco
 
Technology Needs Assessment for Climate Change Adaptation in the Forestry Sec...
Technology Needs Assessment for Climate Change Adaptation in the Forestry Sec...Technology Needs Assessment for Climate Change Adaptation in the Forestry Sec...
Technology Needs Assessment for Climate Change Adaptation in the Forestry Sec...Dr. Joshua Zake
 
Fao agroforestry working paper
Fao agroforestry working paperFao agroforestry working paper
Fao agroforestry working paperCarol Daemon
 
Climate ChangeMonitoring Guide_Final
Climate ChangeMonitoring Guide_FinalClimate ChangeMonitoring Guide_Final
Climate ChangeMonitoring Guide_FinalDavid Ochanda
 
Kasturi Rangan Report on Western Ghats Part -1
Kasturi Rangan Report on Western Ghats Part -1Kasturi Rangan Report on Western Ghats Part -1
Kasturi Rangan Report on Western Ghats Part -1Febin Wilson
 
Discovering New Oil Fields: Small-Scale Local Biofuel Production and Use in R...
Discovering New Oil Fields: Small-Scale Local Biofuel Production and Use in R...Discovering New Oil Fields: Small-Scale Local Biofuel Production and Use in R...
Discovering New Oil Fields: Small-Scale Local Biofuel Production and Use in R...ZY8
 
color stability of beet (beta vulgaris L) dyes label during heating
color stability of beet (beta vulgaris L) dyes label during heatingcolor stability of beet (beta vulgaris L) dyes label during heating
color stability of beet (beta vulgaris L) dyes label during heatingRepository Ipb
 
adsorption of carotenoid from palm oil methyl ester by using attapulgite andd...
adsorption of carotenoid from palm oil methyl ester by using attapulgite andd...adsorption of carotenoid from palm oil methyl ester by using attapulgite andd...
adsorption of carotenoid from palm oil methyl ester by using attapulgite andd...Repository Ipb
 
study of white crystal sugar distribution system in indonesia
study of white crystal sugar distribution system in indonesia study of white crystal sugar distribution system in indonesia
study of white crystal sugar distribution system in indonesia Repository Ipb
 
Precipitation classification using LVQ on dry season based on global climate ...
Precipitation classification using LVQ on dry season based on global climate ...Precipitation classification using LVQ on dry season based on global climate ...
Precipitation classification using LVQ on dry season based on global climate ...Repository Ipb
 
Wood Indentification Type By Using Support Vector Machine - Based Image
Wood Indentification Type By Using Support Vector Machine - Based Image Wood Indentification Type By Using Support Vector Machine - Based Image
Wood Indentification Type By Using Support Vector Machine - Based Image Repository Ipb
 

Ähnlich wie GW Group Independent forestry investment report acacia crops Brazil (20)

UN Redd Programme 2011-2015 Strategy - English
UN Redd Programme 2011-2015 Strategy - EnglishUN Redd Programme 2011-2015 Strategy - English
UN Redd Programme 2011-2015 Strategy - English
 
Draft evalreport en_revisedaug29
Draft evalreport en_revisedaug29Draft evalreport en_revisedaug29
Draft evalreport en_revisedaug29
 
Uruguay Case Study - NAP-Ag Programme
Uruguay Case Study - NAP-Ag ProgrammeUruguay Case Study - NAP-Ag Programme
Uruguay Case Study - NAP-Ag Programme
 
Technical considerations in identification of Adaptation Technologies in the ...
Technical considerations in identification of Adaptation Technologies in the ...Technical considerations in identification of Adaptation Technologies in the ...
Technical considerations in identification of Adaptation Technologies in the ...
 
P26032 lrg-newsletter-december-2013 fa-hr(1)
P26032 lrg-newsletter-december-2013 fa-hr(1)P26032 lrg-newsletter-december-2013 fa-hr(1)
P26032 lrg-newsletter-december-2013 fa-hr(1)
 
Strategy and framework for developing text
Strategy and framework for developing textStrategy and framework for developing text
Strategy and framework for developing text
 
Collaboration letter taxonomist
Collaboration letter taxonomistCollaboration letter taxonomist
Collaboration letter taxonomist
 
2828_Forestry_Conference book for print
2828_Forestry_Conference book for print2828_Forestry_Conference book for print
2828_Forestry_Conference book for print
 
Tranzfo rprogress18month hobart-1
Tranzfo rprogress18month hobart-1Tranzfo rprogress18month hobart-1
Tranzfo rprogress18month hobart-1
 
Technology Needs Assessment for Climate Change Adaptation in the Forestry Sec...
Technology Needs Assessment for Climate Change Adaptation in the Forestry Sec...Technology Needs Assessment for Climate Change Adaptation in the Forestry Sec...
Technology Needs Assessment for Climate Change Adaptation in the Forestry Sec...
 
Fao agroforestry working paper
Fao agroforestry working paperFao agroforestry working paper
Fao agroforestry working paper
 
Climate ChangeMonitoring Guide_Final
Climate ChangeMonitoring Guide_FinalClimate ChangeMonitoring Guide_Final
Climate ChangeMonitoring Guide_Final
 
Kasturi Rangan Report on Western Ghats Part -1
Kasturi Rangan Report on Western Ghats Part -1Kasturi Rangan Report on Western Ghats Part -1
Kasturi Rangan Report on Western Ghats Part -1
 
Discovering New Oil Fields: Small-Scale Local Biofuel Production and Use in R...
Discovering New Oil Fields: Small-Scale Local Biofuel Production and Use in R...Discovering New Oil Fields: Small-Scale Local Biofuel Production and Use in R...
Discovering New Oil Fields: Small-Scale Local Biofuel Production and Use in R...
 
Ecotourism thesis
Ecotourism thesis Ecotourism thesis
Ecotourism thesis
 
color stability of beet (beta vulgaris L) dyes label during heating
color stability of beet (beta vulgaris L) dyes label during heatingcolor stability of beet (beta vulgaris L) dyes label during heating
color stability of beet (beta vulgaris L) dyes label during heating
 
adsorption of carotenoid from palm oil methyl ester by using attapulgite andd...
adsorption of carotenoid from palm oil methyl ester by using attapulgite andd...adsorption of carotenoid from palm oil methyl ester by using attapulgite andd...
adsorption of carotenoid from palm oil methyl ester by using attapulgite andd...
 
study of white crystal sugar distribution system in indonesia
study of white crystal sugar distribution system in indonesia study of white crystal sugar distribution system in indonesia
study of white crystal sugar distribution system in indonesia
 
Precipitation classification using LVQ on dry season based on global climate ...
Precipitation classification using LVQ on dry season based on global climate ...Precipitation classification using LVQ on dry season based on global climate ...
Precipitation classification using LVQ on dry season based on global climate ...
 
Wood Indentification Type By Using Support Vector Machine - Based Image
Wood Indentification Type By Using Support Vector Machine - Based Image Wood Indentification Type By Using Support Vector Machine - Based Image
Wood Indentification Type By Using Support Vector Machine - Based Image
 

Mehr von GW Group

GW Group Eucalyptus
GW Group Eucalyptus GW Group Eucalyptus
GW Group Eucalyptus GW Group
 
GW Group Independent growth and yield projections for Acacia tree crops grown...
GW Group Independent growth and yield projections for Acacia tree crops grown...GW Group Independent growth and yield projections for Acacia tree crops grown...
GW Group Independent growth and yield projections for Acacia tree crops grown...GW Group
 
GW Group Phase 2 report Christmas tree Project Canada
GW Group Phase 2 report Christmas tree Project CanadaGW Group Phase 2 report Christmas tree Project Canada
GW Group Phase 2 report Christmas tree Project CanadaGW Group
 
GW Group Phase1 rpt Christmas tree forestry investments Canada
GW Group Phase1 rpt Christmas tree forestry investments CanadaGW Group Phase1 rpt Christmas tree forestry investments Canada
GW Group Phase1 rpt Christmas tree forestry investments CanadaGW Group
 
GW Group farm property Buriti plantation plan
GW Group farm property Buriti plantation planGW Group farm property Buriti plantation plan
GW Group farm property Buriti plantation planGW Group
 
GW Group farm property site development S.Maria I plantation plan
GW Group farm property site development S.Maria I plantation planGW Group farm property site development S.Maria I plantation plan
GW Group farm property site development S.Maria I plantation planGW Group
 
GW Group reforestation Licenses esmeralda
GW Group reforestation Licenses esmeraldaGW Group reforestation Licenses esmeralda
GW Group reforestation Licenses esmeraldaGW Group
 
GW Group reforestation Licenses vale do buriti
GW Group reforestation Licenses vale do buritiGW Group reforestation Licenses vale do buriti
GW Group reforestation Licenses vale do buritiGW Group
 
GW Group reforestation Licenses Farm Development Site S. Maria I
GW Group reforestation Licenses Farm Development Site S. Maria IGW Group reforestation Licenses Farm Development Site S. Maria I
GW Group reforestation Licenses Farm Development Site S. Maria IGW Group
 
GW Group reforestation Licenses Farm Site Development Buriti
GW Group reforestation Licenses Farm Site Development BuritiGW Group reforestation Licenses Farm Site Development Buriti
GW Group reforestation Licenses Farm Site Development BuritiGW Group
 
GW Group reforestation Licenses Farm Site Barrinhas 2
GW Group reforestation Licenses Farm Site Barrinhas 2GW Group reforestation Licenses Farm Site Barrinhas 2
GW Group reforestation Licenses Farm Site Barrinhas 2GW Group
 
GW Group reforestation Licenses Farm site Barrinhas 1
GW Group reforestation Licenses Farm site Barrinhas 1GW Group reforestation Licenses Farm site Barrinhas 1
GW Group reforestation Licenses Farm site Barrinhas 1GW Group
 
GW Group reforestation Licenses tropical
GW Group reforestation Licenses tropicalGW Group reforestation Licenses tropical
GW Group reforestation Licenses tropicalGW Group
 
GW Group farm property site Tropical
GW Group farm property site Tropical GW Group farm property site Tropical
GW Group farm property site Tropical GW Group
 
GW Group Technical forestry report Teak Costa Rica
GW Group Technical forestry report Teak Costa Rica GW Group Technical forestry report Teak Costa Rica
GW Group Technical forestry report Teak Costa Rica GW Group
 
GW Group Technical forestry report astronium Costa Rica
GW Group Technical forestry report astronium Costa Rica GW Group Technical forestry report astronium Costa Rica
GW Group Technical forestry report astronium Costa Rica GW Group
 
GW Group Technical Financial analysis terminalia_amazonia
GW Group Technical Financial analysis terminalia_amazoniaGW Group Technical Financial analysis terminalia_amazonia
GW Group Technical Financial analysis terminalia_amazoniaGW Group
 
GW Group Forestry Investment Financial Analysis Teak in Costa Rica
GW Group Forestry Investment Financial Analysis Teak in Costa RicaGW Group Forestry Investment Financial Analysis Teak in Costa Rica
GW Group Forestry Investment Financial Analysis Teak in Costa RicaGW Group
 
GW Group Forestry Investment Financial Analysis astronium in Costa Rica
GW Group Forestry Investment Financial Analysis astronium in Costa RicaGW Group Forestry Investment Financial Analysis astronium in Costa Rica
GW Group Forestry Investment Financial Analysis astronium in Costa RicaGW Group
 
GW Group Technical forestry report terminalia Costa Rica
GW Group Technical forestry report terminalia Costa RicaGW Group Technical forestry report terminalia Costa Rica
GW Group Technical forestry report terminalia Costa RicaGW Group
 

Mehr von GW Group (20)

GW Group Eucalyptus
GW Group Eucalyptus GW Group Eucalyptus
GW Group Eucalyptus
 
GW Group Independent growth and yield projections for Acacia tree crops grown...
GW Group Independent growth and yield projections for Acacia tree crops grown...GW Group Independent growth and yield projections for Acacia tree crops grown...
GW Group Independent growth and yield projections for Acacia tree crops grown...
 
GW Group Phase 2 report Christmas tree Project Canada
GW Group Phase 2 report Christmas tree Project CanadaGW Group Phase 2 report Christmas tree Project Canada
GW Group Phase 2 report Christmas tree Project Canada
 
GW Group Phase1 rpt Christmas tree forestry investments Canada
GW Group Phase1 rpt Christmas tree forestry investments CanadaGW Group Phase1 rpt Christmas tree forestry investments Canada
GW Group Phase1 rpt Christmas tree forestry investments Canada
 
GW Group farm property Buriti plantation plan
GW Group farm property Buriti plantation planGW Group farm property Buriti plantation plan
GW Group farm property Buriti plantation plan
 
GW Group farm property site development S.Maria I plantation plan
GW Group farm property site development S.Maria I plantation planGW Group farm property site development S.Maria I plantation plan
GW Group farm property site development S.Maria I plantation plan
 
GW Group reforestation Licenses esmeralda
GW Group reforestation Licenses esmeraldaGW Group reforestation Licenses esmeralda
GW Group reforestation Licenses esmeralda
 
GW Group reforestation Licenses vale do buriti
GW Group reforestation Licenses vale do buritiGW Group reforestation Licenses vale do buriti
GW Group reforestation Licenses vale do buriti
 
GW Group reforestation Licenses Farm Development Site S. Maria I
GW Group reforestation Licenses Farm Development Site S. Maria IGW Group reforestation Licenses Farm Development Site S. Maria I
GW Group reforestation Licenses Farm Development Site S. Maria I
 
GW Group reforestation Licenses Farm Site Development Buriti
GW Group reforestation Licenses Farm Site Development BuritiGW Group reforestation Licenses Farm Site Development Buriti
GW Group reforestation Licenses Farm Site Development Buriti
 
GW Group reforestation Licenses Farm Site Barrinhas 2
GW Group reforestation Licenses Farm Site Barrinhas 2GW Group reforestation Licenses Farm Site Barrinhas 2
GW Group reforestation Licenses Farm Site Barrinhas 2
 
GW Group reforestation Licenses Farm site Barrinhas 1
GW Group reforestation Licenses Farm site Barrinhas 1GW Group reforestation Licenses Farm site Barrinhas 1
GW Group reforestation Licenses Farm site Barrinhas 1
 
GW Group reforestation Licenses tropical
GW Group reforestation Licenses tropicalGW Group reforestation Licenses tropical
GW Group reforestation Licenses tropical
 
GW Group farm property site Tropical
GW Group farm property site Tropical GW Group farm property site Tropical
GW Group farm property site Tropical
 
GW Group Technical forestry report Teak Costa Rica
GW Group Technical forestry report Teak Costa Rica GW Group Technical forestry report Teak Costa Rica
GW Group Technical forestry report Teak Costa Rica
 
GW Group Technical forestry report astronium Costa Rica
GW Group Technical forestry report astronium Costa Rica GW Group Technical forestry report astronium Costa Rica
GW Group Technical forestry report astronium Costa Rica
 
GW Group Technical Financial analysis terminalia_amazonia
GW Group Technical Financial analysis terminalia_amazoniaGW Group Technical Financial analysis terminalia_amazonia
GW Group Technical Financial analysis terminalia_amazonia
 
GW Group Forestry Investment Financial Analysis Teak in Costa Rica
GW Group Forestry Investment Financial Analysis Teak in Costa RicaGW Group Forestry Investment Financial Analysis Teak in Costa Rica
GW Group Forestry Investment Financial Analysis Teak in Costa Rica
 
GW Group Forestry Investment Financial Analysis astronium in Costa Rica
GW Group Forestry Investment Financial Analysis astronium in Costa RicaGW Group Forestry Investment Financial Analysis astronium in Costa Rica
GW Group Forestry Investment Financial Analysis astronium in Costa Rica
 
GW Group Technical forestry report terminalia Costa Rica
GW Group Technical forestry report terminalia Costa RicaGW Group Technical forestry report terminalia Costa Rica
GW Group Technical forestry report terminalia Costa Rica
 

Kürzlich hochgeladen

9654467111 Call Girls In Katwaria Sarai Short 1500 Night 6000
9654467111 Call Girls In Katwaria Sarai Short 1500 Night 60009654467111 Call Girls In Katwaria Sarai Short 1500 Night 6000
9654467111 Call Girls In Katwaria Sarai Short 1500 Night 6000Sapana Sha
 
9654467111 Low Rate Call Girls In Tughlakabad, Delhi NCR
9654467111 Low Rate Call Girls In Tughlakabad, Delhi NCR9654467111 Low Rate Call Girls In Tughlakabad, Delhi NCR
9654467111 Low Rate Call Girls In Tughlakabad, Delhi NCRSapana Sha
 
如何办理伦敦大学毕业证(文凭)London学位证书
如何办理伦敦大学毕业证(文凭)London学位证书如何办理伦敦大学毕业证(文凭)London学位证书
如何办理伦敦大学毕业证(文凭)London学位证书Fis s
 
WheelTug PLC Pitch Deck | Investor Insights | April 2024
WheelTug PLC Pitch Deck | Investor Insights | April 2024WheelTug PLC Pitch Deck | Investor Insights | April 2024
WheelTug PLC Pitch Deck | Investor Insights | April 2024Hector Del Castillo, CPM, CPMM
 
No 1 AMil Baba In Islamabad No 1 Amil Baba In Lahore No 1 Amil Baba In Faisl...
No 1 AMil Baba In Islamabad  No 1 Amil Baba In Lahore No 1 Amil Baba In Faisl...No 1 AMil Baba In Islamabad  No 1 Amil Baba In Lahore No 1 Amil Baba In Faisl...
No 1 AMil Baba In Islamabad No 1 Amil Baba In Lahore No 1 Amil Baba In Faisl...First NO1 World Amil baba in Faisalabad
 
Basic Accountants in|TaxlinkConcept.pdf
Basic  Accountants in|TaxlinkConcept.pdfBasic  Accountants in|TaxlinkConcept.pdf
Basic Accountants in|TaxlinkConcept.pdftaxlinkcpa
 
Nicola Mining Inc. Corporate Presentation April 2024
Nicola Mining Inc. Corporate Presentation April 2024Nicola Mining Inc. Corporate Presentation April 2024
Nicola Mining Inc. Corporate Presentation April 2024nicola_mining
 
slideshare_2404_presentation materials_en.pdf
slideshare_2404_presentation materials_en.pdfslideshare_2404_presentation materials_en.pdf
slideshare_2404_presentation materials_en.pdfsansanir
 
如何办理东俄勒冈大学毕业证(文凭)EOU学位证书
如何办理东俄勒冈大学毕业证(文凭)EOU学位证书如何办理东俄勒冈大学毕业证(文凭)EOU学位证书
如何办理东俄勒冈大学毕业证(文凭)EOU学位证书Fir La
 
The Concept of Humanity in Islam and its effects at future of humanity
The Concept of Humanity in Islam and its effects at future of humanityThe Concept of Humanity in Islam and its effects at future of humanity
The Concept of Humanity in Islam and its effects at future of humanityJohanAspro
 
Methanex Investor Presentation (April 2024)
Methanex Investor Presentation (April 2024)Methanex Investor Presentation (April 2024)
Methanex Investor Presentation (April 2024)Methanex Corporation
 
The resilient U.S. late-cycle expansion contributed to a stalling pattern in ...
The resilient U.S. late-cycle expansion contributed to a stalling pattern in ...The resilient U.S. late-cycle expansion contributed to a stalling pattern in ...
The resilient U.S. late-cycle expansion contributed to a stalling pattern in ...Kumaran637735
 
定制(UWIC毕业证书)英国卡迪夫城市大学毕业证成绩单原版一比一
定制(UWIC毕业证书)英国卡迪夫城市大学毕业证成绩单原版一比一定制(UWIC毕业证书)英国卡迪夫城市大学毕业证成绩单原版一比一
定制(UWIC毕业证书)英国卡迪夫城市大学毕业证成绩单原版一比一Fir La
 
如何办理密苏里大学堪萨斯分校毕业证(文凭)UMKC学位证书
如何办理密苏里大学堪萨斯分校毕业证(文凭)UMKC学位证书如何办理密苏里大学堪萨斯分校毕业证(文凭)UMKC学位证书
如何办理密苏里大学堪萨斯分校毕业证(文凭)UMKC学位证书Fir La
 
如何办理(UTS毕业证书)悉尼科技大学毕业证学位证书
如何办理(UTS毕业证书)悉尼科技大学毕业证学位证书如何办理(UTS毕业证书)悉尼科技大学毕业证学位证书
如何办理(UTS毕业证书)悉尼科技大学毕业证学位证书Fis s
 
如何办理北卡罗来纳大学教堂山分校毕业证(文凭)UNC学位证书
如何办理北卡罗来纳大学教堂山分校毕业证(文凭)UNC学位证书如何办理北卡罗来纳大学教堂山分校毕业证(文凭)UNC学位证书
如何办理北卡罗来纳大学教堂山分校毕业证(文凭)UNC学位证书Fir La
 

Kürzlich hochgeladen (20)

young call girls in Govindpuri 🔝 9953056974 🔝 Delhi escort Service
young call girls in Govindpuri 🔝 9953056974 🔝 Delhi escort Serviceyoung call girls in Govindpuri 🔝 9953056974 🔝 Delhi escort Service
young call girls in Govindpuri 🔝 9953056974 🔝 Delhi escort Service
 
9654467111 Call Girls In Katwaria Sarai Short 1500 Night 6000
9654467111 Call Girls In Katwaria Sarai Short 1500 Night 60009654467111 Call Girls In Katwaria Sarai Short 1500 Night 6000
9654467111 Call Girls In Katwaria Sarai Short 1500 Night 6000
 
9654467111 Low Rate Call Girls In Tughlakabad, Delhi NCR
9654467111 Low Rate Call Girls In Tughlakabad, Delhi NCR9654467111 Low Rate Call Girls In Tughlakabad, Delhi NCR
9654467111 Low Rate Call Girls In Tughlakabad, Delhi NCR
 
如何办理伦敦大学毕业证(文凭)London学位证书
如何办理伦敦大学毕业证(文凭)London学位证书如何办理伦敦大学毕业证(文凭)London学位证书
如何办理伦敦大学毕业证(文凭)London学位证书
 
Model Call Girl in Uttam Nagar Delhi reach out to us at 🔝9953056974🔝
Model Call Girl in Uttam Nagar Delhi reach out to us at 🔝9953056974🔝Model Call Girl in Uttam Nagar Delhi reach out to us at 🔝9953056974🔝
Model Call Girl in Uttam Nagar Delhi reach out to us at 🔝9953056974🔝
 
WheelTug PLC Pitch Deck | Investor Insights | April 2024
WheelTug PLC Pitch Deck | Investor Insights | April 2024WheelTug PLC Pitch Deck | Investor Insights | April 2024
WheelTug PLC Pitch Deck | Investor Insights | April 2024
 
No 1 AMil Baba In Islamabad No 1 Amil Baba In Lahore No 1 Amil Baba In Faisl...
No 1 AMil Baba In Islamabad  No 1 Amil Baba In Lahore No 1 Amil Baba In Faisl...No 1 AMil Baba In Islamabad  No 1 Amil Baba In Lahore No 1 Amil Baba In Faisl...
No 1 AMil Baba In Islamabad No 1 Amil Baba In Lahore No 1 Amil Baba In Faisl...
 
Basic Accountants in|TaxlinkConcept.pdf
Basic  Accountants in|TaxlinkConcept.pdfBasic  Accountants in|TaxlinkConcept.pdf
Basic Accountants in|TaxlinkConcept.pdf
 
Nicola Mining Inc. Corporate Presentation April 2024
Nicola Mining Inc. Corporate Presentation April 2024Nicola Mining Inc. Corporate Presentation April 2024
Nicola Mining Inc. Corporate Presentation April 2024
 
slideshare_2404_presentation materials_en.pdf
slideshare_2404_presentation materials_en.pdfslideshare_2404_presentation materials_en.pdf
slideshare_2404_presentation materials_en.pdf
 
如何办理东俄勒冈大学毕业证(文凭)EOU学位证书
如何办理东俄勒冈大学毕业证(文凭)EOU学位证书如何办理东俄勒冈大学毕业证(文凭)EOU学位证书
如何办理东俄勒冈大学毕业证(文凭)EOU学位证书
 
The Concept of Humanity in Islam and its effects at future of humanity
The Concept of Humanity in Islam and its effects at future of humanityThe Concept of Humanity in Islam and its effects at future of humanity
The Concept of Humanity in Islam and its effects at future of humanity
 
Methanex Investor Presentation (April 2024)
Methanex Investor Presentation (April 2024)Methanex Investor Presentation (April 2024)
Methanex Investor Presentation (April 2024)
 
The resilient U.S. late-cycle expansion contributed to a stalling pattern in ...
The resilient U.S. late-cycle expansion contributed to a stalling pattern in ...The resilient U.S. late-cycle expansion contributed to a stalling pattern in ...
The resilient U.S. late-cycle expansion contributed to a stalling pattern in ...
 
Model Call Girl in Udyog Vihar Delhi reach out to us at 🔝9953056974🔝
Model Call Girl in Udyog Vihar Delhi reach out to us at 🔝9953056974🔝Model Call Girl in Udyog Vihar Delhi reach out to us at 🔝9953056974🔝
Model Call Girl in Udyog Vihar Delhi reach out to us at 🔝9953056974🔝
 
定制(UWIC毕业证书)英国卡迪夫城市大学毕业证成绩单原版一比一
定制(UWIC毕业证书)英国卡迪夫城市大学毕业证成绩单原版一比一定制(UWIC毕业证书)英国卡迪夫城市大学毕业证成绩单原版一比一
定制(UWIC毕业证书)英国卡迪夫城市大学毕业证成绩单原版一比一
 
young call girls in Hauz Khas,🔝 9953056974 🔝 escort Service
young call girls in Hauz Khas,🔝 9953056974 🔝 escort Serviceyoung call girls in Hauz Khas,🔝 9953056974 🔝 escort Service
young call girls in Hauz Khas,🔝 9953056974 🔝 escort Service
 
如何办理密苏里大学堪萨斯分校毕业证(文凭)UMKC学位证书
如何办理密苏里大学堪萨斯分校毕业证(文凭)UMKC学位证书如何办理密苏里大学堪萨斯分校毕业证(文凭)UMKC学位证书
如何办理密苏里大学堪萨斯分校毕业证(文凭)UMKC学位证书
 
如何办理(UTS毕业证书)悉尼科技大学毕业证学位证书
如何办理(UTS毕业证书)悉尼科技大学毕业证学位证书如何办理(UTS毕业证书)悉尼科技大学毕业证学位证书
如何办理(UTS毕业证书)悉尼科技大学毕业证学位证书
 
如何办理北卡罗来纳大学教堂山分校毕业证(文凭)UNC学位证书
如何办理北卡罗来纳大学教堂山分校毕业证(文凭)UNC学位证书如何办理北卡罗来纳大学教堂山分校毕业证(文凭)UNC学位证书
如何办理北卡罗来纳大学教堂山分校毕业证(文凭)UNC学位证书
 

GW Group Independent forestry investment report acacia crops Brazil

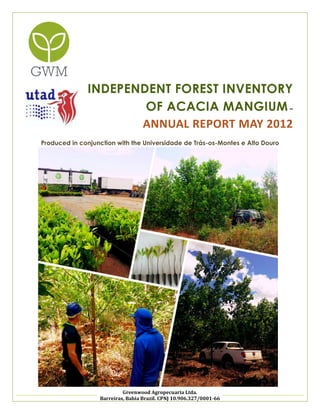
  • 1. INDEPENDENT FOREST INVENTORY OF ACACIA MANGIUM – ANNUAL REPORT MAY 2012 Produced in conjunction with the Universidade de Trás-os-Montes e Alto Douro GW Agropecuaria Ltda. Barreiras, Bahia Brazil. CPNJ10.906.327/0001-66
  • 2. TABLE OF CONTENTS 1 1. Introduction .................................................................................................................... 3 1.1. Species characterization .................................................................................................................................................. 5 1.2. Main Goals ............................................................................................................................................................................ 6 2. Field Material.................................................................................................................. 7 3. Area characterization ................................................................................................. 8 3.1 Vale do buriti farm .............................................................................................................................................................. 8 3.2 Santa Maria Farm ................................................................................................................................................................ 8 4. Climate characterization ........................................................................................... 9 4.1 Temperature ......................................................................................................................................................................... 9 4.2 Precipitation........................................................................................................................................................................ 10 4.3 Insolation .............................................................................................................................................................................. 11 5. Edaphic and ecological characterization .......................................................... 12 6. Methodology ............................................................................................................... 13 6.1. Random sampling ............................................................................................................................................................. 13 7. Fieldwork procedures ................................................................................................ 15 8. Measurement and observation errors .................................................................. 17 8.1. Human Errors ....................................................................................................................................................................... 17 8.2. Measurement errors .......................................................................................................................................................... 17 9. Diameters measurement rules ................................................................................ 18 9.1. Dominant trees .................................................................................................................................................................. 19 9.2. Model Tree .......................................................................................................................................................................... 19 9.3. Wood volume calculation .............................................................................................................................................. 20 10. Statistical analysis ........................................................................................................ 21 10.1. Average ............................................................................................................................................................................... 21 10.2. Variance .............................................................................................................................................................................. 22 10.3. Standard Deviation .......................................................................................................................................................... 22 10.4. Variance of average ....................................................................................................................................................... 23 10.5. Standard Error..................................................................................................................................................................... 23 10.6. Sampling Error..................................................................................................................................................................... 24 10.7. Interval of Confidence .................................................................................................................................................... 24 11. Results ............................................................................................................................. 25 11.1. Hypsometric Curves (h - height in meters; d - diameter in cm) ........................................................................... 25 11.1.1. Santa Maria’s Farm .................................................................................................................................................. 25 11.1.2. Vale do Buriti’s Farm ................................................................................................................................................ 26 11.2. Cubing Equations: ............................................................................................................................................................. 27 11.2.1. Santa Maria’s Farm .................................................................................................................................................. 27 11.2.2. Vale do Buriti’s farm ................................................................................................................................................. 28 11.3. Santa Maria’s Farm ........................................................................................................................................................... 29 12. Conclusions .................................................................................................................. 35 12.1. Santa Maria’s Farm ........................................................................................................................................................... 35 12.2. Vale do Buriti’s Farm ......................................................................................................................................................... 36 13. Bibliographic References ......................................................................................... 37 GW Agropecuaria Ltda. Barreiras, Bahia Brazil. CPNJ 10.906.327/0001-66
  • 3. 1. INTRODUCTION GW Group introduction The 2012 GW Group (Brazil) Annual Report dated, May 11th 2013, has been compiled in conjunction with the Post Graduate Masters’ students of Universidade de Trás-os-Montes e Alto Douro (UTAD), http://www.utad.pt/vPT/Paginas/HomepageUtad.aspx, overseen by Assistant Professor Domingos Lopes. The studies took place during November/ December 2012. The primary objectives of the 2012 UTAD study was to provide a detailed independent forestry inventory on two mixed species plantations belonging to the GW Group. Such studies would characterize the geographic area, climatic conditions, soil conditions, work procedures, volumes of wood production per hectare; based on random area sampling (to evaluate the entire plantations is logistically unfeasible). In total 63 plots were evaluated and wood productions rates were calculated via a “SYSTAT” program, details of which are contained within the document. The report was originally composed in Portuguese and has been subsequently translated and signed off by UTAD - no textual changes have been made in order to retain the integrity of the document. In this report, UTAD have focused their studies in particular in the Acacia Mangium tree species, with the intention for the following report (2) by UTAD, to focus on Eucalyptus and several other tree species currently under management by the GW Group in Bahia state Brazil. These studies will commence several months in advance of those conducted in 2012 (July onwards) and therefore it is expected that this report will be made available by early 2014. UTAD post graduate students will come under the guidance of the following personnel: Prof. José Aranha (Forest Engineering and Landscape Architecture Department Director) Prof Simone Varandas (Director of Forest Engineering Course) Marai João Gaspar (Vice-Director of Forest Engineering Course) Ricardo Gonçalves (Senior Project Manager, GW Portugal) Nuno Paris (Operations Director, GW Agropecuaria ltda) The post graduate study was the first conducted as part of the strategic partnership between the GW Group and UTAD, and we believe forms the foundation of a long term relationship between the 2 partners. The first study offered the opportunity for students to obtain invaluable hands-on experience of live, operating forestry projects outside of the academic background. Our intention is to build on these foundations with UTAD. As our forestry projects develop and expand we are confident that additional strategic partnerships will be formed to be able to offer more independent technical audits across all our plantations globally, with in-depth analysis of each tree species progression. It is vital that the data compiled is done independently for objective opinion to be formed, hence our eagerness to continue to develop further partnerships. In respect to the Acacia Mangium project, it is notable that, according to the independent study conducted by UTAD, growth rates at our most mature Acacia Mangium projects ( three years plus) are exceeding GW Group´s original forecasts of 31.4 cubic meters per hectare by 8.59%. Average volume production is currently achieving 34.1 cubic meters per hectare. The agroforestry management team remains confident that such rates will continue to improve. We would like to take this opportunity to thank all contributors from UTAD for the compilation of this report and look forward to further development of the partnership. Statement Ends. GW Agropecuaria Ltda. Barreiras, Bahia Brazil. CPNJ 10.906.327/0001-66
  • 4. UTAD introduction The forest inventory is one of the best tools of the forest engineer, since it allows us to know exactly what a population area is and, therefore, decide on the best strategy to maximize yield. In this forest inventory, in an area belonging to GW Group, 63 plots were inventoried: 23 in Vale do Buriti’s farm and 40 in Santa Maria’s farm. The main goal was to assess the growth volume on these farms. Therefore, some plots were selected on the field randomly based on the existence of a future tree in the center of each plot. The land and the forest management are one of the main interests of this forest inventory. Like any other economic activity, it is essential the prior knowledge of the preexisting resources and the estimated evaluation to be produced until the age of the final cut. The technical information is, in essence, based on the sampling techniques. The methods used to survey the forest populations, seek to get the lowest possible error for the same amount of work. Due to the fact that to make a full assessment of all the trees that belongs to the population it is too expensive in terms of resources, there was a previous evaluation of the number of sample plots needed for study. Thus, we would be able to determine the volume per plot, and therefore we would be able to extrapolate the total area. On the other hand, it is necessary to take into account the specific type of forest so that the methods and sampling procedures are adjusted to, thereby, enable reducing the cost of this inventory. This cost is directly affected by the measurement time and the path. After a work planning, this final report has been prepared in which is the final results and procedures are succinctly explained. GW Agropecuaria Ltda. Barreiras, Bahia Brazil. CPNJ 10.906.327/0001-66
  • 5. 1.1. SPECIES CHARACTERIZATION The Acacia mangium is a large tree that can reach 25 to 30 m tall, with its straight trunk that can exceed half of the total tree height. The standing trunk has grayish-brown, with slightly protruding shell and slightly grooved along. As for its branching, it presents thin, horizontal, spaced, oval form with dense foliage canopies. The leaves are alternate and simple in green and winged branches, arranged in spiral, ovallanceolate or oval-elongated, broad, leathery, with short petiole, apex elongated, ribs protruding from the base, 12-18 cm long. The A. mangium leaves are permanent “filódios” which did not evolve, not giving rise to true leaves, which should be pinnate. According to the Center for Agroforestry Research of Rondônia – CPAFRO (2004), the flowers are arranged in loose ears 10 cm long, single or united upper armpit. The flowers are pentamerous, with a cup of 0.6-0.8 mm long, with short obtuse lobes, a corolla twice longer than the calyx. The fruits are like pods, twisted or coiled, brown, short, dehiscent, with black seeds, small and pending in the pod by a yellow filament, formed from September to November. These are linear when green, with 3-5 mm width, attaining 7.8 cm in length. The seeds are glossy and may have an ellipsoid or oval form (2.5 to 3.5 mm), within an orange color, which may vary in intensity (Barbosa, 2002). It is native to the northern state of Queensland, in Australia, Papua New Guinea and the Maluku and Irian Java islands, in Indonesia (Tonny e Vieira, 2006). The distribution area latitudes are between 1 ° and 19 ° S, and the main populations are distributed at altitudes between sea level and 100 m, with an upper limit of 720 m known (Doran e Skelton, 1982). The A. mangium can withstand minimum temperatures average 12-25 º C and maximum average 31-34 º C (Barbosa, 2002). The main regions of distribution of this species are those with humid tropical climate with a short dry period in the winter and a high total annual precipitation. The temperatures near the coastal region are high and uniform throughout the year, hence the inappropriateness of this species in these regions. In figure 1 we can see the overall appearance of the species. Fig.1: General aspect of Acacia mangium. GW Agropecuaria Ltda. Barreiras, Bahia Brazil. CPNJ 10.906.327/0001-66
  • 6. 1.2. MAIN GOALS The main goal of this forest inventory is to assess the current production of wood into two distinct classes: the future trees and thinning trees. The first are those with physical conditions to reach a final cut for having good and straight boles. Meanwhile, the latter are defective or present a faulty growth and will not reach the final cut; they will very soon be subject to the process of thinning. Therefore, this study includes data as the volume as a future timber trees per hectare, the volume of timber thinning of trees, the percentage of trees and thinning per hectare and estimates of the value of the diameter as a function of DBH. It will also be presented the hypsometric curves and scaling equations of individual trees. The method used to select the plots was randomized, and 23 plots were selected in the Vale do Buriti’s farm - FSPU09 and 40 plots in Santa Maria’s farm - FSPU02. The plots selected had a circular geometry and a total area of 500 m2 each. Subsequent to field inventory, calculations were performed concerning the volumes on the bark for all trees on the plot. For this analysis, equations have been previously developed for this purpose, through a program called SYSTAT. Information to be collected in sample plots:  Tilt (in degrees);  Dead trees: notes the absence or presence, then the registry by category (Standing Dead: SD)  Trees future: Boles marked with B (good).  Thinning Trees: Reasonable or bad boles and not being a future tree.  GPS Coordinates of the center portion;  Azimuth: For each tree is important to know which is the angle relative to the north – In degrees  Distance to the center: distance of each tree to the center of the plot in meters; As the plots are permanent, the Hossfeld method application has already been started. Once the trees dimensions make scaling practical, the Pressler Bitterlich methodology will be applied. For each plot, the dominant trees were removed, in which case the plots of 500 m2 are five. As can be seen in figure 2, GPS is placed in the tree that represents the center of the plot, suitably marked in red and subsequently the coordinates will be withdrawn. GW Agropecuaria Ltda. Barreiras, Bahia Brazil. CPNJ 10.906.327/0001-66
  • 7. 2. FIELD MATERIAL                 Tape-measure; Vertex Hypsometer; Relascope Bitterlich mirrors; Caliper; Compass; Can of red paint; Cards numbered to 100; Pushpins; GPS; Leggings; Waterproof; Field sheets; Pens; Stepladder; Insect Repellent; Thermos water; Fig.2: Attainment of the coordinates of the center of the plot. GW Agropecuaria Ltda. Barreiras, Bahia Brazil. CPNJ 10.906.327/0001-66
  • 8. 3. AREA CHARACTERIZATION 3.1 VALE DO BURITI FARM The inventoried area is located in the “Assentamento do Poção”, in the municipality of Catolândia (60 km from the city of Barreiras), in the state of Bahia. The farm is divided into plots, (FSPUs - Forestry Standard Production Unit) with the legal field reserve burned during the dry season. The plot leaning against the population area in question is clean and ready to be planted; soon the danger of fire is reduced. Nevertheless, it is necessary to pay special attention to the neighboring farms that have a lot of vegetation. Fig.3: Location of the Vale do Buriti’s farm…. Buriti Valley, Poção Source: Google Earth Latitude 53°37'12.46"E Longitude 86°45'395.66"S 3.2 SANTA MARIA FARM The inventoried area is also located in the “Assentamento do Poção”, in the municipality of Catolândia (60 km from the city of Barreiras), in the state of Bahia. Fig.4: Location of population area of Santa Maria’s Farm Santa Maria, Poção Source: Google Earth Latitude 53°61’71.94”E Longitude 86°46’279.84”S GW Agropecuaria Ltda. Barreiras, Bahia Brazil. CPNJ 10.906.327/0001-66
  • 9. 4. 4.1 CLIMATE CHARACTERIZATION TEMPERATURE In the climate characterization of the area in study there were used weather data, including temperature and precipitation, recorded by the weather station in Barreiras-Bahia. The Barreiras County is inserted in a region where the climate sub-humid to dry prevails. The average annual temperature is 24,3ºC, standing in the average temperature values for the State of Bahia. Regarding the average temperatures of the last 20 years (1992-2012), this year was the year in which this was closer to 2011, as the figure 6 shows. Fig.6: Monthly average of the minimum and maximum daily temperatures recorded by the weather station Barreiras-Bahia during the year of 2011 in the city of Barreiras (Allmetsat). From the analysis of this graphic we obtained the monthly average temperatures of the three hottest months (August, September and October) and the three cooler months (June, July and August), being 25,9ºC and 22,2ºC respectively. GW Agropecuaria Ltda. Barreiras, Bahia Brazil. CPNJ 10.906.327/0001-66
  • 10. 4.2 PRECIPITATION The average annual precipitation in the region is 900 mm to 1.500 mm, and in the municipal headquarters of Barreiras (where we obtained these data) there is an annual average of 1.122 mm. Rains occur mainly from October to April and are associated with the continental nature of the atmospheric currents coming from the west or southeast. The months from May to September are nearly dry, characterizing two well defined seasons in terms of rain in the region: the rainy season (94% of total precipitation for the year), which arises from October to April and a dry season (6% of the total precipitation for the year), which covers the months from May to September. The months of November, December and January are the ones that register the highest values of precipitation and is very common the occurrence of lightning. Barreiras: precipitation (mm) Fig.7: Monthly rainfall average recorded at the weather station of Barreiras-Bahia during the year of 2011. (Allmetsat) GW Agropecuaria Ltda. Barreiras, Bahia Brazil. CPNJ 10.906.327/0001-66
  • 11. 4.3 INSOLATION In the graphic below we can see that the month with the lowest values of insolation is November and the month with the highest insolation values is August. With greater amounts of heat stroke in August on the order of 9 hours per day and less sunshine in November during six hours per day. The period of intense sunlight lasts from May to September with values always higher than 8 hours per day. Barreiras: insolation (hours) Fig.8: Monthly average of the number of hours of sunshine per day recorded by the meteorological station of Barreiras - Bahia during the year of 2011 (Allmetsat). GW Agropecuaria Ltda. Barreiras, Bahia Brazil. CPNJ 10.906.327/0001-66
  • 12. 5. EDAPHIC AND ECOLOGICAL CHARACTERIZATION With the lithological chart of the area, we could verify that it was mainly composed of red yellow latosols (lv). Moreover, the more humid areas (Buritis) contain hydromorphic soils. These types of soil are characterized by a great capacity for water absorption, since they are highly porous; making the rain waters disappears very quickly. The particle size is quite thin and there is almost no presence of rocky material in outcrop. Due to its composition, and although these soils being less fertile, they have a structure very positive for any type of crop, they are of easy handling (very fine and dusty; Figure 9). These soils are intrinsically linked to rainfall, because an intense development of the vegetation only occurs in these conditions. Being a very thin soil, the preventive measures should be considered for the soil not to degrade. During the summer, if soils are exposed to the wind, and in the rainy season, the flood waters easily creep enough sediment to the lower areas. Fig.9: Farms soil. GW Agropecuaria Ltda. Barreiras, Bahia Brazil. CPNJ 10.906.327/0001-66
  • 13. 6. METHODOLOGY 6.1. RANDOM SAMPLING These values were collected in the area according to random sampling, not stratified. In this way, it is intended to reduce systematic errors in the selection of the sample plots where we found their location (figure 10 and 11). Fig.1 0: Distribution of plots in settlement in Santa Maria’s farm (FSPU02). GW Agropecuaria Ltda. Barreiras, Bahia Brazil. CPNJ 10.906.327/0001-66
  • 14. Fig.11: Distribution of plots in settlement in the Vale do Buriti’s farm (FSPU09). Whereas to evaluate the entire forest would have unbearable costs we established a suitable number of plots to the study so that the accuracy was the best possible. Therefore, we selected 23 plots on the Vale do Buriti’s farm and 40 plots on the Santa Maria’s farm. The carried out sampling proved to be sufficient to achieve the desired confidence level. In total 63 plots were evaluated by widespread areas to inventory. The formulas used to calculate the sample relatively to the forest which would be the target inventory, was as follows: Regarding the inference of the implicit error in the process of sampling rate, is described in the following formulas: GW Agropecuaria Ltda. Barreiras, Bahia Brazil. CPNJ 10.906.327/0001-66
  • 15. 7. FIELDWORK PROCEDURES The first step performed in the field work was the identification of the plot to study, which must have a future tree in the center. Once identified, we marked the center of the plot (future tree identified) with red ink so that it is clearly visible in the future. After this step, we assessed the line of greatest slope. For this procedure, it is necessary a clearance of 20 meters, where the slope is measured. To make an easier data visualization, the person that held the clinometer and the compass, stood on higher ground where the data slope and exposure were obtained. All the plots studied presented a circular geometry, with an area of 500m2. The error indexed to this measurement is negligible due to the slope of the land. To calculate the area of the plot we used the corrected formula radius of the circle: This process would require extra work, such as the calculator, which although not impossible, became avoidable due to the use of a table of corrected radii. For this reason, we use a table of fixed radii, which means that through the slope value, we could infer which the correct radius. After these steps we proceeded to the numbering of the trees that were within the plot. For this purpose, we used a device called Vertex. In addition to this equipment, we resorted to the use of a tape-measure to evaluate the distance of each tree from the center of the plot. Subsequently, we recorded the azimuth values of each tree. The measurement of the DBH and the base diameter of each tree were performed using a caliper (figure 12) and we also registered the kind of tree (future tree or thinning tree) and the quality of the bole. Fig.12: Fieldwork. GW Agropecuaria Ltda. Barreiras, Bahia Brazil. CPNJ 10.906.327/0001-66
  • 16. Taking in consideration that in the future we might want to calculate the volume of a tree by diameter classes (Hossfeld method), we selected those that were the closest to the central diameter of each class by pointing them in the form field. Through the help of Bitterlich relascope, readings were taken at 1,30 m diameter (DBH), half the value of the same diameter (d/2) and the top reading (dt). These readings would serve to calculate the volume of each class of trees. However, this has not happened because volume of the tree was estimated using growth equations, since it is not possible to use Bitterlich relascope, due to the small size of the trees. It is important to note that during the reading with the Bitterlich relascope, these were always made perpendicular to the direction of measurement of the diameter of the tree. The next step was to check the data table obtained, which the 5 dominant trees in each plot and, also 2 trees per diameter class for future trees and thinning trees. Using the Vertex we calculated the heights of these trees previously marked (dominant trees and trees sample). For this procedure we ensured that the operator would have full visibility either of the base or of the top of the tree, and the inclination was the smallest possible. The aim would be to reduce the error associated with the measurement in the population area. In Santa Maria’s farm it was not possible to use the Bitterlich relascope. Alternatively, measurements of various diameters were taken along the tree (base; 0,60cm; 1,30cm; 2,30cm; 3,30cm; 4,30cm). In the forest area at Vale do Buriti’s farm we resorted to the use of Bitterlich relascope to collect some data in order to establish the growth equations. At the end of this procedure, were evaluated about 50 future trees and 50 thinning trees, in both forest settlements, to achieve different growth equations. GW Agropecuaria Ltda. Barreiras, Bahia Brazil. CPNJ 10.906.327/0001-66
  • 17. 8. MEASUREMENT AND OBSERVATION ERRORS 8.1. HUMAN ERRORS Throughout the forest inventory process various types of mistakes can be made. One of the most common is the exchange of values during the annotation. To avoid this error, the appraiser should say the value aloud and the note taker should repeat it to prove that he heard the value correctly. The use of inappropriate formulary or the incorrect processing data is another common mistake. To bridge this error we should be make prior preparation and consult adequate bibliography. There are also several mistakes of human nature mainly due the different sensitivities of human sense. 8.2. MEASUREMENT ERRORS  Errors due the shape of the object to be measured;  Inaccuracies of the instruments;  Physical, topographical and climatic influences. The errors inherent in a work of this nature can be of two types: random errors and systematic errors. The random errors have unpredictable nature and operate in both directions of measurement (bilateral errors - positive or negative), and may be subject to correction and/or mitigation. So that, the systematic errors (which cannot be corrected) can be minimized if we fit the equipment and the experimentation plans to planned study. These errors show dependence of the magnitude and of the direction of the error (unilateral errors - positive or negative). GW Agropecuaria Ltda. Barreiras, Bahia Brazil. CPNJ 10.906.327/0001-66
  • 18. 9. DIAMETERS MEASUREMENT RULES The rules for measuring diameters are a standard methodology for forest inventories. Due to its central role in these studies, it is essential the correct execution of the technique or otherwise, it can be introduced systematic errors in the study that cannot be corrected. In figure 13, we can observe six different cases of diameters trunk measurements, which vary according to the slope of the terrain and to the type of trunk. Fig.13: Measurement rules of DBH. In case 1, on sloping ground, the diameter should be measured from the higher side, about 1,30 m from the base. In case 2, it is possible to see the most common case of the measurement of DBH, that is, a tree which stands on a flat land. In this case, the measurement should be made parallel to the ground level and approximately 1,30m from the base. In case 3, the land is flat but the tree is sloped. In this case, the diameter should be measured at the bottom side of the slope. In case 4, there is a situation which both the ground and the tree is sloped. Therefore, the measurement should be made on the higher side of the inclination. In case of the trees with the branching along the zone of 1,30m, each branch must be measured individually. In the case of branches which divide below 1,30m (case 5), we must count each branch as an independent individual. If, otherwise, the split occurs at a height of more than 1,30m then the measurement is done considering only an individual. Another situation that can affect the diameter measurement is the presence of nodes, gumming or wounds in the area of 1,30, and as such, we must measure up to a higher level, by making a comment in the form field explaining what happened during the procedure. GW Agropecuaria Ltda. Barreiras, Bahia Brazil. CPNJ 10.906.327/0001-66
  • 19. 9.1. DOMINANT TREES Is called dominant trees those that present a canopy above average overall of the forest area. In this study, we measured the height of 5 dominant trees per plot. To assist the measurements we used the Hypsometer Vertex. The height, with Hypsometer Vertex, is determined by making two types of readings: the first reading is made targeting the Transponder, placed in the tree at 1,30m, and a second target to the top of the tree. We should be within a sufficient distance from the tree to be able to observe the canopy top of that same tree. Unlike other instruments, the Vertex does not take in consideration the distance that we might be from the tree. To avoid measuring errors, particularly errors over/under evaluation, which can be made with the target Hypsometer Vertex, we must take extreme care. 9.2. MODEL TREE Model trees are those that represent the average values of forest area regarding the DBH. When we were calculating the volume of model trees to the Vale do Buriti farm we resorted to Bitterlich relascope. In this process, few can frame one of the bands, by choosing the most appropriate for the situation (the distance of the tree depends on this option). Measurements were made to 1,30m height, preferably in the horizontal plane and perpendicular to the measurement made with the caliper. Then, we did a reading for the director point, where the diameter is half of the diameter to 1,30m. At this point, the reading should be made to half scale used to 1,30m, having 2 narrow bands in the case of band 1 or 4 bands corresponding to the band 1, where the measurement should be on the band 4. And finally, we made a target for the arrow tree (figure 14). Fig.14: Measurement with the Bitterlich Relascope. GW Agropecuaria Ltda. Barreiras, Bahia Brazil. CPNJ 10.906.327/0001-66
  • 20. 9.3. WOOD VOLUME CALCULATION The calculation of the volume of wood was made by scaling equations developed by Samuel Reis, with the help of Professor Domingos Lopes. This consists in picking a considerable number of trees in the population area (in this study were 50 for future and 50 for thinning ) in which the dendrometric data are removed - in the case of the Vale do Buriti’s farm we used Bitterlich Relascope and in Santa Maria’s farm measurement of the diameters was made along the bole. In this study we used two different methods of evaluation, but with the same results. After collecting all the data for future trees and thinning trees, we introduced the values separately into the program SYSTAT. The scaling equations were correctly for each kind of tree: two for future trees, two for thinning trees and two in which we put together the data of future trees and thinning trees. These equations were applied equally to data from the two villages. With these equations, the volume was calculated for all trees in the plot using the sharpest equation, that is, the one which presents a value of R2 as close to 1. After obtaining the individual volume for each tree, the volume was calculated for the plot by summing up all independent volumes from each tree. At the end, we obtained a matrix with the result of all plots, ready to be statistically evaluated. With this process, it is possible to know the volume of each existing tree in the population area. To this end, we simply have to know the value of the DBH or the height. Note that these equations ensure a minimal error for trees in forest areas previously studied. . GW Agropecuaria Ltda. Barreiras, Bahia Brazil. CPNJ 10.906.327/0001-66
  • 21. 10. STATISTICAL ANALYSIS To determine the volume of the population area we worked up the average calculations (ẋ), the variance (s2), the standard deviation (s), the average variance (s 2/x), the standard error (Sx) and the interval of confidence (IC). Thus, for the values of total volume obtained by scaling equations, relating the volume over bark, we made the following calculations: 10.1. AVERAGE The sample average is a measure of central tendency, which is represented by ẋ and makes a location in the center of the sample. It is obtained from the following expression: x – Volume average xi – Individual volume in each plot n – Number of plots sampled GW Agropecuaria Ltda. Barreiras, Bahia Brazil. CPNJ 10.906.327/0001-66
  • 22. 10.2. VARIANCE In statistical terms, the variance is the measure more commonly used to quantify the variability of a population. This measure of variation is obtained by averaging the sum of squares of the deviations of individual values from the average population: s2- Variance - Sum of individual values of volume squared, per plot 2 - Sum of the volumes values volumes per plot squared n – Number of plots sampled 10.3. STANDARD DEVIATION In order to evaluate the variability of a population in terms of the original units, we must use the square root of the variance, the standard deviation: GW Agropecuaria Ltda. Barreiras, Bahia Brazil. CPNJ 10.906.327/0001-66
  • 23. 10.4. VARIANCE OF AVERAGE It is a measure of accuracy of the estimated average and it is calculated with the following formula: s2/x – variance of average s2- variance n- number of plots sampled N - total number of plots 10.5. STANDARD ERROR The standard error measures the dispersion of a population averages from the average of the averages in the original units: Sx –standard error s- standard deviation n- number of plots sampled N- total number of plots GW Agropecuaria Ltda. Barreiras, Bahia Brazil. CPNJ 10.906.327/0001-66
  • 24. 10.6. SAMPLING ERROR Defines the difference between the estimated average and actual average, and is, therefore, a measure of exactness. The value of t depends on the level of probability chosen * and on the greatness of sampling (n). As n approaches infinity the distribution of t tends to a normal distribution. SE- sampling error; Sx – standard error; t - “t” of Student 10.7. INTERVAL OF CONFIDENCE For probability level of 95%* and n-1 freedom degrees, we will find a value of t, which later will be used to estimate the interval of confidence: IC – interval of confidence ẋ – average Sx – standard error; t - “t” of Student GW Agropecuaria Ltda. Barreiras, Bahia Brazil. CPNJ 10.906.327/0001-66
  • 25. 11. 11.1. RESULTS HYPSOMETRIC CURVES 11.1.1. (H - HEIGHT IN METERS; D - DIAMETER IN CM) SANTA MARIA’S FARM The model h= a.db was adjusted for the database of Santa Maria’s farm, considering the different types of trees: - For future trees: h = 2.786.d0.419 R2 = 0.632 - For thinning trees: h = 3.515.d0.290 R2 = 0.598 - For data of thinning trees + future trees h = 2.988.d0.380 R2 = 0.616 Height (m) Comparing the 3 adjusted equations we obtained the following figure, where we can notice differences in the profile of the trees: Future Thinning Total Diameter (cm) Graphic 1: Comparison between the three hypsometric curves for Santa Maria’s farm. When comparing the three equations (Graphic 1) it is perceptible that the future trees present lower volume values from the remaining, in smaller DBHs, but as they grow up they can overcome the remaining. Thus, its perspective is that in the future these trees will present better performances. GW Agropecuaria Ltda. Barreiras, Bahia Brazil. CPNJ 10.906.327/0001-66
  • 26. 11.1.2. VALE DO BURITI’S FARM The model h=a.db was adjusted to the database of the Buriti’s Valley, considering the various types of trees: - For future trees: h = 2.639.d0.547 R2 = 0.462 - For thinning trees: h = 2.170.d0.647 R2 = 0.462 - For data of thinning trees + future trees h = 2.277.d0.619 R2 = 0.455 Comparing the 3 adjusted equations we obtained the following figure, where we can notice differences in the profile of the trees: Height (m) Future Total Thinning Diameter (cm) Graphic 2: Comparison between the three hypsometric curves for Vale do Buriti’s farm. When comparing the 3 equations (Graphic 2) it is perceptive that thinning trees, present lower volume values apart from the remaining, higher in DBHs. So, initially, its perspective is that in the future these trees will have improved performances; and the futures trees will have worst performances. GW Agropecuaria Ltda. Barreiras, Bahia Brazil. CPNJ 10.906.327/0001-66
  • 27. 11.2. CUBING EQUATIONS: Then, we present the equations of adjusted cubing. They may be an important tool to the managers of this area, since it facilitates the volume estimation of individual trees, requiring inputs easily obtainable. 11.2.1. SANTA MARIA’S FARM The model v=a.db was adjusted for the database of Santa Maria, considering the various types of trees: - For the future trees: v = 0.00034.d 1.896 R2 = 0.861 - For thinning trees: v = 0.0011.d 1.258 R2 = 0.487 - For data of thinning trees + future TREES: Ln (v) = -7.569+1.660 Ln (d) R2 = 0.846 Equations comparison graphic 3 Volume (m ) Future Thinning Diameter (cm) Graphic 3: Comparison between the 3 equations for the cubage for Santa Maria’s farm. From the comparison of the 3 equations, in this case, the behavior is opposite to what was previously thought. Initially, the future trees, to the same dimensions of DBH, had higher values of volume, but in higher dimensions begin to have a lower behavior. This doesn’t mean that in relation, for example, to the quality of the bole, the differences are not well marked and that the appreciation of future trees will, nevertheless, be more pronounced. GW Agropecuaria Ltda. Barreiras, Bahia Brazil. CPNJ 10.906.327/0001-66
  • 28. 11.2.2. VALE DO BURITI’S FARM The model v=a.db was adjusted to the database of the Vale do Buriti’s farm, considering the various types of trees: - For future trees: v=0.00014.d2.530 R2= 0.949 - For thinning trees: v=0.000099.d2.706 R2= 0.883 - For data thinning trees + future trees model Log(v)= a+b.Log(d) was adjusted : Ln(v) = -9.034+ 2.616Ln(d) R2= 0.950 Volume (m3) Equations comparison graphic Future Thinning Total Diameter (cm) Graphic 4: Comparison between the three cubage equations for Buriti’s valley farm. Again, from the analysis of graphic 4, we can confirm that for the future we must select trees for further criteria other than just the size. It is clear that, in our perspective, the use of adjusted equations for the entire data can be a more balanced approach, and that can reflect the average situation of the populations under study. GW Agropecuaria Ltda. Barreiras, Bahia Brazil. CPNJ 10.906.327/0001-66
  • 29. 11.3. SANTA MARIA’S FARM Where 40 sample plots of 500 m2 were made, we obtain the following results: In table 1, the volume of trees considered future; Table 1: Volume of the future trees on Santa Maria’s farm: Volume of future trees x (average) 0,92 m3 /ha Variance 0,20 (m3 ha-1)2 Standard deviation 0,45 m3 /ha Average variance 0,01 (m3 ha-1)2 Standard error 0,07 m3 /ha 0,14 m3 /ha SE (Sampling error) SE% 0,15 IC (Interval of confidence) ]0,78;1,06[ GW Agropecuaria Ltda. Barreiras, Bahia Brazil. CPNJ 10.906.327/0001-66 % m3 /ha
  • 30. In table 2, the volume of trees considered thinning; Table 2: Volume of thinning trees on Santa Maria’s farm: Volume of thinning trees 5,58 m3 /ha Varience 3,93 (m3 ha1)2 Standard deviation 1,98 m3 /ha Average variance 0,10 (m3 ha1)2 Standard error 0,31 m3 /ha 0,63 m3 /ha x (average) SE(Sampling error) SE% 0,11 IC (Interval of confidence) ]4,95;6,21[ GW Agropecuaria Ltda. Barreiras, Bahia Brazil. CPNJ 10.906.327/0001-66 % m3 /ha
  • 31. In table 3: total volume (thinning + future) of regarded trees; Table 3: Total volume of the trees of Santa Maria’s farm: Total volume of trees 6,50 x (average) m3 /ha 4,17 Varience Standard deviation Average variance Standard error SE(Sampling error) SE% (m3 ha-1)2 2,04 m3 /ha 0,10 (m3 ha-1)2 0,32 m3 /ha 0,65 m3 /ha 0,10 IC (Interval of confidence) ]5,85;7,15[ Fig.15: Santa Maria’s farm forest area. GW Agropecuaria Ltda. Barreiras, Bahia Brazil. CPNJ 10.906.327/0001-66 % m3 /ha
  • 32. Vale do Buriti’s Farm Where 23 sample plots of 500 m2 were made, we obtain the following results: In Table 4, the volume of the trees considered future; Table 4: Volume of the future trees on the Vale do Buriti’s farm Volume of future trees 6,06 m3 /ha Variance 6,80 (m3 ha1)2 Standard deviation 2,61 m3 /ha Average variance 0,30 (m3 ha1)2 Standard error 0,54 m3 /ha 1,12 m3 /ha x (average) SE (Sampling error) SE% 0,18 IC (Interval of confidence) ]4,94;7,18[ GW Agropecuaria Ltda. Barreiras, Bahia Brazil. CPNJ 10.906.327/0001-66 % m3 /ha
  • 33. In table 5, the volume of the trees considered thinning; Table 5: Volume of the thinning trees on the Vale do Buriti’s farm Volume of thinning trees 28,05 m3 /ha Variance 42,73 (m3 ha1)2 Standard deviation 6,54 m3 /ha Average variance 1,86 (m3 ha1)2 Standar error 1,36 m3 /ha 2,82 m3 /ha x (average) SE (Sampling error) SE% 0,01 IC (Interval of confidence) ]25,23;30,87[ GW Agropecuaria Ltda. Barreiras, Bahia Brazil. CPNJ 10.906.327/0001-66 % m3 /ha
  • 34. In table 6, the total volume (thinning + future) of regarded trees; Table 6: Total Volume of the trees of the Vale do Buriti’s farm. Total volume of the trees 34,11 m3 /ha Variance 31,50 (m3 ha1)2 Standard deviation 5,61 m3 /ha Average variance 1,37 (m3 ha1)2 Standard error 1,17 m3 /ha 2,43 m3 /ha x (average) SE (Sampling error) SE% 0,07 IC (Interval of confidence) ]31,68;36,54[ Fig.16: Vale do Buriti’s farm forest area. GW Agropecuaria Ltda. Barreiras, Bahia Brazil. CPNJ 10.906.327/0001-66 % m3 /ha
  • 35. 12. CONCLUSIONS The conclusions that can be drawn from this work, actually more than conclusions, and the comments to make are subdivided into the places where this work took place. It is thought that, thus, it is more efficient in the definition of future lines of action in each one of them. 12.1. SANTA MARIA’S FARM Regarding the results presented above, we highlight the low sampling error which gives them credibility. Sampling error of the future tree volume is relatively higher because of the bigger dispersion of sampling, namely, the fact of having few futures trees per hectare directly influences this result. As would be expected, the results in this forest area have a higher associated error due to a lower sampling rate in the field, which causes a difference between the sampled area and the total forest area, very high. However, the results are very good, giving us a sampling error around 0.1%, which cannot be considered very high compared with other studies surveyed. The firebreaks on all perimeters of the forest areas should be as wide as possible and should be kept clean whenever possible. It is essential that at the time of the dry season this should always be without vegetation. With regard to the high quality boles intended for these forest settlements, pruning should be done up to 4-5 meters height. Thus, these same pruning must take into account the cut branches so that they do not exceed 2cm in diameter. In the general forest area, we should regard the constant competition between the trees, so that they grow as much as possible, along with gains in its diameter, with particular attention to the thinning performed. GW Agropecuaria Ltda. Barreiras, Bahia Brazil. CPNJ 10.906.327/0001-66
  • 36. 12.2. VALE DO BURITI’S FARM Regarding the results of the Vale do Buriti’s farm, presented earlier. Again the sampling error of the future tree volume is relatively high, due to the same reasons given above. As would be expected, the results in this population area have a lower associated error due to a higher sampling rate field, which causes a difference between the sampled area and the total forest area, smaller. Nevertheless, the results are very good and give us sampling errors around 0.07%, which is very low. Thus, for the Vale do Buriti’s farm we achieved an average volume of 34,1m3/ha in all the trees. Considering their age and reasonable handling in the first months of life it is a very satisfactory value, being possible to achieve, without a doubt, a higher value. We must bear in mind that the years of the largest increases in volume are still to come, and may be possible to achieve the annual average volume initially expected. In the case of this forest area we have a value of future trees per hectare quite reasonable making the choice of trees that will make to harvest easier, as we have a larger number of trees to choose from. This number of future trees, along with a proper fertilization and forestry management, can be translated into a very productive and homogeneous forest area. In this population area there are some risk factors identical to those of Santa Maria’s farm. As for the boles intended for these forest areas, we can evaluate that they are of great quality, and there are one or another individual tree with this desirable quality. Even so, the bole up to 4-5 meters high must be kept free of branching. So, pruning must take into account the cut branches, so that they do not exceed two cm in diameter. In the general population area we should take in consideration the constant competition between the trees so that they grow together with the greatest possible gains in diameter, and thus special attention to the thinning that might be made. GW Agropecuaria Ltda. Barreiras, Bahia Brazil. CPNJ 10.906.327/0001-66
  • 37. 13. BIBLIOGRAPHIC REFERENCES - MARQUES, C.P., FONSECA, T., 2006, “Apontamentos de Inventário florestal”, UTAD, Vila Real. -MARQUES, C.P., LOPES, D., FONSECA, T., 2007, “Apontamentos de Dendrometria”, UTAD, Vila Real. -ALLMETSAT, 13-12-2012, http://pt.allmetsat.com/clima/brasil.php?code=83236. -INMET, 13-12-2012, http://www.inmet.gov.br/portal/. -EMBASA, 13-12-2012, www.embasa.ba.gov.br. -IPEF, 15-01-2013, http://www.ipef.br/identificacao/acacia.mangium.asp GW Agropecuaria Ltda. Barreiras, Bahia Brazil. CPNJ 10.906.327/0001-66
  • 38. ANNEXES GW Agropecuaria Ltda. Barreiras, Bahia Brazil. CPNJ 10.906.327/0001-66
  • 39. Plots Map – Santa Maria GW Agropecuaria Ltda. Barreiras, Bahia Brazil. CPNJ 10.906.327/0001-66
  • 40. Plots Maps – Vale do Buriti GW Agropecuaria Ltda. Barreiras, Bahia Brazil. CPNJ 10.906.327/0001-66
  • 41. Precipitation Graphic from City of Barreiras GW Agropecuaria Ltda. Barreiras, Bahia Brazil. CPNJ 10.906.327/0001-66