
Empfohlen
Weitere ähnliche Inhalte
Was ist angesagt?
Was ist angesagt? (17)
Ähnlich wie AZN/ALXN
Ähnlich wie AZN/ALXN (20)
Mehr von Franklin Monzon
Kürzlich hochgeladen
Kürzlich hochgeladen (20)
AZN/ALXN
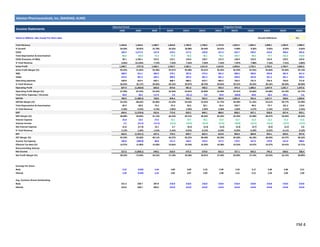
- 1. FM 4 Historical Period 1Q20 2Q20 3Q20 4Q20E 1Q21E 2Q21E 3Q21E 4Q21E 1Q22E 2Q22E 3Q22E 4Q22E Values in Millions, USD, Except Per Share Data Circular Reference: Yes Total Revenue 1,444.8 1,444.6 1,588.7 1,664.8 1,706.0 1,740.6 1,747.8 1,822.5 1,864.1 1,898.1 1,903.9 1,980.3 % Growth 26.69% 20.05% 25.78% 20.26% 18.08% 20.49% 10.01% 9.48% 9.26% 9.05% 8.93% 8.66% COGS 185.4 2,271.9 197.8 219.5 217.5 220.8 227.3 232.7 230.3 233.6 240.4 245.8 Total Depreciation & Amortization 89.3 89.8 75.2 97.4 92.6 92.1 95.4 103.7 98.3 97.7 101.2 110.0 COGS (Exclusive of D&A) 96.1 2,182.1 122.6 122.1 124.9 128.7 131.9 128.9 132.0 135.9 139.2 135.8 % Total Revenue 6.65% 151.05% 7.72% 7.33% 7.32% 7.39% 7.55% 7.07% 7.08% 7.16% 7.31% 6.86% Gross Profit 1,348.7 (737.5) 1,466.1 1,542.7 1,581.1 1,611.9 1,615.8 1,693.6 1,732.1 1,762.2 1,764.7 1,844.5 Gross Profit Margin (%) 93.35% -51.05% 92.28% 92.67% 92.68% 92.61% 92.45% 92.93% 92.92% 92.84% 92.69% 93.14% R&D 200.9 221.1 285.9 279.1 287.6 272.4 281.4 300.3 309.0 292.8 301.9 321.4 SG&A 319.9 301.4 334.2 389.6 392.6 401.3 401.2 420.0 422.8 431.5 431.1 450.4 Operating expenses 520.8 522.5 620.1 668.7 680.2 673.7 682.5 720.2 731.9 724.3 733.0 771.8 % Total Revenue 36.05% 36.17% 39.03% 40.16% 39.87% 38.70% 39.05% 39.52% 39.26% 38.16% 38.50% 38.98% Operating Profit 827.9 (1,260.0) 846.0 874.0 901.0 938.2 933.3 973.3 1,000.2 1,037.9 1,031.7 1,072.6 Operating Profit Margin (%) 57.30% -87.22% 53.25% 52.50% 52.81% 53.90% 53.40% 53.41% 53.66% 54.68% 54.19% 54.17% Total Other Expenses / (Income) 44.0 20.2 117.4 3.6 (31.1) 6.0 29.4 (28.6) 44.8 20.2 103.1 3.6 EBITDA 783.9 (1,280.2) 728.6 870.4 932.1 932.2 903.9 1,001.9 955.4 1,017.7 928.6 1,069.0 EBITDA Margin (%) 54.26% -88.62% 45.86% 52.29% 54.63% 53.56% 51.72% 54.98% 51.25% 53.61% 48.77% 53.98% Total Depreciation & Amortization 89.3 89.8 75.2 97.4 92.6 92.1 95.4 103.7 98.3 97.7 101.2 110.0 % Total Revenue 6.18% 6.22% 4.73% 5.85% 5.43% 5.29% 5.46% 5.69% 5.27% 5.15% 5.31% 5.55% EBIT 694.6 (1,370.0) 653.4 773.0 839.5 840.1 808.6 898.2 857.1 920.0 827.4 959.1 EBIT Margin (%) 48.08% -94.84% 41.13% 46.43% 49.21% 48.26% 46.26% 49.29% 45.98% 48.47% 43.46% 48.43% Interest Expense 25.8 23.6 27.6 25.1 24.7 24.1 23.4 22.7 21.9 21.2 21.3 21.6 Interest Income 5.2 (41.5) (11.5) (22.5) (24.9) (26.4) (27.6) (28.0) (25.7) (25.4) (23.5) (19.5) Net Interest Expense 31.0 (17.9) 16.1 2.7 (0.2) (2.3) (4.2) (5.4) (3.7) (4.2) (2.2) 2.0 % Total Revenue 2.15% -1.24% 1.01% 0.16% -0.01% -0.13% -0.24% -0.29% -0.20% -0.22% -0.11% 0.10% EBT 663.6 (1,352.1) 637.3 770.3 839.7 842.4 812.8 903.6 860.8 924.1 829.6 957.0 EBT Margin (%) 45.93% -93.60% 40.11% 46.27% 49.22% 48.40% 46.50% 49.58% 46.18% 48.69% 43.57% 48.33% Income Tax Expense 106.0 (284.0) 88.8 151.5 164.5 163.4 157.5 176.5 167.6 179.0 161.0 188.6 Effective Tax Rate (%) 15.97% 21.00% 13.93% 19.66% 19.59% 19.39% 19.38% 19.53% 19.47% 19.37% 19.41% 19.71% Noncontrolling Interest - - - - - - - - - - - - Net Income 557.6 (1,068.1) 548.5 618.9 675.2 679.0 655.3 727.1 693.2 745.2 668.6 768.4 Net Profit Margin (%) 38.59% -73.94% 34.53% 37.18% 39.58% 39.01% 37.49% 39.90% 37.19% 39.26% 35.12% 38.80% Earnings Per Share Basic 2.52 (4.84) 2.64 2.83 3.09 3.10 2.99 3.32 3.17 3.40 3.06 3.51 Diluted 2.50 (4.84) 2.62 2.82 3.07 3.09 2.98 3.31 3.15 3.39 3.04 3.50 Avg. Common Shares Outstanding Basic 221.3 220.7 207.8 218.8 218.8 218.8 218.8 218.8 218.8 218.8 218.8 218.8 Diluted 223.0 220.7 209.4 219.8 219.8 219.8 219.8 219.8 219.8 219.8 219.8 219.8 Projection Period Alexion Pharmaceuticals, Inc. (NASDAQ: ALXN) Income Statements
- 2. FM 5 Historical Period 1Q20 2Q20 3Q20 4Q20E 1Q21E 2Q21E 3Q21E 4Q21E 1Q22E 2Q22E 3Q22E 4Q22E Values in Millions, USD, Except Per Share Data Circular Reference: Yes Total Revenue 6,354.0 6,275.0 6,578.0 7,148.0 6,939.1 7,299.0 7,459.4 7,795.0 7,688.5 7,850.2 8,110.1 8,559.6 % Growth 15.72% 7.76% 2.68% 7.26% 9.21% 16.32% 13.40% 9.05% 10.80% 7.55% 8.72% 9.81% COGS 1,420.0 984.0 1,370.0 1,461.9 1,331.4 1,337.2 1,404.3 1,548.8 1,433.6 1,411.3 1,492.4 1,652.6 Total Depreciation & Amortization 841.0 710.0 801.0 804.8 519.6 527.9 509.4 830.7 549.9 548.8 535.0 862.1 COGS (Exclusive of D&A) 579.0 274.0 569.0 657.1 811.8 809.3 894.9 718.1 883.7 862.5 957.4 790.4 % Total Revenue 9.11% 4.37% 8.65% 9.19% 11.70% 11.09% 12.00% 9.21% 11.49% 10.99% 11.81% 9.23% Gross Profit 5,775.0 6,001.0 6,009.0 6,490.9 6,127.2 6,489.6 6,564.5 7,076.9 6,804.8 6,987.7 7,152.7 7,769.1 Gross Profit Margin (%) 90.89% 95.63% 91.35% 90.81% 88.30% 88.91% 88.00% 90.79% 88.51% 89.01% 88.19% 90.77% R&D 1,388.0 1,389.0 1,495.0 1,845.2 1,499.1 1,548.7 1,514.6 1,893.7 1,544.5 1,593.2 1,559.3 1,942.8 SG&A 2,719.0 2,635.0 2,730.0 3,092.8 2,759.1 2,991.5 2,922.1 3,196.3 2,886.1 3,076.1 3,028.1 3,324.1 Operating expenses 4,107.0 4,024.0 4,225.0 4,938.0 4,258.2 4,540.1 4,436.7 5,090.0 4,430.6 4,669.3 4,587.4 5,267.0 % Total Revenue 64.64% 64.13% 64.23% 69.08% 61.37% 62.20% 59.48% 65.30% 57.63% 59.48% 56.56% 61.53% Operating Profit 1,668.0 1,977.0 1,784.0 1,552.9 1,869.1 1,949.5 2,127.8 1,986.9 2,374.2 2,318.4 2,565.3 2,502.2 Operating Profit Margin (%) 26.25% 31.51% 27.12% 21.72% 26.94% 26.71% 28.53% 25.49% 30.88% 29.53% 31.63% 29.23% Total Other Expenses / (Income) (389.0) (1.0) (187.0) (204.0) (204.2) (214.5) (221.9) (228.9) (233.5) (235.5) (247.0) (258.8) EBITDA 2,057.0 1,978.0 1,971.0 1,756.9 2,073.2 2,164.0 2,349.7 2,215.8 2,607.7 2,553.8 2,812.3 2,760.9 EBITDA Margin (%) 32.37% 31.52% 29.96% 24.58% 29.88% 29.65% 31.50% 28.43% 33.92% 32.53% 34.68% 32.26% Total Depreciation & Amortization 841.0 710.0 801.0 804.8 519.6 527.9 509.4 830.7 549.9 548.8 535.0 862.1 % Total Revenue 13.24% 11.31% 12.18% 11.26% 7.49% 7.23% 6.83% 10.66% 7.15% 6.99% 6.60% 10.07% EBIT 1,216.0 1,268.0 1,170.0 952.1 1,553.7 1,636.1 1,840.3 1,385.1 2,057.8 2,005.0 2,277.3 1,898.8 EBIT Margin (%) 19.14% 20.21% 17.79% 13.32% 22.39% 22.42% 24.67% 17.77% 26.76% 25.54% 28.08% 22.18% Interest Expense 332.0 329.0 324.0 366.4 369.9 372.8 353.6 352.5 361.7 379.1 417.7 430.0 Interest Income (51.0) (22.0) (7.0) (34.1) (25.3) (21.3) (17.1) (15.9) (15.3) (22.1) (38.4) (43.9) Net Interest Expense 281.0 307.0 317.0 332.3 344.6 351.5 336.6 336.6 346.5 357.0 379.3 386.1 % Total Revenue 4.42% 4.89% 4.82% 4.65% 4.97% 4.82% 4.51% 4.32% 4.51% 4.55% 4.68% 4.51% EBT 935.0 961.0 853.0 619.8 1,209.1 1,284.6 1,503.7 1,048.6 1,711.4 1,648.1 1,898.0 1,512.7 EBT Margin (%) 14.72% 15.31% 12.97% 8.67% 17.42% 17.60% 20.16% 13.45% 22.26% 20.99% 23.40% 17.67% Income Tax Expense 185.0 223.0 202.0 114.1 214.1 225.9 264.8 188.9 301.7 289.0 340.3 278.4 Effective Tax Rate (%) 19.79% 23.20% 23.68% 18.40% 17.71% 17.59% 17.61% 18.02% 17.63% 17.53% 17.93% 18.40% Noncontrolling Interest (30.0) (18.0) 3.0 (10.4) (19.6) (20.6) (24.2) (17.3) (27.6) (26.4) (31.1) (25.4) Net Income 780.0 756.0 648.0 516.2 1,014.6 1,079.3 1,263.2 876.9 1,437.2 1,385.5 1,588.8 1,259.8 Net Profit Margin (%) 12.28% 12.05% 9.85% 7.22% 14.62% 14.79% 16.93% 11.25% 18.69% 17.65% 19.59% 14.72% Earnings Per Share Basic 0.59 0.58 0.49 0.39 0.77 0.82 0.96 0.67 1.09 1.06 1.21 0.96 Diluted 0.59 0.58 0.49 0.39 0.77 0.82 0.96 0.67 1.09 1.05 1.21 0.96 Avg. Common Shares Outstanding Basic 1,322.0 1,303.4 1,322.4 1,312.7 1,312.7 1,312.7 1,312.7 1,312.7 1,312.7 1,312.7 1,312.7 1,312.7 Diluted 1,322.0 1,303.4 1,322.4 1,313.9 1,313.9 1,313.9 1,313.9 1,313.9 1,313.9 1,313.9 1,313.9 1,313.9 AstraZeneca PLC (NASDAQ: AZN) Income Statements Projection Period
- 3. FM 6 Historical Period Pre-Merger Forecasts Post-Merger Forecasts 1Q20 2Q20 3Q20 4Q20E 1Q21E 2Q21E 3Q21E 4Q21E 1Q22E 2Q22E 3Q22E 4Q22E Values in Millions, USD, Except Per Share Data Circular Reference: Yes Total Revenue 6,354.0 6,275.0 6,578.0 7,148.0 6,939.1 7,299.0 7,459.4 9,617.5 9,552.6 9,748.3 10,013.9 10,539.9 % Growth 15.72% 7.76% 2.68% 7.26% 9.21% 16.32% 13.40% 34.55% 37.66% 33.56% 34.25% 9.59% COGS 1,420.0 984.0 1,370.0 1,461.9 1,331.4 1,337.2 1,404.3 1,781.4 1,664.0 1,644.9 1,732.7 1,898.4 Total Depreciation & Amortization 841.0 710.0 801.0 804.8 519.6 527.9 509.4 934.4 648.2 646.5 636.1 972.1 COGS (Exclusive of D&A) 579.0 274.0 569.0 657.1 811.8 809.3 894.9 847.1 1,015.7 998.4 1,096.6 926.3 % Total Revenue 9.11% 4.37% 8.65% 9.19% 11.70% 11.09% 12.00% 8.81% 10.63% 10.24% 10.95% 8.79% Gross Profit 5,775.0 6,001.0 6,009.0 6,490.9 6,127.2 6,489.6 6,564.5 8,770.5 8,536.9 8,749.9 8,917.3 9,613.6 Gross Profit Margin (%) 90.89% 95.63% 91.35% 90.81% 88.30% 88.91% 88.00% 91.19% 89.37% 89.76% 89.05% 91.21% R&D 1,388.0 1,389.0 1,495.0 1,845.2 1,499.1 1,548.7 1,514.6 2,193.9 1,853.5 1,886.1 1,861.2 2,264.3 SG&A 2,719.0 2,635.0 2,730.0 3,092.8 2,759.1 2,991.5 2,922.1 3,616.3 3,308.9 3,507.6 3,459.2 3,774.5 Operating expenses 4,107.0 4,024.0 4,225.0 4,938.0 4,258.2 4,540.1 4,436.7 5,810.2 5,162.4 5,393.6 5,320.4 6,038.8 % Total Revenue 64.64% 64.13% 64.23% 69.08% 61.37% 62.20% 59.48% 60.41% 54.04% 55.33% 53.13% 57.30% Operating Profit 1,668.0 1,977.0 1,784.0 1,552.9 1,869.1 1,949.5 2,127.8 2,960.2 3,374.5 3,356.2 3,597.0 3,574.8 Operating Profit Margin (%) 26.25% 31.51% 27.12% 21.72% 26.94% 26.71% 28.53% 30.78% 35.32% 34.43% 35.92% 33.92% Total Other Expenses / (Income) (389.0) (1.0) (187.0) (204.0) (204.2) (214.5) (221.9) (257.5) (188.7) (215.3) (143.9) (255.2) EBITDA 2,057.0 1,978.0 1,971.0 1,756.9 2,073.2 2,164.0 2,349.7 3,217.7 3,563.1 3,571.5 3,740.9 3,829.9 EBITDA Margin (%) 32.37% 31.52% 29.96% 24.58% 29.88% 29.65% 31.50% 33.46% 37.30% 36.64% 37.36% 36.34% Total Depreciation & Amortization 841.0 710.0 801.0 804.8 519.6 527.9 509.4 934.4 648.2 646.5 636.1 972.1 % Total Revenue 13.24% 11.31% 12.18% 11.26% 7.49% 7.23% 6.83% 9.72% 6.79% 6.63% 6.35% 9.22% EBIT 1,216.0 1,268.0 1,170.0 952.1 1,553.7 1,636.1 1,840.3 2,283.4 2,914.9 2,925.0 3,104.8 2,857.8 EBIT Margin (%) 19.14% 20.21% 17.79% 13.32% 22.39% 22.42% 24.67% 23.74% 30.51% 30.01% 31.00% 27.11% Interest Expense 332.0 329.0 324.0 366.4 369.9 372.8 353.6 352.5 361.7 379.1 417.7 430.0 Interest Income (51.0) (22.0) (7.0) (34.1) (25.3) (21.3) (17.1) (19.7) (22.5) (33.0) (51.4) (57.1) Net Interest Expense 281.0 307.0 317.0 332.3 344.6 351.5 336.6 332.8 339.2 346.1 366.3 372.8 % Total Revenue 4.42% 4.89% 4.82% 4.65% 4.97% 4.82% 4.51% 3.46% 3.55% 3.55% 3.66% 3.54% EBT 935.0 961.0 853.0 619.8 1,209.1 1,284.6 1,503.7 1,950.6 2,575.7 2,578.9 2,738.5 2,485.0 EBT Margin (%) 14.72% 15.31% 12.97% 8.67% 17.42% 17.60% 20.16% 20.28% 26.96% 26.46% 27.35% 23.58% Income Tax Expense 185.0 223.0 202.0 114.1 214.1 225.9 264.8 365.4 469.3 468.0 501.3 467.0 Effective Tax Rate (%) 19.79% 23.20% 23.68% 18.40% 17.71% 17.59% 17.61% 18.73% 18.22% 18.15% 18.31% 18.79% Noncontrolling Interest (30.0) (18.0) 3.0 (10.4) (19.6) (20.6) (24.2) (17.3) (27.6) (26.4) (31.1) (25.4) Net Income 780.0 756.0 648.0 516.2 1,014.6 1,079.3 1,263.2 1,602.5 2,134.0 2,137.4 2,268.3 2,043.4 Net Profit Margin (%) 12.28% 12.05% 9.85% 7.22% 14.62% 14.79% 16.93% 16.66% 22.34% 21.93% 22.65% 19.39% Earnings Per Share Basic 0.59 0.58 0.49 0.39 0.77 0.82 0.96 0.94 1.25 1.25 1.33 1.19 Diluted 0.59 0.58 0.49 0.39 0.77 0.82 0.96 0.94 1.25 1.25 1.32 1.19 Accretion / (Dilution) Analysis AZN Non-Merged Diluted EPS (Historical and Forecasted) 0.59 0.58 0.49 0.39 0.77 0.82 0.96 0.67 1.09 1.05 1.21 0.96 Accretion / (Dilution) - - - - - - - 0.27 0.15 0.19 0.12 0.23 AZN/ALXN Merged Diluted EPS (Historical and Forecasted) 0.59 0.58 0.49 0.39 0.77 0.82 0.96 0.94 1.25 1.25 1.32 1.19 Percent Accretion / (Dilution) 0.00% 0.00% 0.00% 0.00% 0.00% 0.00% 0.00% 40.25% 13.95% 18.40% 9.57% 24.49% Avg. Common Shares Outstanding Basic 1,322.0 1,303.4 1,322.4 1,312.7 1,312.7 1,312.7 1,312.7 1,710.7 1,710.7 1,710.7 1,710.7 1,710.7 Diluted 1,322.0 1,303.4 1,322.4 1,313.9 1,313.9 1,313.9 1,313.9 1,712.0 1,712.0 1,712.0 1,712.0 1,712.0 New Share Issuance 398.1 - - - - AstraZeneca / Alexion (NASDAQ: AZN) Income Statements