
Empfohlen
Empfohlen
Weitere ähnliche Inhalte
Was ist angesagt?
Was ist angesagt? (15)
Ähnlich wie Market watch jan 2019 frank yu oakville
Ähnlich wie Market watch jan 2019 frank yu oakville (17)
Kürzlich hochgeladen
Kürzlich hochgeladen (20)
Market watch jan 2019 frank yu oakville
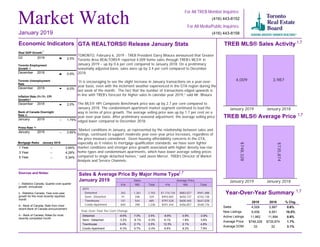
- 1. Toronto Employment Growth December 2018 0.9% Month January 2019 1 Year 3 Year 5 Year 3.64% 4.29% 5.34% January 2019 1 Year 3 Year 5 Year -- -- -- Market Watch For All TREB Member Inquiries: (416) 443-8158 For All Media/Public Inquiries: (416) 443-8152 GTA REALTORS® Release January Stats TORONTO, February 6, 2019 - TREB President Garry Bhaura announced that Greater Toronto Area REALTORS® reported 4,009 home sales through TREB’s MLS® in January 2019 – up by 0.6 per cent compared to January 2018. On a preliminary seasonally adjusted basis, sales were up by 3.4 per cent compared to December 2018. “It is encouraging to see the slight increase in January transactions on a year-over- year basis, even with the inclement weather experienced in the GTA region during the last week of the month. The fact that the number of transactions edged upwards is in line with TREB’s forecast for higher sales in calendar year 2019,” said Mr. Bhaura The MLS® HPI Composite Benchmark price was up by 2.7 per cent compared to January 2018. The condominium apartment market segment continued to lead the way in terms of price growth. The average selling price was up by 1.7 per cent on a year-over-year basis. After preliminary seasonal adjustment, the average selling price edged lower compared to December 2018. “Market conditions in January, as represented by the relationship between sales and listings, continued to support moderate year-over-year price increases, regardless of the price measure considered. Given housing affordability concerns in the GTA, especially as it relates to mortgage qualification standards, we have seen tighter market conditions and stronger price growth associated with higher density low-rise home types and condominium apartments, which have lower average selling prices compared to single detached homes,” said Jason Mercer, TREB’s Director of Market Analysis and Service Channels. TREB MLS® Sales Activity 4,009 3,987 January 2019 January 2018 TREB MLS® Average Price $748,328 $735,874 January 2019 January 2018 Year-Over-Year Summary 2019 2018 % Chg. Sales New Listings Active Listings Average Price Average DOM 4,009 3,987 0.6% 9,456 8,561 10.5% 11,962 11,894 0.6% $748,328 $735,874 1.7% 33 32 3.1% Sources and Notes: i - Statistics Canada, Quarter-over-quarter growth, annualized ii - Statistics Canada, Year-over-year growth for the most recently reported month iii - Bank of Canada, Rate from most recent Bank of Canada announcement iv - Bank of Canada, Rates for most recently completed month Real GDP Growth Q3 2018 2.0% Toronto Unemployment Rate December 2018 6.0% Inflation Rate (Yr./Yr. CPI Growth) December 2018 2.0% Bank of Canada Overnight Rate January 2019 -- 1.75% Prime Rate January 2019 -- 3.95% Economic Indicators Metrics Sales Average Price 416 905 Total 416 905 Total 2019 Detached Semi - Detached Townhouse Condo Apartment 342 1,361 1,703 $1,174,134 $883,027 $941,488 91 248 339 $993,465 $650,737 $742,738 141 544 685 $797,528 $600,465 $641,028 840 398 1,238 $591,444 $456,857 $548,176 Sales & Average Price By Major Home Type January 2019 January 2019 i ii ii iii iv Detached Semi - Detached Townhouse Condo Apartment -8.8% 0.9% -2.8% 6.1% 1.8% 3.6% 12.3% 2.1% 4.6% 8.8% 8.2% 7.9% Detached Semi - Detached Townhouse Condo Apartment -8.6% 7.0% 3.5% -3.2% -6.1% -5.3% 4.4% 2.1% 2.5% -6.3% 6.7% -2.4% 1,7 1,7 1,7 1,7 Year-Over-Year Per Cent Change Mortgage Rates
- 2. Toronto Real Estate Board Market Watch, January 2019 SALES BY PRICE RANGE AND HOUSE TYPE JANUARY 2019 2 Price Range Detached Semi-Detached Att/Row/Twnhouse Condo Townhouse Condo Apt Link Co-op Apt Det Condo Co-ownership Apt Total $0 to $99,999 $100,000 to $199,999 $200,000 to $299,999 $300,000 to $399,999 $400,000 to $499,999 $500,000 to $599,999 $600,000 to $699,999 $700,000 to $799,999 $800,000 to $899,999 $900,000 to $999,999 $1,000,000 to $1,249,999 $1,250,000 to $1,499,999 $1,500,000 to $1,749,999 $1,750,000 to $1,999,999 $2,000,000+ 1 0 0 0 0 0 0 0 0 1 2 0 0 0 7 0 0 0 0 9 9 0 1 2 35 0 2 0 0 49 39 8 4 30 226 1 0 1 1 310 82 19 51 101 400 7 1 1 0 662 154 51 74 84 254 8 0 0 0 625 258 105 117 45 139 5 0 0 1 670 275 77 49 20 69 6 0 0 0 496 229 28 43 6 36 7 0 0 0 349 173 13 20 4 22 3 0 0 0 235 212 18 9 4 23 0 0 0 0 266 118 14 9 2 9 0 0 0 0 152 52 3 3 3 9 0 0 0 0 70 34 1 1 0 3 0 0 0 0 39 65 2 1 2 6 0 0 0 0 76 Price Range Detached Semi-Detached Att/Row/Twnhouse Condo Townhouse Condo Apt Link Co-op Apt Det Condo Co-ownership Apt Total $0 to $99,999 $100,000 to $199,999 $200,000 to $299,999 $300,000 to $399,999 $400,000 to $499,999 $500,000 to $599,999 $600,000 to $699,999 $700,000 to $799,999 $800,000 to $899,999 $900,000 to $999,999 $1,000,000 to $1,249,999 $1,250,000 to $1,499,999 $1,500,000 to $1,749,999 $1,750,000 to $1,999,999 $2,000,000+ 1 0 0 0 0 0 0 0 0 1 2 0 0 0 7 0 0 0 0 9 9 0 1 2 35 0 2 0 0 49 39 8 4 30 226 1 0 1 1 310 82 19 51 101 400 7 1 1 0 662 154 51 74 84 254 8 0 0 0 625 258 105 117 45 139 5 0 0 1 670 275 77 49 20 69 6 0 0 0 496 229 28 43 6 36 7 0 0 0 349 173 13 20 4 22 3 0 0 0 235 212 18 9 4 23 0 0 0 0 266 118 14 9 2 9 0 0 0 0 152 52 3 3 3 9 0 0 0 0 70 34 1 1 0 3 0 0 0 0 39 65 2 1 2 6 0 0 0 0 76 SALES BY PRICE RANGE AND HOUSE TYPE YEAR-TO-DATE, 2019 Total Sales Share of Total Sales Average Price 1,703 339 382 303 1,238 37 3 2 2 4,009 42.5% 8.5% 9.5% 7.6% 30.9% 0.9% 0.1% 0.0% 0.0% 100.0% $941,488 $742,738 $699,154 $567,748 $548,176 $658,284 $331,967 $433,450 $469,000 $748,328 Total Sales Share of Total Sales Average Price 1,703 339 382 303 1,238 37 3 2 2 4,009 42.5% 8.5% 9.5% 7.6% 30.9% 0.9% 0.1% 0.0% 0.0% 100.0% $941,488 $742,738 $699,154 $567,748 $548,176 $658,284 $331,967 $433,450 $469,000 $748,328 1,7 1,7
- 3. Toronto Real Estate Board Market Watch, January 2019 Number of Sales Dollar Volume Average Price Median Price New Listings SNLR (Trend) Active Listings Mos. Inv. (Trend) Avg. SP / LP Avg. DOM TREB Total Halton Region Burlington Halton Hills Milton Oakville Peel Region Brampton Caledon Mississauga City of Toronto Toronto West Toronto Central Toronto East York Region Aurora E. Gwillimbury Georgina King Markham Newmarket Richmond Hill Vaughan Whitchurch-Stouffville Durham Region Ajax Brock Clarington Oshawa Pickering Scugog Uxbridge Whitby Dufferin County Orangeville Simcoe County Adjala-Tosorontio Bradford West GwillimburyEssa Innisfil New Tecumseth 4,009 $3,000,045,686 748,328 $650,000 9,456 49.4% 11,962 2.7 98% 33 425 $363,270,505 854,754 $752,500 980 51.2% 1,265 2.7 97% 37 124 $90,134,814 726,894 $665,000 262 57.5% 322 2.4 97% 32 40 $30,115,350 752,884 $677,675 90 55.5% 115 2.2 97% 37 108 $82,364,577 762,635 $735,000 208 54.1% 224 2.2 98% 36 153 $160,655,764 1,050,038 $920,000 420 44.9% 604 3.5 96% 43 894 $622,840,642 696,690 $649,250 1,713 52.7% 1,896 2.2 98% 29 466 $316,245,522 678,638 $651,000 800 51.5% 829 2.2 98% 29 42 $34,278,155 816,147 $810,000 116 46.2% 190 3.7 97% 44 386 $272,316,965 705,484 $603,750 797 54.8% 877 2.1 97% 29 1,422 $1,105,852,860 777,674 $647,000 3,144 57.3% 3,575 1.9 99% 29 411 $279,166,494 679,237 $623,000 816 59.9% 957 1.9 99% 29 656 $577,985,671 881,076 $640,000 1,677 55.7% 1,903 2.0 98% 28 355 $248,700,695 700,565 $675,000 651 57.7% 715 1.8 101% 31 589 $513,219,697 871,341 $795,000 1,994 35.4% 3,095 4.7 96% 41 51 $43,875,200 860,298 $752,000 143 36.0% 190 4.5 91% 40 22 $20,049,499 911,341 $823,500 102 30.0% 181 6.5 95% 65 40 $22,837,600 570,940 $517,250 127 34.3% 179 5.0 96% 40 18 $23,716,260 1,317,570 $1,187,500 78 25.3% 167 9.1 96% 62 150 $121,596,628 810,644 $795,500 473 39.8% 673 3.9 98% 36 48 $36,028,300 750,590 $730,000 168 36.6% 256 4.4 97% 41 111 $102,542,760 923,809 $780,000 347 32.0% 590 5.4 94% 39 129 $122,999,150 953,482 $868,000 464 36.0% 691 4.3 97% 40 20 $19,574,300 978,715 $808,500 92 34.4% 168 5.5 96% 46 508 $293,591,182 577,935 $535,000 1,181 48.6% 1,378 2.5 98% 32 69 $45,064,300 653,106 $634,000 147 54.6% 156 1.9 98% 25 13 $6,238,500 479,885 $522,000 28 43.4% 60 4.8 96% 39 101 $55,657,700 551,066 $520,000 251 49.3% 269 2.3 98% 29 156 $75,482,183 483,860 $458,850 333 45.8% 358 2.5 98% 29 50 $33,943,599 678,872 $655,500 120 52.3% 163 2.4 99% 30 17 $13,747,500 808,676 $635,000 40 44.6% 65 4.1 94% 60 19 $14,310,500 753,184 $680,000 55 41.4% 86 5.2 97% 71 83 $49,146,900 592,131 $550,000 207 48.2% 221 2.3 97% 32 30 $16,059,300 535,310 $519,500 56 65.7% 59 1.8 99% 29 30 $16,059,300 535,310 $519,500 56 65.7% 59 1.8 99% 29 141 $85,211,500 604,337 $575,000 388 38.4% 694 4.8 97% 50 7 $4,482,300 640,329 $639,900 15 48.3% 36 4.1 97% 39 37 $25,706,000 694,757 $660,000 100 40.2% 138 4.2 98% 41 13 $6,711,400 516,262 $517,000 47 41.6% 99 4.3 98% 52 48 $28,316,000 589,917 $523,250 157 28.1% 284 7.1 97% 55 36 $19,995,800 555,439 $552,000 69 49.4% 137 3.7 97% 55 SUMMARY OF EXISTING HOME TRANSACTIONS ALL HOME TYPES, JANUARY 2019 ALL TREB AREAS 3 1 1 1 2 5498 3
- 4. Toronto Real Estate Board Market Watch, January 2019 SUMMARY OF EXISTING HOME TRANSACTIONS ALL HOME TYPES, JANUARY 2019 CITY OF TORONTO MUNICIPAL BREAKDOWN 4 Number of Sales Dollar Volume Average Price Median Price New Listings SNLR (Trend) Active Listings Mos. Inv. (Trend) Avg. SP / LP Avg. DOM TREB Total City of Toronto Total Toronto West Toronto W01 Toronto W02 Toronto W03 Toronto W04 Toronto W05 Toronto W06 Toronto W07 Toronto W08 Toronto W09 Toronto W10 Toronto Central Toronto C01 Toronto C02 Toronto C03 Toronto C04 Toronto C06 Toronto C07 Toronto C08 Toronto C09 Toronto C10 Toronto C11 Toronto C12 Toronto C13 Toronto C14 Toronto C15 Toronto East Toronto E01 Toronto E02 Toronto E03 Toronto E04 Toronto E05 Toronto E06 Toronto E07 Toronto E08 Toronto E09 Toronto E10 Toronto E11 4,009 $3,000,045,686 $748,328 $650,000 9,456 49.4% 11,962 2.7 98% 33 1,422 $1,105,852,860 $777,674 $647,000 3,144 57.3% 3,575 1.9 99% 29 411 $279,166,494 $679,237 $623,000 816 59.9% 957 1.9 99% 29 14 $8,441,500 $602,964 $543,500 27 71.6% 22 1.1 100% 17 33 $29,817,748 $903,568 $785,000 57 68.9% 44 1.0 106% 12 22 $17,444,000 $792,909 $764,000 43 60.9% 46 1.7 98% 28 42 $25,691,279 $611,697 $550,250 91 53.8% 135 2.5 98% 35 61 $36,997,314 $606,513 $640,000 118 58.3% 163 2.4 97% 39 86 $59,898,153 $696,490 $614,000 186 57.7% 230 2.1 99% 28 8 $8,866,000 $1,108,250 $1,097,500 14 65.1% 16 1.4 98% 22 71 $51,993,700 $732,306 $517,000 148 60.5% 157 1.8 98% 27 21 $13,641,500 $649,595 $581,000 51 56.8% 51 2.2 98% 34 53 $26,375,300 $497,647 $423,000 81 56.4% 93 2.1 97% 34 656 $577,985,671 $881,076 $640,000 1,677 55.7% 1,903 2.0 98% 28 207 $146,273,169 $706,634 $620,000 446 65.1% 430 1.4 100% 25 35 $51,385,600 $1,468,160 $1,185,500 99 57.4% 109 2.0 97% 28 19 $24,034,000 $1,264,947 $1,050,000 58 54.9% 55 2.0 103% 12 25 $38,476,400 $1,539,056 $1,462,000 94 44.9% 121 2.6 97% 31 13 $10,023,688 $771,053 $609,000 36 52.2% 45 2.5 97% 20 45 $35,243,290 $783,184 $600,000 118 44.3% 177 3.4 94% 45 80 $58,609,325 $732,617 $610,000 219 61.0% 209 1.4 100% 19 9 $22,350,900 $2,483,433 $1,850,000 30 62.6% 31 1.9 104% 13 34 $30,930,988 $909,735 $709,500 61 64.5% 42 1.3 100% 17 24 $14,021,788 $584,241 $441,000 38 61.9% 43 1.6 99% 21 12 $23,836,525 $1,986,377 $1,112,250 80 29.8% 131 6.2 92% 40 27 $26,987,399 $999,533 $699,999 70 52.0% 81 2.4 97% 38 61 $51,554,300 $845,152 $599,000 165 49.2% 211 2.7 96% 31 65 $44,258,299 $680,897 $580,000 163 49.5% 218 2.8 98% 37 355 $248,700,695 $700,565 $675,000 651 57.7% 715 1.8 101% 31 20 $20,361,423 $1,018,071 $960,000 41 68.4% 37 0.9 111% 16 20 $20,028,200 $1,001,410 $951,500 36 68.5% 33 1.0 110% 19 28 $27,725,625 $990,201 $865,000 53 62.3% 57 1.3 106% 23 57 $36,347,500 $637,675 $675,000 91 60.5% 87 1.7 99% 27 41 $28,425,800 $693,312 $559,000 69 51.1% 81 2.6 97% 36 15 $11,027,000 $735,133 $630,000 38 45.4% 45 2.5 99% 19 45 $26,336,589 $585,258 $450,000 75 53.9% 91 2.4 97% 40 25 $15,486,000 $619,440 $661,000 43 55.4% 59 2.1 99% 39 52 $26,916,276 $517,621 $443,000 78 60.3% 70 1.7 99% 30 25 $19,173,582 $766,943 $730,000 51 49.0% 74 2.7 98% 45 27 $16,872,700 $624,915 $590,000 76 57.5% 81 1.8 97% 29 1 1 1 2 8 3 9 4 5
- 5. Toronto Real Estate Board Market Watch, January 2019 SUMMARY OF EXISTING HOME TRANSACTIONS ALL HOME TYPES, YEAR-TO-DATE 2019 ALL TREB AREAS 5 Number of Sales Dollar Volume Average Price Median Price New Listings Avg. SP / LP Avg. DOM TREB Total Halton Region Burlington Halton Hills Milton Oakville Peel Region Brampton Caledon Mississauga City of Toronto Toronto West Toronto Central Toronto East York Region Aurora E. Gwillimbury Georgina King Markham Newmarket Richmond Hill Vaughan Whitchurch-Stouffville Durham Region Ajax Brock Clarington Oshawa Pickering Scugog Uxbridge Whitby Dufferin County Orangeville Simcoe County Adjala-Tosorontio Bradford West GwillimburyEssa Innisfil New Tecumseth 4,009 $3,000,045,686 $748,328 $650,000 9,456 98% 33 425 $363,270,505 $854,754 $752,500 980 97% 37 124 $90,134,814 $726,894 $665,000 262 97% 32 40 $30,115,350 $752,884 $677,675 90 97% 37 108 $82,364,577 $762,635 $735,000 208 98% 36 153 $160,655,764 $1,050,038 $920,000 420 96% 43 894 $622,840,642 $696,690 $649,250 1,713 98% 29 466 $316,245,522 $678,638 $651,000 800 98% 29 42 $34,278,155 $816,147 $810,000 116 97% 44 386 $272,316,965 $705,484 $603,750 797 97% 29 1,422 $1,105,852,860 $777,674 $647,000 3,144 99% 29 411 $279,166,494 $679,237 $623,000 816 99% 29 656 $577,985,671 $881,076 $640,000 1,677 98% 28 355 $248,700,695 $700,565 $675,000 651 101% 31 589 $513,219,697 $871,341 $795,000 1,994 96% 41 51 $43,875,200 $860,298 $752,000 143 91% 40 22 $20,049,499 $911,341 $823,500 102 95% 65 40 $22,837,600 $570,940 $517,250 127 96% 40 18 $23,716,260 $1,317,570 $1,187,500 78 96% 62 150 $121,596,628 $810,644 $795,500 473 98% 36 48 $36,028,300 $750,590 $730,000 168 97% 41 111 $102,542,760 $923,809 $780,000 347 94% 39 129 $122,999,150 $953,482 $868,000 464 97% 40 20 $19,574,300 $978,715 $808,500 92 96% 46 508 $293,591,182 $577,935 $535,000 1,181 98% 32 69 $45,064,300 $653,106 $634,000 147 98% 25 13 $6,238,500 $479,885 $522,000 28 96% 39 101 $55,657,700 $551,066 $520,000 251 98% 29 156 $75,482,183 $483,860 $458,850 333 98% 29 50 $33,943,599 $678,872 $655,500 120 99% 30 17 $13,747,500 $808,676 $635,000 40 94% 60 19 $14,310,500 $753,184 $680,000 55 97% 71 83 $49,146,900 $592,131 $550,000 207 97% 32 30 $16,059,300 $535,310 $519,500 56 99% 29 30 $16,059,300 $535,310 $519,500 56 99% 29 141 $85,211,500 $604,337 $575,000 388 97% 50 7 $4,482,300 $640,329 $639,900 15 97% 39 37 $25,706,000 $694,757 $660,000 100 98% 41 13 $6,711,400 $516,262 $517,000 47 98% 52 48 $28,316,000 $589,917 $523,250 157 97% 55 36 $19,995,800 $555,439 $552,000 69 97% 55 1 1 1 2 4 5
- 6. Toronto Real Estate Board Market Watch, January 2019 SUMMARY OF EXISTING HOME TRANSACTIONS ALL HOME TYPES, YEAR-TO-DATE 2019 CITY OF TORONTO MUNICIPAL BREAKDOWN 6 Number of Sales Dollar Volume Average Price Median Price New Listings Avg. SP / LP Avg. DOM TREB Total City of Toronto Total Toronto West Toronto W01 Toronto W02 Toronto W03 Toronto W04 Toronto W05 Toronto W06 Toronto W07 Toronto W08 Toronto W09 Toronto W10 Toronto Central Toronto C01 Toronto C02 Toronto C03 Toronto C04 Toronto C06 Toronto C07 Toronto C08 Toronto C09 Toronto C10 Toronto C11 Toronto C12 Toronto C13 Toronto C14 Toronto C15 Toronto East Toronto E01 Toronto E02 Toronto E03 Toronto E04 Toronto E05 Toronto E06 Toronto E07 Toronto E08 Toronto E09 Toronto E10 Toronto E11 4,009 $3,000,045,686 $748,328 $650,000 9,456 98% 33 1,422 $1,105,852,860 $777,674 $647,000 3,144 99% 29 411 $279,166,494 $679,237 $623,000 816 99% 29 14 $8,441,500 $602,964 $543,500 27 100% 17 33 $29,817,748 $903,568 $785,000 57 106% 12 22 $17,444,000 $792,909 $764,000 43 98% 28 42 $25,691,279 $611,697 $550,250 91 98% 35 61 $36,997,314 $606,513 $640,000 118 97% 39 86 $59,898,153 $696,490 $614,000 186 99% 28 8 $8,866,000 $1,108,250 $1,097,500 14 98% 22 71 $51,993,700 $732,306 $517,000 148 98% 27 21 $13,641,500 $649,595 $581,000 51 98% 34 53 $26,375,300 $497,647 $423,000 81 97% 34 656 $577,985,671 $881,076 $640,000 1,677 98% 28 207 $146,273,169 $706,634 $620,000 446 100% 25 35 $51,385,600 $1,468,160 $1,185,500 99 97% 28 19 $24,034,000 $1,264,947 $1,050,000 58 103% 12 25 $38,476,400 $1,539,056 $1,462,000 94 97% 31 13 $10,023,688 $771,053 $609,000 36 97% 20 45 $35,243,290 $783,184 $600,000 118 94% 45 80 $58,609,325 $732,617 $610,000 219 100% 19 9 $22,350,900 $2,483,433 $1,850,000 30 104% 13 34 $30,930,988 $909,735 $709,500 61 100% 17 24 $14,021,788 $584,241 $441,000 38 99% 21 12 $23,836,525 $1,986,377 $1,112,250 80 92% 40 27 $26,987,399 $999,533 $699,999 70 97% 38 61 $51,554,300 $845,152 $599,000 165 96% 31 65 $44,258,299 $680,897 $580,000 163 98% 37 355 $248,700,695 $700,565 $675,000 651 101% 31 20 $20,361,423 $1,018,071 $960,000 41 111% 16 20 $20,028,200 $1,001,410 $951,500 36 110% 19 28 $27,725,625 $990,201 $865,000 53 106% 23 57 $36,347,500 $637,675 $675,000 91 99% 27 41 $28,425,800 $693,312 $559,000 69 97% 36 15 $11,027,000 $735,133 $630,000 38 99% 19 45 $26,336,589 $585,258 $450,000 75 97% 40 25 $15,486,000 $619,440 $661,000 43 99% 39 52 $26,916,276 $517,621 $443,000 78 99% 30 25 $19,173,582 $766,943 $730,000 51 98% 45 27 $16,872,700 $624,915 $590,000 76 97% 29 1 1 1 2 4 5
- 7. Toronto Real Estate Board Market Watch, January 2019 SUMMARY OF EXISTING HOME TRANSACTIONS DETACHED HOUSES, JANUARY 2019 ALL TREB AREAS 7 Sales Dollar Volume Average Price Median Price New Listings Active Listings Avg. SP / LP Avg. DOM TREB Total Halton Region Burlington Halton Hills Milton Oakville Peel Region Brampton Caledon Mississauga City of Toronto Toronto West Toronto Central Toronto East York Region Aurora E. Gwillimbury Georgina King Markham Newmarket Richmond Hill Vaughan Whitchurch-Stouffville Durham Region Ajax Brock Clarington Oshawa Pickering Scugog Uxbridge Whitby Dufferin County Orangeville Simcoe County Adjala-Tosorontio Bradford West GwillimburyEssa Innisfil New Tecumseth 1,703 $1,603,353,931 $941,488 $810,000 4,862 7,087 97% 39 235 $249,380,240 $1,061,193 $930,000 597 815 96% 44 65 $60,203,575 $926,209 $800,000 146 191 96% 35 30 $24,971,850 $832,395 $776,500 74 98 97% 40 60 $52,885,800 $881,430 $814,950 119 138 97% 44 80 $111,319,015 $1,391,488 $1,200,000 258 388 96% 51 355 $322,465,771 $908,354 $822,000 874 1,152 97% 33 212 $170,509,991 $804,292 $762,500 463 549 97% 30 28 $25,076,000 $895,571 $855,000 100 172 97% 55 115 $126,879,780 $1,103,302 $940,000 311 431 97% 34 342 $401,553,757 $1,174,134 $925,000 960 1,331 98% 34 122 $121,208,173 $993,510 $871,500 274 360 98% 34 77 $149,273,488 $1,938,617 $1,622,100 405 625 95% 33 143 $131,072,096 $916,588 $814,000 281 346 100% 34 300 $330,375,669 $1,101,252 $978,750 1,258 2,120 95% 46 26 $28,944,100 $1,113,235 $942,500 85 124 87% 48 19 $18,179,499 $956,816 $832,500 83 147 95% 71 35 $20,870,000 $596,286 $534,000 117 168 96% 41 16 $21,921,260 $1,370,079 $1,297,500 71 154 96% 61 44 $52,890,500 $1,202,057 $1,155,250 248 374 97% 40 32 $27,342,000 $854,438 $793,500 121 179 96% 39 42 $61,536,960 $1,465,166 $1,240,000 208 410 92% 49 68 $80,486,050 $1,183,618 $1,153,500 251 425 97% 42 18 $18,205,300 $1,011,406 $814,000 74 139 96% 47 337 $216,272,594 $641,758 $610,000 829 1,050 97% 34 43 $32,443,000 $754,488 $700,000 96 103 98% 25 13 $6,238,500 $479,885 $522,000 26 58 96% 39 70 $42,153,400 $602,191 $580,000 186 216 98% 34 103 $55,137,095 $535,312 $518,000 224 257 98% 29 27 $21,991,999 $814,518 $782,000 74 119 99% 28 17 $13,747,500 $808,676 $635,000 40 65 94% 60 14 $11,323,000 $808,786 $692,500 47 75 96% 78 50 $33,238,100 $664,762 $618,500 136 157 96% 35 19 $11,215,900 $590,311 $546,500 35 38 99% 30 19 $11,215,900 $590,311 $546,500 35 38 99% 30 115 $72,090,000 $626,870 $622,000 309 581 97% 55 7 $4,482,300 $640,329 $639,900 15 36 97% 39 30 $21,865,000 $728,833 $683,000 76 119 98% 47 11 $5,876,400 $534,218 $521,000 39 77 98% 53 41 $23,956,000 $584,293 $555,000 132 241 97% 60 26 $15,910,300 $611,935 $602,500 47 108 97% 63 1 2 3 4 51 1 1
- 8. Toronto Real Estate Board Market Watch, January 2019 SUMMARY OF EXISTING HOME TRANSACTIONS DETACHED HOUSES, JANUARY 2019 CITY OF TORONTO MUNICIPAL BREAKDOWN 8 Sales Dollar Volume Average Price Median Price New Listings Active Listings Avg. SP / LP Avg. DOM TREB Total City of Toronto Total Toronto West Toronto W01 Toronto W02 Toronto W03 Toronto W04 Toronto W05 Toronto W06 Toronto W07 Toronto W08 Toronto W09 Toronto W10 Toronto Central Toronto C01 Toronto C02 Toronto C03 Toronto C04 Toronto C06 Toronto C07 Toronto C08 Toronto C09 Toronto C10 Toronto C11 Toronto C12 Toronto C13 Toronto C14 Toronto C15 Toronto East Toronto E01 Toronto E02 Toronto E03 Toronto E04 Toronto E05 Toronto E06 Toronto E07 Toronto E08 Toronto E09 Toronto E10 Toronto E11 1,703 $1,603,353,931 $941,488 $810,000 4,862 7,087 97% 39 342 $401,553,757 $1,174,134 $925,000 960 1,331 98% 34 122 $121,208,173 $993,510 $871,500 274 360 98% 34 0 $0 - $0 3 8 - - 8 $10,808,849 $1,351,106 $1,425,000 17 15 105% 16 15 $12,402,500 $826,833 $795,000 30 29 97% 26 19 $16,320,000 $858,947 $819,000 38 62 96% 45 14 $12,769,900 $912,136 $867,500 29 46 95% 58 16 $16,952,624 $1,059,539 $997,500 29 52 98% 28 7 $8,026,000 $1,146,571 $1,220,000 11 12 98% 24 17 $23,481,300 $1,381,253 $1,150,000 56 75 98% 22 7 $6,966,500 $995,214 $890,000 24 26 96% 65 19 $13,480,500 $709,500 $718,000 37 35 97% 29 77 $149,273,488 $1,938,617 $1,622,100 405 625 95% 33 3 $4,095,000 $1,365,000 $1,570,000 5 7 99% 25 1 $1,505,000 $1,505,000 $1,505,000 10 12 100% 4 11 $15,929,000 $1,448,091 $1,350,000 31 29 104% 11 15 $30,672,000 $2,044,800 $1,800,000 67 94 96% 30 5 $5,684,388 $1,136,878 $1,160,000 22 32 96% 22 5 $10,610,000 $2,122,000 $2,450,000 58 97 88% 69 1 $1,750,000 $1,750,000 $1,750,000 2 2 104% 10 2 $9,700,000 $4,850,000 $4,850,000 8 11 98% 11 3 $5,879,000 $1,959,667 $1,735,000 5 5 96% 27 2 $4,247,100 $2,123,550 $2,123,550 14 15 100% 6 2 $13,448,000 $6,724,000 $6,724,000 49 97 89% 54 9 $16,213,000 $1,801,444 $1,618,000 26 36 97% 31 10 $18,998,000 $1,899,800 $1,867,500 63 106 92% 51 8 $10,543,000 $1,317,875 $1,175,000 45 82 97% 51 143 $131,072,096 $916,588 $814,000 281 346 100% 34 3 $2,969,000 $989,667 $935,000 5 9 114% 5 4 $5,831,000 $1,457,750 $1,450,000 13 16 109% 12 19 $20,448,625 $1,076,243 $870,000 31 38 104% 25 28 $23,548,500 $841,018 $785,000 52 51 99% 32 16 $16,629,500 $1,039,344 $1,052,500 21 23 98% 34 8 $6,459,000 $807,375 $697,500 27 33 98% 25 14 $12,387,389 $884,814 $856,500 22 34 96% 53 12 $9,786,500 $815,542 $812,500 25 34 99% 28 15 $11,545,500 $769,700 $750,000 26 26 100% 26 16 $13,875,082 $867,193 $757,500 38 57 98% 52 8 $7,592,000 $949,000 $892,500 21 25 96% 38 1 1 1 1 2 3 4 5
- 9. Toronto Real Estate Board Market Watch, January 2019 SUMMARY OF EXISTING HOME TRANSACTIONS SEMI-DETACHED HOUSES, JANUARY 2019 ALL TREB AREAS 9 Sales Dollar Volume Average Price Median Price New Listings Active Listings Avg. SP / LP Avg. DOM TREB Total Halton Region Burlington Halton Hills Milton Oakville Peel Region Brampton Caledon Mississauga City of Toronto Toronto West Toronto Central Toronto East York Region Aurora E. Gwillimbury Georgina King Markham Newmarket Richmond Hill Vaughan Whitchurch-Stouffville Durham Region Ajax Brock Clarington Oshawa Pickering Scugog Uxbridge Whitby Dufferin County Orangeville Simcoe County Adjala-Tosorontio Bradford West GwillimburyEssa Innisfil New Tecumseth 339 $251,788,045 $742,738 $685,001 614 577 101% 26 20 $13,620,222 $681,011 $661,000 45 43 99% 21 6 $3,884,222 $647,370 $656,500 12 12 100% 16 4 $2,173,500 $543,375 $545,250 5 4 98% 28 6 $4,134,500 $689,083 $677,500 12 14 98% 28 4 $3,428,000 $857,000 $686,250 16 13 99% 13 155 $103,942,651 $670,598 $665,900 223 176 98% 26 106 $68,747,551 $648,562 $649,000 139 101 98% 26 5 $3,227,000 $645,400 $622,000 7 7 98% 16 44 $31,968,100 $726,548 $730,000 77 68 99% 28 91 $90,405,322 $993,465 $890,000 174 175 105% 27 31 $26,382,314 $851,042 $760,000 52 64 101% 33 26 $31,401,885 $1,207,765 $1,060,000 55 61 102% 28 34 $32,621,123 $959,445 $909,000 67 50 111% 20 31 $23,553,450 $759,789 $775,000 103 120 99% 32 1 $700,000 $700,000 $700,000 9 12 97% 50 2 $1,350,000 $675,000 $675,000 7 14 99% 8 0 - - - 2 2 - - 0 - - - 1 2 - - 9 $7,626,550 $847,394 $845,000 33 37 100% 19 6 $3,499,400 $583,233 $607,500 12 13 98% 63 5 $4,089,500 $817,900 $749,500 22 23 98% 18 8 $6,288,000 $786,000 $785,000 15 15 97% 35 0 - - - 2 2 - - 32 $15,678,000 $489,938 $505,000 55 52 97% 22 6 $3,496,500 $582,750 $576,500 13 14 97% 25 0 - - - 0 0 - - 2 $670,000 $335,000 $335,000 2 4 96% 7 14 $5,710,500 $407,893 $407,500 29 25 98% 16 7 $4,191,000 $598,714 $545,000 5 4 97% 28 0 - - - 0 0 - - 0 - - - 1 1 - - 3 $1,610,000 $536,667 $550,000 5 4 97% 35 5 $2,233,400 $446,680 $445,000 4 2 99% 20 5 $2,233,400 $446,680 $445,000 4 2 99% 20 5 $2,355,000 $471,000 $500,000 10 9 97% 21 0 - - - 0 0 - - 1 $530,000 $530,000 $530,000 5 5 98% 33 0 - - - 0 0 - - 1 $500,000 $500,000 $500,000 0 0 93% 48 3 $1,325,000 $441,667 $425,000 5 4 97% 8 1 1 1 1 2 3 4 5
- 10. Toronto Real Estate Board Market Watch, January 2019 SUMMARY OF EXISTING HOME TRANSACTIONS SEMI-DETACHED HOUSES, JANUARY 2019 CITY OF TORONTO MUNICIPAL BREAKDOWN 10 Sales Dollar Volume Average Price Median Price New Listings Active Listings Avg. SP / LP Avg. DOM TREB Total City of Toronto Total Toronto West Toronto W01 Toronto W02 Toronto W03 Toronto W04 Toronto W05 Toronto W06 Toronto W07 Toronto W08 Toronto W09 Toronto W10 Toronto Central Toronto C01 Toronto C02 Toronto C03 Toronto C04 Toronto C06 Toronto C07 Toronto C08 Toronto C09 Toronto C10 Toronto C11 Toronto C12 Toronto C13 Toronto C14 Toronto C15 Toronto East Toronto E01 Toronto E02 Toronto E03 Toronto E04 Toronto E05 Toronto E06 Toronto E07 Toronto E08 Toronto E09 Toronto E10 Toronto E11 339 $251,788,045 $742,738 $685,001 614 577 101% 26 91 $90,405,322 $993,465 $890,000 174 175 105% 27 31 $26,382,314 $851,042 $760,000 52 64 101% 33 0 - - - 5 5 - - 6 $6,639,500 $1,106,583 $1,078,750 12 9 113% 6 5 $3,888,000 $777,600 $760,000 8 11 98% 37 1 $720,000 $720,000 $720,000 0 2 98% 66 13 $9,244,814 $711,140 $709,314 18 25 99% 38 2 $2,820,000 $1,410,000 $1,410,000 4 7 90% 43 0 - - - 0 0 - - 0 - - - 1 1 - - 2 $1,710,000 $855,000 $855,000 3 2 103% 19 2 $1,360,000 $680,000 $680,000 1 2 95% 60 26 $31,401,885 $1,207,765 $1,060,000 55 61 102% 28 3 $3,050,386 $1,016,795 $975,000 8 14 103% 22 7 $11,212,500 $1,601,786 $1,400,000 9 6 100% 29 3 $2,780,000 $926,667 $925,000 7 6 114% 4 2 $3,102,000 $1,551,000 $1,551,000 3 1 98% 13 0 - - - 0 0 - - 1 $740,000 $740,000 $740,000 0 1 99% 48 0 - - - 4 5 - - 0 - - - 1 3 - - 4 $4,887,000 $1,221,750 $1,263,500 5 3 107% 14 0 - - - 2 2 - - 0 - - - 3 4 - - 2 $1,909,999 $955,000 $955,000 4 3 96% 54 0 - - - 0 0 - - 4 $3,720,000 $930,000 $902,500 9 13 96% 52 34 $32,621,123 $959,445 $909,000 67 50 111% 20 10 $11,248,423 $1,124,842 $1,097,500 23 13 116% 6 8 $8,107,700 $1,013,463 $951,500 11 7 114% 26 6 $6,315,000 $1,052,500 $1,062,500 12 5 116% 6 2 $1,200,500 $600,250 $600,250 4 4 100% 36 0 - - - 2 3 - - 2 $1,567,000 $783,500 $783,500 4 3 98% 15 1 $735,000 $735,000 $735,000 1 1 97% 19 1 $665,000 $665,000 $665,000 0 0 99% 87 0 - - - 2 1 - - 3 $2,210,000 $736,667 $730,000 1 4 98% 55 1 $572,500 $572,500 $572,500 7 9 99% 10 1 1 1 1 2 3 4 5
- 11. Toronto Real Estate Board Market Watch, January 2019 SUMMARY OF EXISTING HOME TRANSACTIONS CONDOMINIUM TOWNHOUSES, JANUARY 2019 ALL TREB AREAS 11 Sales Dollar Volume Average Price Median Price New Listings Active Listings Avg. SP / LP Avg. DOM TREB Total Halton Region Burlington Halton Hills Milton Oakville Peel Region Brampton Caledon Mississauga City of Toronto Toronto West Toronto Central Toronto East York Region Aurora E. Gwillimbury Georgina King Markham Newmarket Richmond Hill Vaughan Whitchurch-Stouffville Durham Region Ajax Brock Clarington Oshawa Pickering Scugog Uxbridge Whitby Dufferin County Orangeville Simcoe County Adjala-Tosorontio Bradford West GwillimburyEssa Innisfil New Tecumseth 303 $172,027,662 $567,748 $520,000 557 601 98% 29 37 $19,799,199 $535,113 $500,000 75 79 98% 26 18 $9,566,400 $531,467 $516,250 35 37 99% 23 4 $1,695,000 $423,750 $421,000 5 3 99% 21 2 $860,000 $430,000 $430,000 2 1 98% 29 13 $7,677,799 $590,600 $510,000 33 38 97% 30 103 $52,771,150 $512,341 $500,000 148 135 98% 29 45 $21,046,300 $467,696 $455,000 41 31 98% 32 0 - - - 0 0 - - 58 $31,724,850 $546,980 $534,550 107 104 98% 28 90 $62,676,513 $696,406 $601,500 196 222 99% 26 33 $18,551,800 $562,176 $545,000 72 85 100% 24 34 $31,606,025 $929,589 $714,000 82 82 98% 23 23 $12,518,688 $544,291 $530,000 42 55 98% 34 42 $24,250,400 $577,390 $561,000 73 95 98% 37 5 $2,311,700 $462,340 $466,000 13 19 101% 43 0 - - - 0 0 - - 1 $320,000 $320,000 $320,000 0 0 97% 40 0 - - - 0 0 - - 15 $9,454,200 $630,280 $640,000 29 36 99% 39 3 $1,521,000 $507,000 $473,000 9 10 98% 19 11 $6,121,000 $556,455 $530,000 9 17 97% 33 7 $4,522,500 $646,071 $625,000 13 13 98% 42 0 - - - 0 0 - - 30 $12,215,400 $407,180 $418,450 59 64 98% 27 4 $1,774,900 $443,725 $436,950 8 8 98% 23 0 - - - 1 1 - - 2 $675,000 $337,500 $337,500 3 1 99% 29 11 $3,837,500 $348,864 $330,100 31 32 97% 22 8 $3,951,000 $493,875 $517,500 7 12 99% 34 0 - - - 0 0 - - 0 - - - 3 4 - - 5 $1,977,000 $395,400 $392,000 6 6 99% 27 0 - - - 2 2 - - 0 - - - 2 2 - - 1 $315,000 $315,000 $315,000 4 4 98% 22 0 - - - 0 0 - - 0 - - - 3 2 - - 0 - - - 0 0 - - 0 - - - 0 1 - - 1 $315,000 $315,000 $315,000 1 1 98% 22 1 1 1 1 2 3 4 5
- 12. Toronto Real Estate Board Market Watch, January 2019 SUMMARY OF EXISTING HOME TRANSACTIONS CONDOMINIUM TOWNHOUSES, JANUARY 2019 CITY OF TORONTO MUNICIPAL BREAKDOWN 12 Sales Dollar Volume Average Price Median Price New Listings Active Listings Avg. SP / LP Avg. DOM TREB Total City of Toronto Total Toronto West Toronto W01 Toronto W02 Toronto W03 Toronto W04 Toronto W05 Toronto W06 Toronto W07 Toronto W08 Toronto W09 Toronto W10 Toronto Central Toronto C01 Toronto C02 Toronto C03 Toronto C04 Toronto C06 Toronto C07 Toronto C08 Toronto C09 Toronto C10 Toronto C11 Toronto C12 Toronto C13 Toronto C14 Toronto C15 Toronto East Toronto E01 Toronto E02 Toronto E03 Toronto E04 Toronto E05 Toronto E06 Toronto E07 Toronto E08 Toronto E09 Toronto E10 Toronto E11 303 $172,027,662 $567,748 $520,000 557 601 98% 29 90 $62,676,513 $696,406 $601,500 196 222 99% 26 33 $18,551,800 $562,176 $545,000 72 85 100% 24 2 $1,362,500 $681,250 $681,250 0 0 99% 27 4 $2,979,900 $744,975 $745,950 5 4 104% 18 0 - - - 0 0 - - 3 $1,402,500 $467,500 $430,000 14 17 98% 28 9 $4,336,000 $481,778 $472,000 26 30 98% 25 6 $4,284,000 $714,000 $724,000 11 9 101% 13 0 - - - 0 0 - - 1 $675,000 $675,000 $675,000 9 10 98% 21 1 $581,000 $581,000 $581,000 2 4 97% 7 7 $2,930,900 $418,700 $418,000 5 11 99% 36 34 $31,606,025 $929,589 $714,000 82 82 98% 23 9 $9,214,700 $1,023,856 $780,000 23 20 99% 18 1 $2,388,000 $2,388,000 $2,388,000 4 4 105% 15 1 $1,550,000 $1,550,000 $1,550,000 1 2 97% 19 0 - - - 0 0 - - 0 - - - 0 0 - - 2 $1,312,000 $656,000 $656,000 6 9 100% 5 1 $1,740,000 $1,740,000 $1,740,000 4 4 97% 13 1 $1,215,000 $1,215,000 $1,215,000 2 1 98% 14 0 - - - 3 3 - - 1 $472,000 $472,000 $472,000 1 1 118% 8 5 $5,539,025 $1,107,805 $1,105,000 13 12 97% 26 4 $2,363,800 $590,950 $630,000 3 4 96% 47 4 $2,603,500 $650,875 $621,500 8 7 98% 15 5 $3,208,000 $641,600 $635,000 14 15 98% 34 23 $12,518,688 $544,291 $530,000 42 55 98% 34 2 $1,995,000 $997,500 $997,500 4 5 100% 28 1 $682,500 $682,500 $682,500 2 0 105% 4 0 - - - 0 1 - - 2 $1,115,000 $557,500 $557,500 4 2 101% 12 7 $3,755,800 $536,543 $548,000 11 17 96% 36 0 - - - 0 2 - - 0 - - - 2 6 - - 1 $405,000 $405,000 $405,000 6 5 99% 51 5 $2,128,888 $425,778 $435,000 3 6 96% 38 2 $994,500 $497,250 $497,250 3 3 99% 38 3 $1,442,000 $480,667 $474,000 7 8 96% 46 1 1 1 1 2 3 4 5
- 13. Toronto Real Estate Board Market Watch, January 2019 SUMMARY OF EXISTING HOME TRANSACTIONS CONDOMINIUM APARTMENT, JANUARY 2019 ALL TREB AREAS 13 Sales Dollar Volume Average Price Median Price New Listings Active Listings Avg. SP / LP Avg. DOM TREB Total Halton Region Burlington Halton Hills Milton Oakville Peel Region Brampton Caledon Mississauga City of Toronto Toronto West Toronto Central Toronto East York Region Aurora E. Gwillimbury Georgina King Markham Newmarket Richmond Hill Vaughan Whitchurch-Stouffville Durham Region Ajax Brock Clarington Oshawa Pickering Scugog Uxbridge Whitby Dufferin County Orangeville Simcoe County Adjala-Tosorontio Bradford West GwillimburyEssa Innisfil New Tecumseth 1,238 $678,641,959 $548,176 $485,000 2,521 2,657 99% 29 60 $28,791,817 $479,864 $421,000 124 164 98% 36 26 $11,416,817 $439,108 $387,100 56 68 97% 34 0 - - - 1 1 - - 8 $3,850,250 $481,281 $463,875 16 20 98% 37 26 $13,524,750 $520,183 $421,000 51 75 97% 36 180 $77,949,635 $433,054 $420,500 313 280 98% 27 31 $12,140,900 $391,642 $400,000 45 39 98% 33 0 - - - 0 0 - - 149 $65,808,735 $441,669 $425,000 268 241 98% 26 840 $496,812,869 $591,444 $529,900 1,716 1,738 99% 27 213 $104,940,208 $492,677 $470,000 383 415 99% 27 494 $334,930,273 $677,997 $588,500 1,100 1,093 99% 26 133 $56,942,388 $428,138 $392,000 233 230 98% 31 124 $63,453,838 $511,725 $464,000 293 389 97% 38 4 $1,717,000 $429,250 $439,500 11 13 97% 48 0 - - - 1 1 - - 1 $340,000 $340,000 $340,000 2 2 92% 100 1 $715,000 $715,000 $715,000 2 4 96% 91 55 $28,744,838 $522,633 $475,000 108 145 98% 34 3 $1,162,000 $387,333 $390,000 9 14 93% 66 36 $16,939,900 $470,553 $452,500 48 67 97% 34 24 $13,835,100 $576,463 $481,000 104 128 96% 43 0 - - - 8 15 - - 29 $9,798,300 $337,872 $346,000 66 67 98% 37 4 $1,424,000 $356,000 $362,000 5 5 98% 18 0 - - - 0 0 - - 4 $1,259,400 $314,850 $326,750 16 15 99% 8 8 $1,882,000 $235,250 $209,500 11 16 96% 61 4 $1,550,500 $387,625 $371,250 20 18 99% 42 0 - - - 0 0 - - 1 $473,500 $473,500 $473,500 2 2 101% 55 8 $3,208,900 $401,113 $410,500 12 11 98% 33 3 $1,190,000 $396,667 $395,000 1 1 99% 43 3 $1,190,000 $396,667 $395,000 1 1 99% 43 2 $645,500 $322,750 $322,750 8 18 96% 72 0 - - - 0 0 - - 0 - - - 0 1 - - 0 - - - 0 0 - - 0 - - - 5 12 - - 2 $645,500 $322,750 $322,750 3 5 96% 72 1 1 1 1 2 3 4 5
- 14. Toronto Real Estate Board Market Watch, January 2019 SUMMARY OF EXISTING HOME TRANSACTIONS CONDOMINIUM APARTMENT, JANUARY 2019 CITY OF TORONTO MUNICIPAL BREAKDOWN 14 Sales Dollar Volume Average Price Median Price New Listings Active Listings Avg. SP / LP Avg. DOM TREB Total City of Toronto Total Toronto West Toronto W01 Toronto W02 Toronto W03 Toronto W04 Toronto W05 Toronto W06 Toronto W07 Toronto W08 Toronto W09 Toronto W10 Toronto Central Toronto C01 Toronto C02 Toronto C03 Toronto C04 Toronto C06 Toronto C07 Toronto C08 Toronto C09 Toronto C10 Toronto C11 Toronto C12 Toronto C13 Toronto C14 Toronto C15 Toronto East Toronto E01 Toronto E02 Toronto E03 Toronto E04 Toronto E05 Toronto E06 Toronto E07 Toronto E08 Toronto E09 Toronto E10 Toronto E11 1,238 $678,641,959 $548,176 $485,000 2,521 2,657 99% 29 840 $496,812,869 $591,444 $529,900 1,716 1,738 99% 27 213 $104,940,208 $492,677 $470,000 383 415 99% 27 11 $6,219,000 $565,364 $525,000 17 8 99% 16 15 $9,389,499 $625,967 $545,000 21 12 104% 10 2 $1,153,500 $576,750 $576,750 5 6 98% 24 19 $7,248,779 $381,515 $386,000 37 52 100% 24 20 $7,291,600 $364,580 $374,500 36 52 98% 32 58 $33,143,530 $571,440 $530,000 131 155 100% 30 0 - - - 0 2 - - 52 $27,506,400 $528,969 $487,000 81 70 99% 27 11 $4,384,000 $398,545 $435,000 18 15 98% 19 25 $8,603,900 $344,156 $367,000 37 43 97% 36 494 $334,930,273 $677,997 $588,500 1,100 1,093 99% 26 183 $121,563,083 $664,279 $598,888 399 381 100% 25 21 $26,268,100 $1,250,862 $1,100,000 70 82 98% 27 4 $3,775,000 $943,750 $737,500 18 17 99% 19 8 $4,702,400 $587,800 $587,500 21 23 100% 36 8 $4,339,300 $542,413 $545,450 14 13 98% 20 35 $21,133,290 $603,808 $543,890 54 67 96% 44 74 $50,527,325 $682,802 $596,000 201 191 99% 19 6 $11,435,900 $1,905,983 $1,625,000 18 15 111% 14 26 $18,514,988 $712,115 $680,000 47 30 100% 15 21 $9,302,688 $442,985 $416,888 21 24 98% 23 5 $4,849,500 $969,900 $825,000 15 16 97% 49 12 $6,500,600 $541,717 $477,500 33 33 98% 38 45 $27,047,800 $601,062 $519,000 94 93 98% 28 46 $24,970,299 $542,833 $494,500 95 108 98% 33 133 $56,942,388 $428,138 $392,000 233 230 98% 31 4 $3,169,000 $792,250 $782,000 7 8 97% 45 6 $4,057,000 $676,167 $598,500 8 9 99% 18 3 $962,000 $320,667 $325,000 10 13 93% 48 22 $8,321,500 $378,250 $368,500 30 30 98% 21 17 $7,305,500 $429,735 $435,000 32 34 97% 38 5 $3,001,000 $600,200 $601,000 6 4 101% 13 26 $10,317,700 $396,835 $385,000 42 39 97% 35 9 $3,413,500 $379,278 $351,000 11 18 97% 52 32 $13,241,888 $413,809 $399,444 46 36 99% 31 1 $225,000 $225,000 $225,000 4 5 95% 14 8 $2,928,300 $366,038 $330,500 37 34 99% 21 1 1 1 1 2 3 4 5
- 15. Toronto Real Estate Board Market Watch, January 2019 SUMMARY OF EXISTING HOME TRANSACTIONS LINK, JANUARY 2019 ALL TREB AREAS 15 Sales Dollar Volume Average Price Median Price New Listings Active Listings Avg. SP / LP Avg. DOM TREB Total Halton Region Burlington Halton Hills Milton Oakville Peel Region Brampton Caledon Mississauga City of Toronto Toronto West Toronto Central Toronto East York Region Aurora E. Gwillimbury Georgina King Markham Newmarket Richmond Hill Vaughan Whitchurch-Stouffville Durham Region Ajax Brock Clarington Oshawa Pickering Scugog Uxbridge Whitby Dufferin County Orangeville Simcoe County Adjala-Tosorontio Bradford West GwillimburyEssa Innisfil New Tecumseth 37 $24,356,500 $658,284 $655,000 75 91 99% 30 1 $739,000 $739,000 $739,000 3 5 100% 71 0 - - - 0 1 - - 0 - - - 2 3 - - 0 - - - 0 0 - - 1 $739,000 $739,000 $739,000 1 1 100% 71 6 $4,162,000 $693,667 $695,000 5 2 98% 26 2 $1,337,000 $668,500 $668,500 3 2 98% 51 0 - - - 0 0 - - 4 $2,825,000 $706,250 $695,000 2 0 98% 13 4 $2,965,500 $741,375 $752,500 5 9 102% 43 0 - - - 0 0 - - 1 $657,000 $657,000 $657,000 0 0 110% 32 3 $2,308,500 $769,500 $800,000 5 9 100% 47 9 $7,832,800 $870,311 $840,000 20 34 98% 31 0 - - - 2 2 - - 0 - - - 0 0 - - 0 - - - 0 1 - - 0 - - - 0 0 - - 7 $6,133,800 $876,257 $840,000 15 23 99% 30 0 - - - 0 0 - - 2 $1,699,000 $849,500 $849,500 2 4 94% 36 0 - - - 1 4 - - 0 - - - 0 0 - - 16 $8,098,200 $506,138 $500,500 30 25 99% 27 1 $487,000 $487,000 $487,000 2 2 97% 40 0 - - - 0 0 - - 8 $4,003,500 $500,438 $500,500 17 13 101% 12 3 $1,297,700 $432,567 $454,000 5 4 98% 33 0 - - - 2 1 - - 0 - - - 0 0 - - 1 $570,000 $570,000 $570,000 0 0 95% 91 3 $1,740,000 $580,000 $590,000 4 5 98% 36 0 - - - 1 1 - - 0 - - - 1 1 - - 1 $559,000 $559,000 $559,000 11 15 100% 9 0 - - - 0 0 - - 1 $559,000 $559,000 $559,000 5 4 100% 9 0 - - - 4 8 - - 0 - - - 0 1 - - 0 - - - 2 2 - - 1 1 1 1 2 3 4 5
- 16. Toronto Real Estate Board Market Watch, January 2019 SUMMARY OF EXISTING HOME TRANSACTIONS LINK, JANUARY 2019 CITY OF TORONTO MUNICIPAL BREAKDOWN 16 Sales Dollar Volume Average Price Median Price New Listings Active Listings Avg. SP / LP Avg. DOM TREB Total City of Toronto Total Toronto West Toronto W01 Toronto W02 Toronto W03 Toronto W04 Toronto W05 Toronto W06 Toronto W07 Toronto W08 Toronto W09 Toronto W10 Toronto Central Toronto C01 Toronto C02 Toronto C03 Toronto C04 Toronto C06 Toronto C07 Toronto C08 Toronto C09 Toronto C10 Toronto C11 Toronto C12 Toronto C13 Toronto C14 Toronto C15 Toronto East Toronto E01 Toronto E02 Toronto E03 Toronto E04 Toronto E05 Toronto E06 Toronto E07 Toronto E08 Toronto E09 Toronto E10 Toronto E11 37 $24,356,500 $658,284 $655,000 75 91 99% 30 4 $2,965,500 $741,375 $752,500 5 9 102% 43 0 - - - 0 0 - - 0 - - - 0 0 - - 0 - - - 0 0 - - 0 - - - 0 0 - - 0 - - - 0 0 - - 0 - - - 0 0 - - 0 - - - 0 0 - - 0 - - - 0 0 - - 0 - - - 0 0 - - 0 - - - 0 0 - - 0 - - - 0 0 - - 1 $657,000 $657,000 $657,000 0 0 110% 32 0 - - - 0 0 - - 0 - - - 0 0 - - 0 - - - 0 0 - - 0 - - - 0 0 - - 0 - - - 0 0 - - 0 - - - 0 0 - - 0 - - - 0 0 - - 0 - - - 0 0 - - 0 - - - 0 0 - - 0 - - - 0 0 - - 0 - - - 0 0 - - 0 - - - 0 0 - - 0 - - - 0 0 - - 1 $657,000 $657,000 $657,000 0 0 110% 32 3 $2,308,500 $769,500 $800,000 5 9 100% 47 0 - - - 0 0 - - 0 - - - 0 0 - - 0 - - - 0 0 - - 0 - - - 0 0 - - 0 - - - 1 3 - - 0 - - - 0 0 - - 2 $1,603,500 $801,750 $801,750 4 5 102% 43 0 - - - 0 0 - - 0 - - - 0 0 - - 0 - - - 0 0 - - 1 $705,000 $705,000 $705,000 0 1 97% 55 1 1 1 1 2 3 4 5
- 17. Toronto Real Estate Board Market Watch, January 2019 SUMMARY OF EXISTING HOME TRANSACTIONS ATTACHED/ROW/TOWNHOUSE, JANUARY 2019 ALL TREB AREAS 17 Sales Dollar Volume Average Price Median Price New Listings Active Listings Avg. SP / LP Avg. DOM TREB Total Halton Region Burlington Halton Hills Milton Oakville Peel Region Brampton Caledon Mississauga City of Toronto Toronto West Toronto Central Toronto East York Region Aurora E. Gwillimbury Georgina King Markham Newmarket Richmond Hill Vaughan Whitchurch-Stouffville Durham Region Ajax Brock Clarington Oshawa Pickering Scugog Uxbridge Whitby Dufferin County Orangeville Simcoe County Adjala-Tosorontio Bradford West GwillimburyEssa Innisfil New Tecumseth 382 $267,076,789 $699,154 $650,000 802 910 98% 28 71 $50,670,127 $713,664 $670,000 132 155 98% 29 8 $4,793,900 $599,238 $576,500 10 10 98% 31 2 $1,275,000 $637,500 $637,500 3 6 99% 34 32 $20,634,027 $644,813 $641,250 59 51 99% 23 29 $23,967,200 $826,455 $800,700 60 88 97% 34 95 $61,549,435 $647,889 $640,000 146 144 98% 26 70 $42,463,780 $606,625 $613,000 105 101 99% 25 9 $5,975,155 $663,906 $652,000 9 11 98% 28 16 $13,110,500 $819,406 $711,250 32 32 97% 30 51 $49,774,899 $975,978 $820,000 82 86 99% 28 10 $7,524,999 $752,500 $695,000 33 31 99% 24 22 $29,012,000 $1,318,727 $1,080,000 29 34 97% 43 19 $13,237,900 $696,732 $669,900 20 21 103% 13 83 $63,753,540 $768,115 $778,000 247 335 98% 32 15 $10,202,400 $680,160 $655,000 23 20 98% 22 1 $520,000 $520,000 $520,000 11 19 99% 60 3 $1,307,600 $435,867 $435,000 6 6 98% 18 1 $1,080,000 $1,080,000 $1,080,000 4 7 96% 54 20 $16,746,740 $837,337 $839,000 40 56 99% 41 4 $2,503,900 $625,975 $621,450 17 40 100% 27 15 $12,156,400 $810,427 $837,000 58 69 100% 33 22 $17,867,500 $812,159 $795,000 80 106 98% 31 2 $1,369,000 $684,500 $684,500 8 12 98% 40 63 $31,128,788 $494,108 $485,000 142 120 99% 25 10 $5,039,000 $503,900 $512,000 23 24 98% 21 0 - - - 1 1 - - 15 $6,896,400 $459,760 $449,900 27 20 99% 26 17 $7,617,388 $448,082 $450,888 33 24 100% 25 4 $2,259,100 $564,775 $572,800 12 9 96% 23 0 - - - 0 0 - - 3 $1,944,000 $648,000 $600,000 2 4 100% 38 14 $7,372,900 $526,636 $535,500 44 38 98% 23 3 $1,420,000 $473,333 $500,000 13 15 99% 23 3 $1,420,000 $473,333 $500,000 13 15 99% 23 16 $8,780,000 $548,750 $467,500 40 55 97% 22 0 - - - 0 0 - - 5 $2,752,000 $550,400 $568,000 11 7 100% 12 2 $835,000 $417,500 $417,500 4 14 97% 45 6 $3,860,000 $643,333 $427,500 20 29 96% 19 3 $1,333,000 $444,333 $470,000 5 5 96% 30 1 1 1 1 2 3 4 5
- 18. Toronto Real Estate Board Market Watch, January 2019 SUMMARY OF EXISTING HOME TRANSACTIONS ATTACHED/ROW/TOWNHOUSE, JANUARY 2019 CITY OF TORONTO MUNICIPAL BREAKDOWN 18 Sales Dollar Volume Average Price Median Price New Listings Active Listings Avg. SP / LP Avg. DOM TREB Total City of Toronto Total Toronto West Toronto W01 Toronto W02 Toronto W03 Toronto W04 Toronto W05 Toronto W06 Toronto W07 Toronto W08 Toronto W09 Toronto W10 Toronto Central Toronto C01 Toronto C02 Toronto C03 Toronto C04 Toronto C06 Toronto C07 Toronto C08 Toronto C09 Toronto C10 Toronto C11 Toronto C12 Toronto C13 Toronto C14 Toronto C15 Toronto East Toronto E01 Toronto E02 Toronto E03 Toronto E04 Toronto E05 Toronto E06 Toronto E07 Toronto E08 Toronto E09 Toronto E10 Toronto E11 382 $267,076,789 $699,154 $650,000 802 910 98% 28 51 $49,774,899 $975,978 $820,000 82 86 99% 28 10 $7,524,999 $752,500 $695,000 33 31 99% 24 1 $860,000 $860,000 $860,000 2 1 115% 8 0 - - - 2 4 - - 0 - - - 0 0 - - 0 - - - 2 2 - - 5 $3,355,000 $671,000 $670,000 9 10 96% 35 3 $2,469,999 $823,333 $960,000 10 6 98% 15 1 $840,000 $840,000 $840,000 3 2 100% 9 0 - - - 1 1 - - 0 - - - 3 3 - - 0 - - - 1 2 - - 22 $29,012,000 $1,318,727 $1,080,000 29 34 97% 43 8 $7,743,000 $967,875 $919,000 11 8 108% 52 4 $9,514,000 $2,378,500 $1,417,500 5 3 88% 39 0 - - - 0 0 - - 0 - - - 2 1 - - 0 - - - 0 0 - - 2 $1,448,000 $724,000 $724,000 0 3 98% 43 4 $4,592,000 $1,148,000 $1,118,500 6 5 102% 22 0 - - - 0 0 - - 1 $1,650,000 $1,650,000 $1,650,000 1 1 98% 27 0 - - - 0 1 - - 0 - - - 0 2 - - 0 - - - 4 5 - - 2 $2,905,000 $1,452,500 $1,452,500 0 5 95% 38 1 $1,160,000 $1,160,000 $1,160,000 0 0 97% 92 19 $13,237,900 $696,732 $669,900 20 21 103% 13 1 $980,000 $980,000 $980,000 2 2 123% 3 1 $1,350,000 $1,350,000 $1,350,000 2 1 135% 6 0 - - - 0 0 - - 3 $2,162,000 $720,667 $722,000 1 0 100% 18 1 $735,000 $735,000 $735,000 2 1 105% 6 0 - - - 1 3 - - 2 $1,293,000 $646,500 $646,500 4 6 100% 3 2 $1,216,000 $608,000 $608,000 1 1 98% 19 0 - - - 1 1 - - 3 $1,869,000 $623,000 $681,000 2 2 99% 7 6 $3,632,900 $605,483 $600,000 4 4 98% 19 1 1 1 1 2 3 4 5
- 19. Toronto Real Estate Board Market Watch, January 2019 SUMMARY OF EXISTING HOME TRANSACTIONS CO-OP APARTMENT, JANUARY 2019 ALL TREB AREAS 19 Sales Dollar Volume Average Price Median Price New Listings Active Listings Avg. SP / LP Average DOM TREB Total Halton Region Burlington Halton Hills Milton Oakville Peel Region Brampton Caledon Mississauga City of Toronto Toronto West Toronto Central Toronto East York Region Aurora E. Gwillimbury Georgina King Markham Newmarket Richmond Hill Vaughan Whitchurch-Stouffville Durham Region Ajax Brock Clarington Oshawa Pickering Scugog Uxbridge Whitby Dufferin County Orangeville Simcoe County Adjala-Tosorontio Bradford West GwillimburyEssa Innisfil New Tecumseth 3 $995,900 $331,967 $269,900 9 8 100% 28 1 $269,900 $269,900 $269,900 2 1 100% 13 1 $269,900 $269,900 $269,900 1 0 100% 13 0 - - - 0 0 - - 0 - - - 0 0 - - 0 - - - 1 1 - - 0 - - - 0 0 - - 0 - - - 0 0 - - 0 - - - 0 0 - - 0 - - - 0 0 - - 2 $726,000 $363,000 $363,000 7 7 99% 35 1 $228,000 $228,000 $228,000 1 1 98% 36 1 $498,000 $498,000 $498,000 3 3 100% 34 0 - - - 3 3 - - 0 - - - 0 0 - - 0 - - - 0 0 - - 0 - - - 0 0 - - 0 - - - 0 0 - - 0 - - - 0 0 - - 0 - - - 0 0 - - 0 - - - 0 0 - - 0 - - - 0 0 - - 0 - - - 0 0 - - 0 - - - 0 0 - - 0 - - - 0 0 - - 0 - - - 0 0 - - 0 - - - 0 0 - - 0 - - - 0 0 - - 0 - - - 0 0 - - 0 - - - 0 0 - - 0 - - - 0 0 - - 0 - - - 0 0 - - 0 - - - 0 0 - - 0 - - - 0 0 - - 0 - - - 0 0 - - 0 - - - 0 0 - - 0 - - - 0 0 - - 0 - - - 0 0 - - 0 - - - 0 0 - - 0 - - - 0 0 - - 0 - - - 0 0 - - 1 1 1 1 2 3 4 5
- 20. Toronto Real Estate Board Market Watch, January 2019 SUMMARY OF EXISTING HOME TRANSACTIONS CO-OP APARTMENT, JANUARY 2019 CITY OF TORONTO MUNICIPAL BREAKDOWN 20 Sales Dollar Volume Average Price Median Price New Listings Active Listings Avg. SP / LP Avg. DOM TREB Total City of Toronto Total Toronto West Toronto W01 Toronto W02 Toronto W03 Toronto W04 Toronto W05 Toronto W06 Toronto W07 Toronto W08 Toronto W09 Toronto W10 Toronto Central Toronto C01 Toronto C02 Toronto C03 Toronto C04 Toronto C06 Toronto C07 Toronto C08 Toronto C09 Toronto C10 Toronto C11 Toronto C12 Toronto C13 Toronto C14 Toronto C15 Toronto East Toronto E01 Toronto E02 Toronto E03 Toronto E04 Toronto E05 Toronto E06 Toronto E07 Toronto E08 Toronto E09 Toronto E10 Toronto E11 3 $995,900 $331,967 $269,900 9 8 100% 28 2 $726,000 $363,000 $363,000 7 7 99% 35 1 $228,000 $228,000 $228,000 1 1 98% 36 0 - - - 0 0 - - 0 - - - 0 0 - - 0 - - - 0 0 - - 0 - - - 0 0 - - 0 - - - 0 0 - - 1 $228,000 $228,000 $228,000 0 0 98% 36 0 - - - 0 0 - - 0 - - - 0 0 - - 0 - - - 1 1 - - 0 - - - 0 0 - - 1 $498,000 $498,000 $498,000 3 3 100% 34 0 - - - 0 0 - - 1 $498,000 $498,000 $498,000 1 1 100% 34 0 - - - 0 0 - - 0 - - - 0 0 - - 0 - - - 0 0 - - 0 - - - 0 0 - - 0 - - - 1 1 - - 0 - - - 1 1 - - 0 - - - 0 0 - - 0 - - - 0 0 - - 0 - - - 0 0 - - 0 - - - 0 0 - - 0 - - - 0 0 - - 0 - - - 0 0 - - 0 - - - 3 3 - - 0 - - - 0 0 - - 0 - - - 0 0 - - 0 - - - 0 0 - - 0 - - - 0 0 - - 0 - - - 0 0 - - 0 - - - 0 0 - - 0 - - - 0 0 - - 0 - - - 0 0 - - 0 - - - 0 0 - - 0 - - - 3 3 - - 0 - - - 0 0 - - 1 1 1 1 2 3 4 5
- 21. Toronto Real Estate Board Market Watch, January 2019 SUMMARY OF EXISTING HOME TRANSACTIONS DETACHED CONDOMINIUM, JANUARY 2019 ALL TREB AREAS 21 Sales Dollar Volume Average Price Median Price New Listings Active Listings Avg. SP / LP Avg. DOM TREB Total Halton Region Burlington Halton Hills Milton Oakville Peel Region Brampton Caledon Mississauga City of Toronto Toronto West Toronto Central Toronto East York Region Aurora E. Gwillimbury Georgina King Markham Newmarket Richmond Hill Vaughan Whitchurch-Stouffville Durham Region Ajax Brock Clarington Oshawa Pickering Scugog Uxbridge Whitby Dufferin County Orangeville Simcoe County Adjala-Tosorontio Bradford West GwillimburyEssa Innisfil New Tecumseth 2 $866,900 $433,450 $433,450 12 24 99% 63 0 - - - 2 3 - - 0 - - - 2 3 - - 0 - - - 0 0 - - 0 - - - 0 0 - - 0 - - - 0 0 - - 0 - - - 4 6 - - 0 - - - 4 6 - - 0 - - - 0 0 - - 0 - - - 0 0 - - 0 - - - 0 1 - - 0 - - - 0 0 - - 0 - - - 0 0 - - 0 - - - 0 1 - - 0 - - - 0 2 - - 0 - - - 0 0 - - 0 - - - 0 0 - - 0 - - - 0 0 - - 0 - - - 0 0 - - 0 - - - 0 2 - - 0 - - - 0 0 - - 0 - - - 0 0 - - 0 - - - 0 0 - - 0 - - - 0 0 - - 1 $399,900 $399,900 $399,900 0 0 100% 87 1 $399,900 $399,900 $399,900 0 0 100% 87 0 - - - 0 0 - - 0 - - - 0 0 - - 0 - - - 0 0 - - 0 - - - 0 0 - - 0 - - - 0 0 - - 0 - - - 0 0 - - 0 - - - 0 0 - - 0 - - - 0 0 - - 0 - - - 0 0 - - 1 $467,000 $467,000 $467,000 6 12 97% 38 0 - - - 0 0 - - 0 - - - 0 0 - - 0 - - - 0 0 - - 0 - - - 0 0 - - 1 $467,000 $467,000 $467,000 6 12 97% 38 1 1 1 1 2 3 4 5
- 22. Toronto Real Estate Board Market Watch, January 2019 SUMMARY OF EXISTING HOME TRANSACTIONS DETACHED CONDOMINIUM, JANUARY 2019 CITY OF TORONTO MUNICIPAL BREAKDOWN 22 Sales Dollar Volume Average Price Median Price New Listings Active Listings Avg. SP / LP Avg. DOM TREB Total City of Toronto Total Toronto West Toronto W01 Toronto W02 Toronto W03 Toronto W04 Toronto W05 Toronto W06 Toronto W07 Toronto W08 Toronto W09 Toronto W10 Toronto Central Toronto C01 Toronto C02 Toronto C03 Toronto C04 Toronto C06 Toronto C07 Toronto C08 Toronto C09 Toronto C10 Toronto C11 Toronto C12 Toronto C13 Toronto C14 Toronto C15 Toronto East Toronto E01 Toronto E02 Toronto E03 Toronto E04 Toronto E05 Toronto E06 Toronto E07 Toronto E08 Toronto E09 Toronto E10 Toronto E11 2 $866,900 $433,450 $433,450 12 24 99% 63 0 - - - 0 1 - - 0 - - - 0 0 - - 0 - - - 0 0 - - 0 - - - 0 0 - - 0 - - - 0 0 - - 0 - - - 0 0 - - 0 - - - 0 0 - - 0 - - - 0 0 - - 0 - - - 0 0 - - 0 - - - 0 0 - - 0 - - - 0 0 - - 0 - - - 0 0 - - 0 - - - 0 0 - - 0 - - - 0 0 - - 0 - - - 0 0 - - 0 - - - 0 0 - - 0 - - - 0 0 - - 0 - - - 0 0 - - 0 - - - 0 0 - - 0 - - - 0 0 - - 0 - - - 0 0 - - 0 - - - 0 0 - - 0 - - - 0 0 - - 0 - - - 0 0 - - 0 - - - 0 0 - - 0 - - - 0 0 - - 0 - - - 0 0 - - 0 - - - 0 1 - - 0 - - - 0 0 - - 0 - - - 0 0 - - 0 - - - 0 0 - - 0 - - - 0 0 - - 0 - - - 0 0 - - 0 - - - 0 0 - - 0 - - - 0 0 - - 0 - - - 0 1 - - 0 - - - 0 0 - - 0 - - - 0 0 - - 0 - - - 0 0 - - 1 1 1 1 2 3 4 5
- 23. Toronto Real Estate Board Market Watch, January 2019 SUMMARY OF EXISTING HOME TRANSACTIONS CO-OWNERSHIP APARTMENT, JANUARY 2019 ALL TREB AREAS 23 Sales Dollar Volume Average Price Median Price New Listings Active Listings Avg. SP / LP Avg. DOM TREB Total Halton Region Burlington Halton Hills Milton Oakville Peel Region Brampton Caledon Mississauga City of Toronto Toronto West Toronto Central Toronto East York Region Aurora E. Gwillimbury Georgina King Markham Newmarket Richmond Hill Vaughan Whitchurch-Stouffville Durham Region Ajax Brock Clarington Oshawa Pickering Scugog Uxbridge Whitby Dufferin County Orangeville Simcoe County Adjala-Tosorontio Bradford West GwillimburyEssa Innisfil New Tecumseth 2 $938,000 $469,000 $469,000 4 7 94% 69 0 - - - 0 0 - - 0 - - - 0 0 - - 0 - - - 0 0 - - 0 - - - 0 0 - - 0 - - - 0 0 - - 0 - - - 0 1 - - 0 - - - 0 0 - - 0 - - - 0 0 - - 0 - - - 0 1 - - 2 $938,000 $469,000 $469,000 4 6 94% 69 1 $331,000 $331,000 $331,000 1 1 95% 97 1 $607,000 $607,000 $607,000 3 5 93% 40 0 - - - 0 0 - - 0 - - - 0 0 - - 0 - - - 0 0 - - 0 - - - 0 0 - - 0 - - - 0 0 - - 0 - - - 0 0 - - 0 - - - 0 0 - - 0 - - - 0 0 - - 0 - - - 0 0 - - 0 - - - 0 0 - - 0 - - - 0 0 - - 0 - - - 0 0 - - 0 - - - 0 0 - - 0 - - - 0 0 - - 0 - - - 0 0 - - 0 - - - 0 0 - - 0 - - - 0 0 - - 0 - - - 0 0 - - 0 - - - 0 0 - - 0 - - - 0 0 - - 0 - - - 0 0 - - 0 - - - 0 0 - - 0 - - - 0 0 - - 0 - - - 0 0 - - 0 - - - 0 0 - - 0 - - - 0 0 - - 0 - - - 0 0 - - 0 - - - 0 0 - - 1 1 1 1 2 3 4 5
- 24. Toronto Real Estate Board Market Watch, January 2019 SUMMARY OF EXISTING HOME TRANSACTIONS CO-OWNERSHIP APARTMENT, JANUARY 2019 CITY OF TORONTO MUNICIPAL BREAKDOWN 24 Sales Dollar Volume Average Price Median Price New Listings Active Listings Avg. SP / LP Avg. DOM TREB Total City of Toronto Total Toronto West Toronto W01 Toronto W02 Toronto W03 Toronto W04 Toronto W05 Toronto W06 Toronto W07 Toronto W08 Toronto W09 Toronto W10 Toronto Central Toronto C01 Toronto C02 Toronto C03 Toronto C04 Toronto C06 Toronto C07 Toronto C08 Toronto C09 Toronto C10 Toronto C11 Toronto C12 Toronto C13 Toronto C14 Toronto C15 Toronto East Toronto E01 Toronto E02 Toronto E03 Toronto E04 Toronto E05 Toronto E06 Toronto E07 Toronto E08 Toronto E09 Toronto E10 Toronto E11 2 $938,000 $469,000 $469,000 4 7 94% 69 2 $938,000 $469,000 $469,000 4 6 94% 69 1 $331,000 $331,000 $331,000 1 1 95% 97 0 - - - 0 0 - - 0 - - - 0 0 - - 0 - - - 0 0 - - 0 - - - 0 0 - - 0 - - - 0 0 - - 0 - - - 1 1 - - 0 - - - 0 0 - - 1 $331,000 $331,000 $331,000 0 0 95% 97 0 - - - 0 0 - - 0 - - - 0 0 - - 1 $607,000 $607,000 $607,000 3 5 93% 40 1 $607,000 $607,000 $607,000 0 0 93% 40 0 - - - 0 1 - - 0 - - - 1 1 - - 0 - - - 1 2 - - 0 - - - 0 0 - - 0 - - - 0 0 - - 0 - - - 1 1 - - 0 - - - 0 0 - - 0 - - - 0 0 - - 0 - - - 0 0 - - 0 - - - 0 0 - - 0 - - - 0 0 - - 0 - - - 0 0 - - 0 - - - 0 0 - - 0 - - - 0 0 - - 0 - - - 0 0 - - 0 - - - 0 0 - - 0 - - - 0 0 - - 0 - - - 0 0 - - 0 - - - 0 0 - - 0 - - - 0 0 - - 0 - - - 0 0 - - 0 - - - 0 0 - - 0 - - - 0 0 - - 0 - - - 0 0 - - 0 - - - 0 0 - - 1 1 1 1 2 3 4 5
- 25. Toronto Real Estate Board Market Watch, January 2019 FOCUS ON THE MLS HOME PRICE INDEX INDEX AND BENCHMARK PRICE, JANUARY 2019 ALL TREB AREAS 25 Composite Single-Family Detached Single-Family Attached Townhouse Apartment Index Benchmark Yr./Yr. % Chg. Index Benchmark Yr./Yr. % Chg. Index Benchmark Yr./Yr. % Chg. Index Benchmark Yr./Yr. % Chg. Index Benchmark Yr./Yr. % Chg. TREB Total Halton Region Burlington Halton Hills Milton Oakville Peel Region Brampton Caledon Mississauga City of Toronto York Region Aurora East Gwillimbury Georgina King Markham Newmarket Richmond Hill Vaughan Whitchurch-Stouffville Durham Region Ajax Brock Clarington Oshawa Pickering Scugog Uxbridge Whitby Dufferin County Orangeville Simcoe County Adjala-Tosorontio Bradford West GwillimburyEssa Innisfil New Tecumseth 251.1 $761,800 2.70% 244.8 $903,800 -0.04% 253.5 $712,700 2.26% 257.7 $568,900 3.49% 254.0 $506,900 8.04% 258.2 $832,600 2.30% 256.9 $947,600 3.09% 269.2 $688,700 4.91% 281.5 $519,200 0.32% 232.1 $429,200 -4.76% 258.7 $702,800 1.57% 255.6 $865,300 2.12% 278.4 $667,900 4.11% 289.7 $532,400 0.66% 232.7 $383,000 -4.08% 250.9 $742,600 4.80% 250.1 $813,700 4.69% 257.7 $583,900 6.40% 265.4 $426,500 5.69% 221.8 $448,500 -4.27% 254.6 $754,700 6.93% 252.3 $902,900 8.10% 264.6 $639,500 7.74% 250.1 $414,100 -2.15% 230.6 $469,700 -4.32% 260.9 $954,400 0.66% 261.4 $1,105,000 1.83% 270.3 $754,700 2.54% 275.5 $596,100 -1.64% 232.2 $446,000 -5.72% 245.3 $695,500 4.74% 239.4 $845,300 2.44% 246.3 $630,500 4.36% 241.9 $519,400 2.94% 252.6 $433,100 13.07% 247.4 $627,300 5.10% 241.7 $705,900 5.00% 249.5 $585,200 5.85% 243.4 $445,000 2.79% 240.4 $358,800 10.22% 213.5 $784,000 2.01% 213.3 $810,800 1.77% 245.0 $605,200 5.15% - - - 224.0 $544,600 -4.07% 246.2 $728,900 4.63% 241.3 $963,800 -0.58% 241.5 $666,000 2.11% 241.4 $542,600 3.03% 254.7 $447,400 13.60% 259.1 $840,100 5.76% 248.2 $1,089,100 0.77% 263.2 $877,400 4.20% 265.5 $632,000 5.82% 261.9 $537,900 9.08% 246.3 $831,000 -3.60% 248.6 $946,000 -5.04% 248.5 $719,000 -3.76% 235.0 $603,500 -1.22% 220.5 $483,600 4.40% 247.0 $817,400 -3.82% 245.5 $927,400 -5.07% 247.1 $637,300 -4.19% 233.9 $640,100 -2.99% 245.4 $513,000 5.68% 217.0 $741,500 -6.51% 220.7 $786,600 -6.09% 226.1 $472,900 -8.01% - - - - - - 224.9 $428,500 -3.60% 230.5 $434,600 -3.64% 228.9 $451,300 -5.80% - - - - - - 222.0 $928,800 -2.55% 223.1 $928,100 -2.36% 221.4 $518,500 -4.03% - - - 218.2 $596,800 -3.02% 256.1 $886,300 -2.18% 272.5 $1,121,100 -4.32% 258.7 $773,700 -2.49% 227.3 $604,200 -1.56% 215.5 $515,800 7.70% 225.9 $665,700 -2.38% 226.2 $762,400 -2.96% 225.8 $531,800 -2.38% 225.6 $468,400 -2.51% 261.1 $439,800 5.37% 264.5 $949,500 -3.75% 280.1 $1,190,300 -4.57% 258.7 $786,200 -4.99% 237.9 $603,100 0.38% 225.1 $458,100 3.16% 237.7 $859,500 -4.54% 228.7 $950,700 -6.00% 245.3 $743,100 -3.99% 262.1 $712,700 0.31% 217.6 $502,100 1.21% 252.4 $869,800 -5.11% 249.2 $894,000 -6.81% 226.1 $621,000 -3.38% 209.2 $375,500 -1.04% 247.3 $549,500 3.08% 233.7 $545,800 0.39% 228.8 $594,600 -0.17% 240.7 $480,700 1.18% 247.2 $392,100 5.91% 225.7 $383,000 -2.84% 235.8 $580,200 0.30% 234.9 $630,100 -0.13% 240.2 $518,300 0.88% 229.0 $418,600 3.76% 215.8 $349,800 -0.51% 193.8 $352,500 1.15% 194.8 $355,500 1.09% - - - - - - - - - 234.3 $494,800 1.43% 226.8 $546,200 1.02% 233.0 $445,100 2.51% 282.1 $441,900 8.17% 207.9 $307,900 -1.38% 237.2 $452,400 0.76% 226.8 $484,000 -0.83% 252.6 $422,800 1.53% 274.6 $341,000 9.58% 219.2 $303,900 -1.48% 238.5 $639,100 -0.87% 234.3 $729,800 -1.06% 245.1 $572,000 0.49% 235.7 $420,900 3.33% 255.1 $475,900 -5.10% 210.9 $550,700 -5.30% 218.5 $566,000 -4.88% 204.8 $428,600 -5.05% - - - - - - 221.6 $677,300 -0.23% 220.4 $680,600 -0.32% 221.3 $543,000 0.96% - - - - - - 231.0 $601,200 0.79% 232.6 $669,000 1.17% 235.1 $517,900 0.94% 196.2 $357,200 -2.34% 211.6 $383,500 -3.20% 258.7 $593,000 2.62% 270.4 $616,200 2.85% 247.5 $463,800 1.52% - - - - - - 258.7 $593,000 2.62% 270.4 $616,200 2.85% 247.5 $463,800 1.52% - - - - - - 238.0 $521,400 -2.14% 234.4 $528,300 -2.17% 242.6 $449,700 -1.90% - - - - - - 214.4 $645,200 -2.94% 214.2 $646,100 -2.99% - - - - - - - - - 247.8 $603,900 -1.43% 231.6 $633,500 -2.53% 257.6 $535,400 0.19% - - - - - - 243.1 $471,200 -0.04% 242.7 $489,600 0.75% 243.3 $377,900 -3.26% - - - - - - 245.6 $473,600 -2.54% 246.8 $475,200 -2.30% 244.4 $373,700 -2.20% - - - - - - 212.8 $505,700 -3.40% 206.9 $524,800 -3.27% 221.1 $400,900 -2.56% - - - - - -
- 26. Toronto Real Estate Board Market Watch, January 2019 FOCUS ON THE MLS HOME PRICE INDEX INDEX AND BENCHMARK PRICE, JANUARY 2019 CITY OF TORONTO 26 Composite Single-Family Detached Single-Family Attached Townhouse Apartment Index Benchmark Yr./Yr. % Chg. Index Benchmark Yr./Yr. % Chg. Index Benchmark Yr./Yr. % Chg. Index Benchmark Yr./Yr. % Chg. Index Benchmark Yr./Yr. % Chg. TREB Total City of Toronto Toronto W01 Toronto W02 Toronto W03 Toronto W04 Toronto W05 Toronto W06 Toronto W07 Toronto W08 Toronto W09 Toronto W10 Toronto C01 Toronto C02 Toronto C03 Toronto C04 Toronto C06 Toronto C07 Toronto C08 Toronto C09 Toronto C10 Toronto C11 Toronto C12 Toronto C13 Toronto C14 Toronto C15 Toronto E01 Toronto E02 Toronto E03 Toronto E04 Toronto E05 Toronto E06 Toronto E07 Toronto E08 Toronto E09 Toronto E10 Toronto E11 251.1 $761,800 2.70% 244.8 $903,800 -0.04% 253.5 $712,700 2.26% 257.7 $568,900 3.49% 254.0 $506,900 8.04% 259.1 $840,100 5.76% 248.2 $1,089,100 0.77% 263.2 $877,400 4.20% 265.5 $632,000 5.82% 261.9 $537,900 9.08% 247.9 $999,100 10.32% 237.5 $1,239,300 5.98% 253.6 $977,900 4.71% 252.6 $534,600 6.18% 249.6 $564,300 13.76% 280.3 $997,500 7.39% 269.4 $1,139,600 8.24% 310.4 $951,400 4.48% 269.5 $635,000 7.37% 271.7 $583,200 11.54% 282.9 $728,100 7.04% 284.8 $774,200 6.35% 278.7 $713,800 7.73% 264.6 $539,700 5.59% 273.4 $467,100 9.84% 255.8 $654,900 6.94% 253.5 $798,400 4.67% 243.8 $705,000 6.84% 225.8 $533,600 3.91% 264.6 $387,600 11.41% 241.8 $573,900 6.33% 246.1 $816,200 4.63% 225.4 $658,100 4.64% 241.6 $438,700 8.39% 254.6 $334,500 7.56% 209.3 $613,000 6.46% 262.9 $839,400 2.18% 209.1 $633,600 0.34% 295.3 $878,200 13.75% 180.3 $456,800 9.27% 225.7 $967,500 3.53% 239.6 $1,038,500 3.36% 206.5 $846,700 1.42% - - - 149.3 $605,400 7.26% 216.7 $864,000 7.17% 205.4 $1,073,700 1.58% 198.0 $733,500 -0.70% 252.2 $606,600 19.19% 223.7 $465,800 10.85% 236.8 $596,100 7.39% 222.4 $829,400 2.73% 195.9 $563,300 0.51% 268.4 $698,300 7.27% 250.0 $320,600 13.90% 240.1 $553,000 4.35% 239.4 $718,200 2.35% 248.0 $634,700 3.85% 221.7 $472,100 6.13% 244.3 $339,300 5.90% 291.2 $719,500 9.76% 294.9 $1,116,800 7.79% 280.7 $982,600 6.37% 277.4 $791,400 6.53% 291.7 $607,300 10.24% 258.1 $1,236,900 4.75% 227.4 $1,816,900 3.32% 262.2 $1,375,100 5.81% 264.4 $1,180,700 2.16% 258.8 $737,300 5.20% 287.3 $1,500,600 3.01% 265.5 $1,631,700 2.47% 284.2 $1,053,900 4.10% - - - 322.1 $842,600 1.93% 243.9 $1,505,200 -0.81% 246.7 $1,738,100 -0.56% 242.9 $1,137,200 -5.34% 0.0 $0 -100.00% 229.4 $530,600 0.53% 269.3 $1,048,700 0.45% 248.9 $1,063,100 -5.18% 211.0 $780,600 1.01% 242.7 $650,900 3.90% 290.6 $642,700 4.83% 252.1 $872,200 1.82% 278.3 $1,273,100 -4.27% 200.8 $718,500 -3.51% 239.6 $675,300 3.45% 241.4 $589,500 7.48% 269.0 $703,400 8.77% 286.3 $1,670,400 16.00% 285.6 $1,362,400 16.95% 296.5 $766,800 14.92% 266.8 $576,700 8.02% 182.0 $1,288,300 9.97% 132.6 $1,665,700 1.77% 145.5 $1,184,000 0.34% 285.4 $1,563,100 7.94% 207.9 $688,800 11.59% 274.9 $1,073,200 9.87% 258.8 $1,597,800 2.09% 245.0 $1,210,300 -0.04% 263.6 $769,400 5.23% 285.1 $680,800 13.72% 262.6 $929,200 8.24% 200.6 $1,366,500 1.26% 232.3 $1,028,600 5.59% 225.0 $389,800 2.32% 309.8 $449,800 11.20% 215.7 $1,840,300 -0.55% 197.9 $2,121,000 -1.15% 248.3 $1,039,300 -6.86% 202.3 $809,400 -7.29% 272.2 $853,400 4.69% 241.0 $872,600 0.75% 241.7 $1,289,000 -4.73% 221.3 $706,100 -1.99% 237.1 $685,400 -4.09% 240.2 $483,700 6.33% 264.3 $864,200 5.47% 266.6 $1,442,300 -7.40% 215.8 $1,050,800 -4.34% 317.3 $854,500 4.93% 259.1 $652,500 10.44% 240.8 $781,500 -1.75% 273.2 $1,282,800 -9.30% 222.9 $724,700 -10.48% 282.2 $675,500 3.29% 222.9 $518,300 4.21% 335.1 $1,046,500 10.23% 323.5 $1,141,500 8.74% 334.1 $1,053,900 9.72% 406.4 $743,300 12.14% 320.3 $759,800 11.29% 279.4 $1,046,300 3.44% 240.4 $1,095,300 2.52% 292.2 $978,500 3.43% 334.0 $962,000 9.72% 257.5 $704,000 2.55% 261.9 $805,700 7.34% 268.1 $903,900 5.51% 251.8 $824,600 9.38% - - - 246.9 $360,700 13.52% 259.2 $640,200 3.64% 235.5 $694,300 -2.77% 243.1 $585,800 -3.42% 246.6 $534,600 5.70% 309.6 $475,000 13.74% 240.3 $630,500 0.21% 240.6 $847,300 -3.68% 232.8 $641,500 -2.92% 249.8 $543,200 1.01% 236.5 $464,500 5.06% 260.5 $726,500 3.87% 262.1 $748,600 3.76% 264.2 $628,400 4.18% 0.0 $0 -100.00% 248.3 $525,100 5.75% 260.4 $638,300 3.66% 265.6 $870,600 0.72% 255.1 $667,100 0.55% 262.4 $568,500 3.80% 258.0 $441,800 6.79% 265.9 $641,700 6.66% 251.1 $782,700 3.04% 225.4 $584,300 3.25% 261.1 $532,900 6.66% 294.8 $470,300 12.56% 250.6 $599,200 4.68% 243.1 $690,200 1.38% 229.1 $560,400 -0.35% 277.2 $515,100 3.86% 255.3 $478,900 8.18% 254.0 $711,900 0.40% 240.8 $771,600 -1.79% 235.3 $610,100 -0.42% 300.7 $525,000 2.04% 267.3 $430,900 15.17% 260.8 $570,400 3.25% 258.1 $717,900 -0.15% 251.7 $570,100 0.72% 206.0 $404,300 2.95% 315.1 $470,300 10.17%
- 27. Toronto Real Estate Board Market Watch, January 2019 HISTORIC ANNUAL STATISTICS 27 Year Sales Average Price 2007 2008 2009 2010 2011 2012 2013 2014 2015 2016 2017 93,193 $376,236 74,552 $379,347 87,308 $395,460 85,545 $431,276 89,096 $465,014 85,496 $497,130 87,049 $522,958 92,782 $566,624 101,213 $622,121 113,040 $729,837 92,264 $822,587 2018 MONTHLY STATISTICS NOTES 1 - Sales, dollar volume, average sale prices and median sale prices are based on firm transactions entered into the TREB MLS® system between the first and last day of the month/period being reported. 2 - New listings entered into the TREB MLS® system between the first and last day of the month/period being reported. 3 - Active listings at the end of the last day of the month/period being reported. 4 - Ratio of the average selling price to the average listing price for firm transactions entered into the TREB MLS® system between the first and last day of the month/period being reported. 5 - Average number of days on the market for firm transactions entered into the TREB MLS® system between the first and last day of the month/period being reported. 6 - Due to past changes to TREB's service area, caution should be exercised when making historical comparisons. 7 - Past monthly and year-to-date figures are revised on a monthly basis. 8 - SNLR = Sales-to-New Listings Ratio. Calculated using a 12-month moving average (sales/new listings). 9 - Mos. Inv. = Months of Inventory. Calculated using a 12-month moving average (active listings/sales). 2019 MONTHLY STATISTICS *For historic annual sales and average price data over a longer time frame go to: January February March April May June July August September October November December Year to Date 4,009 $748,328 - - - - - - - - - - - - - - - - - - - - - - 4,009 $748,328 January February March April May June July August September October November December Annual 3,987 $735,874 5,149 $767,799 7,188 $784,514 7,744 $804,926 7,716 $803,440 8,024 $808,066 6,917 $781,939 6,799 $765,356 6,417 $796,748 7,452 $807,951 6,217 $788,306 3,765 $748,840 77,375 $787,195 1,6,7 1,7 1,7 http://www.torontorealestateboard.com/market_news/market_watch/historic_stats/p df/TREB_historic_statistics.pdf Copyright® 2019 Toronto Real Estate Board $748,3284,009