Energy efficiency in data processing centres
•
0 gefällt mir•576 views

A real example on content marketing I did about Energy efficiency in data processing centres for a company I worked with.

Empfohlen
Empfohlen
Weitere ähnliche Inhalte
Was ist angesagt?
Was ist angesagt? (19)
Andere mochten auch
Andere mochten auch (8)
Ähnlich wie Energy efficiency in data processing centres
Ähnlich wie Energy efficiency in data processing centres (20)
Mehr von Francisco Dominguez
Mehr von Francisco Dominguez (9)
Kürzlich hochgeladen
Kürzlich hochgeladen (20)
Energy efficiency in data processing centres
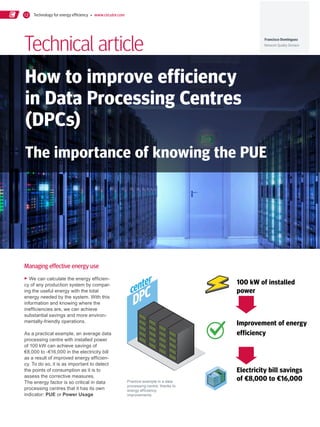
- 1. Technology for energy efficiency www.circutor.com12 How to improve efficiency in Data Processing Centres (DPCs) Technical article The importance of knowing the PUE ▸ We can calculate the energy efficien- cy of any production system by compar- ing the useful energy with the total energy needed by the system. With this information and knowing where the inefficiencies are, we can achieve substantial savings and more environ- mentally-friendly operations. As a practical example, an average data processing centre with installed power of 100 kW can achieve savings of €8,000 to -€16,000 in the electricity bill as a result of improved energy efficien- cy. To do so, it is as important to detect the points of consumption as it is to assess the corrective measures. The energy factor is so critical in data processing centres that it has its own indicator: PUE or Power Usage 100 kW of installed power Improvement of energy efficiency Electricity bill savings of €8,000 to €16,000 Managing effective energy use Practice example in a data processing centre, thanks to energy efficiency improvements Francisco Domínguez Network Quality Division DPCcenter
- 2. Circutor Magazine 2014-02 13 Effectiveness, defined by a standard issued by The Green Grid, a global environmental agency comprised of over 175 internationally renowned companies. The European Commission also has a code of conduct for reducing the impact of data centres' growing energy consumption. It periodically publishes best practices for data processing centres, most recently in 2013. These centres have a peculiar profile due to their uninterrupted working hours. Because of the great importance of service continuity when powering servers, computers and communica- tions, they have three main groups of units for their exclusive use: yy Energy supply and control units (electricity and other sources, such as diesel oil, gas, etc.) essential for the functioning of these continuous operation units. This group includes supply connections and switch- boards, lighting and refrigeration systems, air conditioning of the corresponding rooms, etc. yy One or several units to supply power computer equipment (IT), comprised of UPS (Uninterruptible Power Supply) units yy The distribution panels and systems for this energy to power the computer equipment Broadly speaking, we can say that of the 100% total energy consumed in a DPC, 60% corresponds to the infra- structure's electrical consumption and the remaining 40% to refrigeration systems. So we can undoubtedly see the need for coefficients (PUE) that make it possible to prepare comparative studies aimed at determining actions for optimising the energy consumption of these centres. The European Commission also has a code of conduct for reducing the impact of data centres' growing energy consumption. PUE or Power Usage Effectiveness, defined by a standard issued by The Green Grid, a global environmental agency comprised of over 175 internationally renowned companies. Calculation guidelines As we have already seen, we normally use the standard issued by The Green Grid to calculate the parameters for DPC efficiency. We will distinguish two key indicators: 1. PUE: Power Usage Effectiveness, calculated with the formula: 2. DCE: Data Centre Efficiency, calculated as a percentage with the formula: In addition, the Environmental Protec- tion Agency of the United States (EPA) provides the following PUE values as a reference: • Historic 2.0 • Current trend 1.9 • Optimised operations 1.7 • Best practices 1.3 • State-of-the-art 1.2 PUE = Total energy supplied Energy for computer equipment DCE = Energy for computer equipment Total energy supplied as a %
- 3. Technology for energy efficiency www.circutor.com14 Total energy supplied to the installation Electrical energy supplied to: • Panels • UPS • Batteries • Lighting • Air conditioning • Refrigeration systems • Ventilation Energy for com- puter equipment • Servers • Terminals • Data processing • Telecommunications • etc. DATA PROCESSING CENTRE (DPC) 100 % 50 % 50 % Companies like Google have gotten the average PUE of their DPCs down to 1.22, and sometimes as low as 1.15. In the historic frame of reference (PUE 2.0), typical consumption for different DPC elements is: There are three general measurement levels* shown in the table below, with measuring points that correspond to the indicators in the diagram also shown below, with energy measured in kWh. A 12-month cycle is taken as a comparative reference for all levels. There is also a Level 0, which only includes power measurements (kW), measuring the general demand of the installation and that of the UPS output. Therefore, one of the keys to the success of an energy improvement project is measuring the consump- tion of each unit type in order to be able to recognise the most afford- able areas of improvement. Lighting 4% Other 4% UPS 8% Air conditioning 34% Computer equipment 50% Breakdown Energy consump- tion in DPCs BASIC Level 1 (L1) INTERMEDIATE Level 2 (L2) ADVANCED Level 3 (L3) Total Energy of the Installation Installation Inputs Installation Inputs Installation Inputs Energy for computer equipment For UPS output For computer equipment distribution outputs For Computer equipment power supply Measurement Frequency Monthly / Weekly Daily / Hourly Continuous (15 minutes or less) *The Green Grid recommendations. 1 2 1 3 1 4 Consumption data INITIAL DPCcenter
- 4. Circutor Magazine 2014-02 15 PUE Efficiency Calculation Scale 4 CVM-MINI Earth leakage current relay station –– Servers –– Consoles –– Backup Units –– IT racks –– Telecommunications –– Routers, etc. Computer equipment output panel Electric power analyzer CVM-C10 Electric power analyzer CVM-MINI CBS-4 Electric power analyzer Earth leakage cur- rent relay station Distribution panel for DPC auxiliary servicesUPS power supply panel Computer equipment consumption Other related consumption –– Room Air Conditioning –– Lighting –– Unit cooling –– Auxiliary power connections –– Various services –– Etc. CVM-B150 CVM-C10 –– PowerStudio Software Electric power analyzer Electric power analyzer 70% 30%PUE FINAL CONSUMPTION 1.4 50% 50%PUE INITIAL CONSUMPTION 2 1 2 3 3 4 Data INITIAL and FINAL COMPARISON START: FINAL2 VERY INEFFICIENT VERY EFFICIENT 1.4
- 5. Technology for energy efficiency www.circutor.com16 CIRCUTOR with its decades of experience in energy efficiency , solutions, offers a wide range of products that facilitate continuous data gathering for controlling PUE and DCE, UPS unit performance, electric energy management and DPC maintenance. These include energy meters, power analyzers, ultra-immu- nised earth leakage protection, harmonic filtering systems, PowerStudio Scada management software and power factor correction systems. CIRCUTOR's Solution with the SCADA system For the study, two implementation phases and a third study phase are required: 1-Measurement: with the addition of CVM power analyzer units, with their correspond- ing current transformers, equipped with RS485 serial communications to measure circulating energy. 2-Analysis: installing the PowerStudio Scada application, calculating and viewing the resulting values and running the corresponding reports. 3-Improvements: analysing the collected data lets us see which units are consuming. These are some of the products offered by CIRCUTOR to facilitate continuous data gathering for controlling PUE and DCE, UPS unit performance, electric energy management and DPC maintenance, in addition to many other applications MEASUREMENT ANALYSIS IMPROVEMENTS CVM power analyzer units with measuring transformers 1. 2. CIRCUTOR's PowerStudio Scada software is used for calculating and viewing the values 3. Analysing the data gathered and controlling unit consumption ENERGY EFFICIENCY
- 6. Circutor Magazine 2014-02 17 The application features: • A start screen in single-line diagram format (Fig.1) with data corresponding to all the concurrent energy types (converted to KWh). • A second summary screen (Fig.2) with performance calculations (Fig.3), enabling you to create and display reports with results for different periods (daily, weekly, monthly and yearly). By way of example, here are the screens displayed when installing CVM analyz- ers and programming a specific Scada application. On the first one you can see the installation diagram and unit connec- tions; on the second one you can see the resulting data online for a single DPC; and on the third one is a weekly Level 1 report with continuous measur- ing frequency. PowerStudio SCADA application PUE calculation screen *Note: the data on the screens may vary depending on the moment when the data was captured WEEKLY PUE CALCULATION REPORT Level: L1 Measurement Period: Weekly Measurement Frequency: Continuous Period of the report: From: 03/01/2014 To: 10/01/2014 Issue Date: 13/01/2014 Description initial kWh final kWh total kWh Air- conditioning 6,146 8,767 2,621 Lighting 15 341 325 Input UPS 1 429 5,578 5,149 Input UPS 2 521 5,715 5,194 Total kWh in DPC inputs 13,289 Description initial kWh final kWh total kWh Output UPS 1 754 5,466 4,712 Output UPS 2 791 5,486 4,695 Total kWh in DPC outputs 9,407 PUE CALCULATION Total kWh DPC outputs / Total kWh DPC inputs 1.41 PUE L1, W, C 0.71 DCE Fig. 1 Fig .2 Fig .3
- 7. CIRCUTOR's Solution with a local display screen For the study, two implementation phases are required: 1-Addition of CVM power analyzer units with their corresponding current transformers, equipped with RS485 serial communications to measure circulating energy. 2- Addition of an EDS energy control- ler with storage and data processing functions and its built-in programming, along with a local display screen. By way of example, here is the commu- nication topology displayed when installing CVM analyzers, the EDS energy controller and the local display screen. CIRCUTOR EDS Energy manager with PowerStudio and built-in web server CVM NET RS-485 General Air conditioning UPS Input Lighting UPS Output Local screen CVM NET CVM NET CVM 1D CVM NET PowerStudio EDS CIRCUTOR's Solution with a local screen How to improve the efficiency of a data processing centre To improve the efficiency of a data processing centre, we must follow measuring and analysis by implement- ing improvement actions. There are actions that do not require any invest- ment, such as reducing the contracted power to save on direct costs, and other actions that do require investment, such as replacing units with more efficient ones. To organise these improvement actions you can prioritise them in accordance with the efficiency that can be achieved with each one. This prioritisation is calculated by comparing the improve- ment obtained with the investment required to make the improvement. Pa= CEa-CEm Investment Pa: Action priority CEa: Current energy consumption CEm: Energy consumption with the new measure. Investment: investment needed to achieve the savings Technology for energy efficiency www.circutor.com18
- 8. Technical Article 19 Performing this calculation for each possible improvement action helps us prepare a list of actions and sort them from highest to lowest priority. Possible short-term measures include: yy Analysing usage patterns for the environments where they have been deployed. Calculating the minimum server group sizes to maintain service levels. Switching off unused capacity, as long as proper availability is maintained. yy Virtualisation and consolidation yy Replacing hardware Virtualising test environments. Replacing obsolete hardware. yy Changes in room management Correct control and adjustment of room temperature. yy Changes to the refrigeration infrastructure. New efficient refrigeration machinery. Hot aisle/cold aisle layout. Elimination of gaps in the racks. Future: use of outside air. yy Lighting optimisation For a more thorough list of Data Centre improvements, see the 2013 Best Practices issued by the European Commission's Renewable Energies Unit. Conclusions DPCs (Data Processing Centres) are major consumers of electrical energy and their consumption can be divided in useful energy for computer equipment and the additional energy necessary for their smooth functioning. This energy consumption is so critical that it has its own indicator: PUE (Power Usage Effectiveness). In DPCs with non-optimised PUEs, this additional energy can account for up to 50% of the total energy, giving us good room for improvement. According to minimum availability requirements and the options for investment in improvements, savings of up to 20% of the total energy consumed can be achieved (or between €8,000- €16,000 a year in an average 100 kW DPC). As we have seen in this article, it is possible to study and measure possible improvements to data processing centres. The key phases are installing energy measuring units, analysing the data gathered and making decisions based on that analysis. CIRCUTOR, with its decades of experience in energy efficiency solutions, offers a wide range of products that facilitate continuous data gathering for control, mainte- nance and energy efficiency management of DPCs. For further information contact us on CIRCUTOR's website www.circutor.com or through one of our local sales representatives in your area.» CIRCUTOR, with its decades of experience in energy efficiency solutions, offers a wide range of products that facilitate continuous data gathering for control, maintenance and energy efficiency management of Data Processing Centres (DPCs)