SlideShare ist ein Scribd-Unternehmen logo
1 von 7
Downloaden Sie, um offline zu lesen
Bayer AG
Q3 2012 Analyst and Investor Briefing                                                              Investor Relations
                                                                                                   51368 Leverkusen
October 30, 2012                                                                                   Germany
                                                                                                   www.investor.bayer.com

   Bayer on track for a successful 2012
   Upward trend at HealthCare and CropScience continues
   Group sales €9.7 billion (Fx & portfolio adj. +5.5%)
   Price +0.6%, volume +4.9%, currency +6.5%, portfolio -0.5%
   EBIT €0.8 billion (-23.7%)
   Net special items totaled minus €356 million. Included here were €205 million in further accounting
    measures taken – mainly based on additional claims asserted but not filed in court – for all cases in
    connection with the oral contraceptive Yasmin/YAZ of which we are currently aware and which we
    consider to be worthy of settlement (venous clot injuries). Other special charges were restructuring
    expenses of €134 million and impairment losses of €68 million on intangible assets. Special gains of
    €53 million resulted from adjustments of entitlements to “other post-employment benefits” in the U.S.
   EBITDA before special items €1.8 billion (+2.2%)
   Additional allocations of about €110 million to our long-term stock-based incentive programs
   Positive currency effects of around €160 million overall
   Net income €0.5 billion (-17.8%)
   Further progress with innovation pipeline
   Group forecast for 2012 confirmed


Group Key Figures
 Euro million                              Q3 2011            Q3 2012     % y-o-y                   Consensus**
 Sales                                       8,670              9,665    11.5 / 5.5*                    9,312
 EBITDA                                      1,731              1,582          (8.6)                    1,745
 EBITDA before special items                 1,805              1,845            2.2                    1,845
 EBIT                                        1,099                838        (23.7)                     1,080
 Net special items                             (75)             (356)                                    (93)
 EBIT before special items                   1,174              1,194            1.7                    1,172
 Non-operating result                        (224)              (172)          23.2                     (197)
 Income taxes                                (229)              (132)          42.4                          
 Net income                                    642                528        (17.8)                       643
 EPS (Euro/share)                             0.78               0.64        (17.9)                      0.78
 Core EPS (Euro/share)                        1.12               1.20            7.1                     1.15
 Gross cash flow                             1,327              1,023        (22.9)                          
 Delta working capital                         250                966                                       
 Net cash flow                               1,577              1,989          26.1                          
 CapEx (cash relevant)                         354                486          37.3                          
 Operating free cash flow                    1,223              1,503          22.9                          

                                           June 30,          Sept. 30,
 Euro million
                                             2012             2012        *) Currency and portfolio adjusted sales
 Net financial debt                          7,911             6,805        growth
                                                                         **) Consensus figures as of October 17, 2012
 Net pension liability                       9,346             9,734        provided by Vara Research GmbH

Q3 2012 Analyst and Investor Briefing                                                                            Page 1
Bayer AG, Investor Relations, 51368 Leverkusen, www.investor.bayer.com
Bayer Group Forecast
    Based on the exchange rates prevailing at the end of the third quarter, we confirm the sales and earnings
     forecast for the full year 2012 that we raised in July.
    For the full year 2012, we continue to anticipate a currency- and portfolio-adjusted sales increase of
     between 4% and 5%. This would result in Group sales of between approximately €39 billion and €40 billion.
    As before, we plan to increase EBITDA before special items by a high-single-digit percentage. We
     continue to expect to raise core earnings per share by about 10%.
    In addition to the special charges already recognized, we anticipate further expenses of €0.2 billion for
     ongoing restructuring programs in the fourth quarter of 2012.

HealthCare
   HealthCare’s top priority remains to successfully commercialize the new pharmaceutical products.
   We continue to expect sales to increase by between 3% and 4% after adjusting for currency and portfolio
    effects. We plan to improve EBITDA before special items by a mid- to high-single-digit percentage to
    which high positive currency effects will contribute.
   We forecast sales of the Pharmaceuticals segment to move slightly higher on a currency- and portfolio-
    adjusted basis, with EBITDA before special items rising by a mid-single-digit percentage.
   In the Consumer Health segment, we anticipate that sales will grow by a mid-single-digit percentage
    on a currency- and portfolio-adjusted basis and that EBITDA before special items will increase by a high-
    single-digit percentage.

CropScience
   As before, we anticipate that sales will advance by approximately 10% on a currency- and portfolio-
    adjusted basis and that EBITDA before special items will improve by approximately 20%.
   We continue to predict above-market growth.

MaterialScience
   At MaterialScience, we anticipate a significant currency- and portfolio-adjusted sales gain and
    significantly higher EBITDA before special items in the fourth quarter of 2012 compared to the weak
    prior-year quarter.
   For the full year 2012, we now expect sales to show a small currency- and portfolio-adjusted increase
    (previously: to remain level with the prior year) and continue to expect EBITDA before special items to
    remain level with the prior year.


Further assumptions for 2012:
CapEx: approx. €1.5 billion for property, plant and equipment and €0.4 billion for intangible assets
Planned D&A: approx. €2.6 billion, including €1.3 billion amortization of intangibles
R&D: approx. €3.0 billion
Non-operating result: minus €0.7 billion to minus €0.8 billion
Income tax-rate: approx. 25%

The sales and earnings forecast for 2013 is given in Chapter 11.4 of the Annual Report 2011.


Q3 2012 Analyst and Investor Briefing                                                                  Page 2
Bayer AG, Investor Relations, 51368 Leverkusen, www.investor.bayer.com
HealthCare

 Euro million                              Q3 2011            Q3 2012           % y-o-y                Consensus**

 Sales                                       4,200             4,719            12.4 / 5.5*              4,543
    Pharmaceuticals                          2,420             2,734            13.0 / 6.1*                  
    Consumer Health                          1,780             1,985            11.5 / 4.7*                  
 EBITDA before special items                 1,226             1,297                    5.8              1,272
    Pharmaceuticals                            768               827                    7.7                  
    Consumer Health                            458               470                    2.6                  
2011 figures for Pharmaceuticals and Consumer Health restated
 *) Currency and portfolio adjusted sales growth
**) Consensus figures as of October 17, 2012 provided by Vara Research GmbH


Best Selling Pharmaceutical Products

 Euro million                                      Q3 2011               Q3 2012          % y-o-y      % y-o-y Fx

 Kogenate                                             257                 300                   16.7         8.9
    of which USA                                       70                  95                   35.7        20.3
 Betaferon / Betaseron                                289                 292                    1.0       (6.1)
    of which USA                                      126                 150                   19.0         4.8
 YAZ product family                                   275                 277                    0.7       (4.0)
    of which USA                                       48                  54                   12.5         2.7
 Nexavar                                              177                 199                   12.4         4.2
    of which USA                                       45                  55                   22.2         7.7
 Mirena                                               137                 183                   33.6        22.5
    of which USA                                       71                 113                   59.2        41.5
 Adalat                                               156                 171                    9.6       (0.3)
    of which USA                                        2                   0                                 
 Aspirin Cardio                                       102                 124                   21.6        13.0
    of which USA                                        0                   0                                 
 Glucobay                                              88                 122                   38.6        23.5
    of which USA                                        0                   0                                 
 Avalox / Avelox                                      103                 119                   15.5         6.8
    of which USA                                       16                  14                 (12.5)      (26.9)
 Xarelto                                               20                  81                                 
    of which USA                                        3                  14                                 
 Levitra                                               75                  75                    0.0       (1.9)
    of which USA                                       20                  19                  (5.0)       (6.0)
 Cipro / Ciprobay                                      53                  65                   22.6        17.3
    of which USA                                       -2                   3                                 
 Zetia                                                 45                  55                   22.2         8.1
    of which USA                                        0                   0                                 
 Diane                                                 47                  52                   10.6         9.9
    of which USA                                        0                   0                                 
 Fosrenol                                              31                  47                   51.6        36.5
    of which USA                                        0                   0                                 

%y-o-y Fx: Currency adjusted sales growth


Q3 2012 Analyst and Investor Briefing                                                                        Page 3
Bayer AG, Investor Relations, 51368 Leverkusen, www.investor.bayer.com
   Price +1.5%, volume +4.0%, currency +7.1%, portfolio -0.2%
   At Pharmaceuticals, growth was achieved mainly in North America and in the emerging markets, especially
    China.
   Kogenate developed positively, with growth driven by increased shipments to our distribution partner during
    this quarter and by higher volumes resulting from tender businesses in Australia.
   Global sales of Betaferon receded mainly due to a decline in Europe.
   YAZ product family was hampered by generic competition, especially in Western Europe. Sales gains in the
    Asia/Pacific and LatAm regions only partly compensated for this effect.
   Nexavar mainly driven by business in China and the U.S.
   Sales of Mirena increased mainly on higher volumes in the U.S.
   Glucobay, Aspirin Cardio and Avelox benefited from continued extension of our marketing activities in China.
   Xarelto with launches in further countries and indications. Strongest sales growth in Germany and the U.S.
   Sales of Cipro benefited from a government contract in the United Kingdom.
   Consumer Health mainly driven by Consumer Care and Animal Health. Consumer Care (€984 million,
    +5.1% Fx & portf. adj.), Medical Care (€661 million, +1.0% Fx & portf. adj.) and Animal Health (€340 million,
    +11.3% Fx & portf. adj.). Business developed especially well in the emerging markets and in North America.
   Increase in EBITDA before special items at HealthCare largely attributable to good business development
    in the Pharmaceuticals segment and positive currency effects.


CropScience

 Euro million                                  Q3 2011        Q3 2012              % y-o-y                 Consensus**

 Sales                                         1,379           1,641             19.0 / 12.8*                  1,534
      Crop Protection / Seeds                  1,265           1,511             19.4 / 13.1*                      
       Environmental Science                     114             130              14.0 / 8.8*                      
 EBITDA before special items                     165             189                     14.5                    201

 *) Currency and portfolio adjusted sales growth
**) Consensus figures as of October 17, 2012 provided by Vara Research GmbH

                                                                                                           LatAm/Africa/
                                           Europe             North America           Asia/Pacific
                                                                                                            Middle East
 Q3 2012
                                     Euro        % y-o-y     Euro        % y-o-y    Euro        % y-o-y   Euro     % y-o-y
                                     million       Fx        million       Fx       million       Fx      million    Fx
 CropScience                            414        18.2         279       16.5        325         2.3      623         10.8
   Crop Protection                      361        16.7         199       10.7        286         2.6      567         10.5
%y-o-y Fx: Currency adjusted sales growth

   Price +0.6%, volume +12.2%, currency +7.3%, portfolio -1.1%
   Sales development at CropScience maintained nearly the same momentum as in the preceding quarters.
   Business was supported by the positive market conditions, which in turn benefited from factors such as the
    persistently high prices for agricultural commodities.
   Crop Protection with sales of €1,414 million (+11.7% Fx & portf. adj.) developed positively in all product
    groups and regions. Herbicides at €360 million (+4.3% Fx & portf. adj.), fungicides at €361 million (+15.5%
    Fx & portf. adj.), insecticides at €376 million (+7.5% Fx & portf. adj.) and SeedGrowth (formerly Seed
    Treatment) at €317 million (+23.7% Fx & portf. adj.).


Q3 2012 Analyst and Investor Briefing                                                                                  Page 4
Bayer AG, Investor Relations, 51368 Leverkusen, www.investor.bayer.com
   Performance of Crop Protection in Europe mainly driven by strong SeedGrowth sales in Germany, France
    and the United Kingdom. Significant gains at herbicides. Fungicide and insecticide sales developed well.
   Crop Protection achieved strong growth in North America. Business developed particularly well in the U.S.,
    especially in SeedGrowth. The drought in the U.S. had no material effect on our business so far.
   The moderate sales growth of the Crop Protection business in Asia/Pacific was largely attributable to
    increases for herbicides and SeedGrowth products. Sales in China and Australia improved considerably,
    while business in Japan and Thailand was below the high level of the prior-year period.
   Crop Protection in LatAm/Africa/Middle East was mainly driven by increases in LatAm, especially Brazil,
    where the fungicides business developed especially well. Business with herbicides declined. In Argentina we
    saw a sharp rise in sales of insecticides. Overall positive performance in Africa and the Middle East.
   Sales of Seeds (formerly BioScience) climbed by a substantial 39.1% (Fx & portfolio adj.) to €97 million.
    Growth was driven by the business in North America, particularly with canola seed. Sales of Nunhems
    vegetable seeds were level with the previous year.
   At Environmental Science (€130 million, +8.8% Fx adj.) business with products for professional users
    expanded by a double-digit percentage. Sales of products for private customers remained level year on year.
   The increase in EBITDA before special items at CropScience was attributable above all to higher volumes
    and to favorable currency effects. The progress made with our efficiency improvement programs also had a
    positive impact on earnings. However, manufacturing and selling expenses increased.


MaterialScience

 Euro million                             Q3 2011        Q2 2012         Q3 2012      % y-o-y        Consensus**

 Sales                                        2,768         2,962          2,992       8.1 / 2.9*       2,916
   Polyurethanes                              1,352         1,528          1,572     16.3 / 10.2*           
   Polycarbonates                               749           728            720   (3.9) / (10.5)*          
   CAS                                          494           526            512       3.6 / 2.8*           
   Industrial Operations                        173           180            188       8.7 / 4.6*           
 EBITDA before special items                    348           385            333             (4.3)        354
CAS: Coatings, Adhesives, Specialties; Sales split for Q3’2011 and Q2’2012 restated
 *) Currency and portfolio adjusted sales growth
**) Consensus figures as of October 17, 2012 provided by Vara Research GmbH

   Price -0.4%, volume +3.3%, currency +5.9%, portfolio -0.7%
   Sales growth was due to higher volumes overall. Volumes were flat with the prior year in Europe, while there
    was a gratifying increase in the other regions. Selling price increases in the LatAm/Africa/Middle East,
    Europe and North America regions nearly offset declines in Asia/Pacific.
   Sales growth at Polyurethanes driven by higher volumes in all product groups and regions. We also
    achieved price increases in all regions except North America. Prices for TDI and MDI were up, while prices
    for polyether were below the prior-year period.
   Sales at Polycarbonates declined compared to the strong prior-year quarter. This was attributable to lower
    selling prices and volumes in both product groups.
   Sales of Coatings, Adhesives, Specialties increased due to higher volumes in all regions. Prices as a
    whole were somewhat below the prior-year period.
   EBITDA before special items at MaterialScience declined largely as the result of increases in raw material
    and energy costs and a slight drop in selling prices. These factors were only partly offset by volume growth,
    savings from efficiency improvement measures, and positive currency effects.
Q3 2012 Analyst and Investor Briefing                                                                           Page 5
Bayer AG, Investor Relations, 51368 Leverkusen, www.investor.bayer.com
Bayer Investor Relations contacts:

Dr. Alexander Rosar (+49-214-30-81013)
Dr. Jürgen Beunink (+49-214-30-65742)
Peter Dahlhoff (+49-214-30-33022)
Fabian Klingen (+49-214-30-35426)
Judith Nestmann (+49-214-30-66836)
Dr. Olaf Weber (+49-214-30-33567)


Forward-looking statements
This announcement may contain forward-looking statements based on current assumptions and forecasts made by Bayer
Group or subgroup management. Various known and unknown risks, uncertainties and other factors could lead to material
differences between the actual future results, financial situation, development or performance of the company and the
estimates given here. These factors include those discussed in Bayer’s public reports which are available on the Bayer
website at www.bayer.com. The company assumes no liability whatsoever to update these forward-looking statements or to
conform them to future events or developments.


Q3 2012 Analyst and Investor Briefing                                                                           Page 6
Bayer AG, Investor Relations, 51368 Leverkusen, www.investor.bayer.com
Key figures for Q3’2012


Q3 2012 Analyst and Investor Briefing                                    Page 7
Bayer AG, Investor Relations, 51368 Leverkusen, www.investor.bayer.com

Weitere ähnliche Inhalte

Was ist angesagt?

FY10 financial results
FY10 financial resultsFY10 financial results
FY10 financial resultsdarren_s
 
Interim report 2 2010, Media and analyst presentation, Nordea Bank
Interim report 2 2010, Media and analyst presentation, Nordea BankInterim report 2 2010, Media and analyst presentation, Nordea Bank
Interim report 2 2010, Media and analyst presentation, Nordea BankNordea Bank
 
Orchid chemical ru4 qfy2010-270510
Orchid chemical ru4 qfy2010-270510Orchid chemical ru4 qfy2010-270510
Orchid chemical ru4 qfy2010-270510Angel Broking
 
Sterlite Industries
Sterlite Industries  Sterlite Industries
Sterlite Industries Angel Broking
 
Santander Bank Activity and Results 2011
Santander Bank Activity and Results 2011Santander Bank Activity and Results 2011
Santander Bank Activity and Results 2011BANCO SANTANDER
 
XING AG half year report 2012
XING AG half year report 2012XING AG half year report 2012
XING AG half year report 2012XING SE
 
Dchl ru4 qfy2010-140510
Dchl ru4 qfy2010-140510Dchl ru4 qfy2010-140510
Dchl ru4 qfy2010-140510Angel Broking
 
Sail steel ru4 qfy2010-310510
Sail steel ru4 qfy2010-310510Sail steel ru4 qfy2010-310510
Sail steel ru4 qfy2010-310510Angel Broking
 
Request kindred healthcare-investor_presentation_february_2011[1]
Request kindred healthcare-investor_presentation_february_2011[1]Request kindred healthcare-investor_presentation_february_2011[1]
Request kindred healthcare-investor_presentation_february_2011[1]chelees81
 
Bajaj electricals ru4-qfy2010-280510
Bajaj electricals ru4-qfy2010-280510Bajaj electricals ru4-qfy2010-280510
Bajaj electricals ru4-qfy2010-280510Angel Broking
 

Was ist angesagt? (16)

Bhel 020212
Bhel 020212Bhel 020212
Bhel 020212
 
FY10 financial results
FY10 financial resultsFY10 financial results
FY10 financial results
 
Interim report 2 2010, Media and analyst presentation, Nordea Bank
Interim report 2 2010, Media and analyst presentation, Nordea BankInterim report 2 2010, Media and analyst presentation, Nordea Bank
Interim report 2 2010, Media and analyst presentation, Nordea Bank
 
Orchid chemical ru4 qfy2010-270510
Orchid chemical ru4 qfy2010-270510Orchid chemical ru4 qfy2010-270510
Orchid chemical ru4 qfy2010-270510
 
Sterlite Industries
Sterlite Industries  Sterlite Industries
Sterlite Industries
 
Santander Bank Activity and Results 2011
Santander Bank Activity and Results 2011Santander Bank Activity and Results 2011
Santander Bank Activity and Results 2011
 
XING AG half year report 2012
XING AG half year report 2012XING AG half year report 2012
XING AG half year report 2012
 
Dchl ru4 qfy2010-140510
Dchl ru4 qfy2010-140510Dchl ru4 qfy2010-140510
Dchl ru4 qfy2010-140510
 
Bosch
BoschBosch
Bosch
 
Bajaj Electricals
Bajaj ElectricalsBajaj Electricals
Bajaj Electricals
 
Larsen & Tourbo
Larsen & TourboLarsen & Tourbo
Larsen & Tourbo
 
Cipla ltd
Cipla ltdCipla ltd
Cipla ltd
 
Sail steel ru4 qfy2010-310510
Sail steel ru4 qfy2010-310510Sail steel ru4 qfy2010-310510
Sail steel ru4 qfy2010-310510
 
Request kindred healthcare-investor_presentation_february_2011[1]
Request kindred healthcare-investor_presentation_february_2011[1]Request kindred healthcare-investor_presentation_february_2011[1]
Request kindred healthcare-investor_presentation_february_2011[1]
 
RIL - result Update
RIL - result UpdateRIL - result Update
RIL - result Update
 
Bajaj electricals ru4-qfy2010-280510
Bajaj electricals ru4-qfy2010-280510Bajaj electricals ru4-qfy2010-280510
Bajaj electricals ru4-qfy2010-280510
 

Andere mochten auch (9)

Hecho Relevante Lleida.net
Hecho Relevante Lleida.netHecho Relevante Lleida.net
Hecho Relevante Lleida.net
 
Brexit 24062016 jp
Brexit 24062016 jpBrexit 24062016 jp
Brexit 24062016 jp
 
Licencia myo gem 03
Licencia myo gem 03Licencia myo gem 03
Licencia myo gem 03
 
Tesla
TeslaTesla
Tesla
 
Sistem pengankutan dalam manusia
Sistem pengankutan dalam manusiaSistem pengankutan dalam manusia
Sistem pengankutan dalam manusia
 
sistem peredaran darah
 sistem peredaran darah sistem peredaran darah
sistem peredaran darah
 
Nota cpr
Nota cprNota cpr
Nota cpr
 
Bab 2 peti_pertolongan_cemas
Bab 2 peti_pertolongan_cemasBab 2 peti_pertolongan_cemas
Bab 2 peti_pertolongan_cemas
 
Sistem peredaran darah
Sistem peredaran darahSistem peredaran darah
Sistem peredaran darah
 

Ähnlich wie Resultados bayer

Kemira financial statements bulletin 2012
Kemira financial statements bulletin 2012Kemira financial statements bulletin 2012
Kemira financial statements bulletin 2012Kemira Oyj
 
Wessanen q3 2012 press release
Wessanen q3 2012 press releaseWessanen q3 2012 press release
Wessanen q3 2012 press releaseKlaus Arntz
 
11Q3 Results for Deutsche Telekom
11Q3 Results for Deutsche Telekom11Q3 Results for Deutsche Telekom
11Q3 Results for Deutsche TelekomDeutsche Telekom
 
Stora Enso Interim Review Q2 2012
Stora Enso Interim Review Q2 2012Stora Enso Interim Review Q2 2012
Stora Enso Interim Review Q2 2012Stora Enso
 
Bayer is a global enterprise with core competencies in the fields of health care
Bayer is a global enterprise with core competencies in the fields of health careBayer is a global enterprise with core competencies in the fields of health care
Bayer is a global enterprise with core competencies in the fields of health careabhayjadaun
 
Vodaphone 2008 Half-Yearly Results
Vodaphone 2008 Half-Yearly ResultsVodaphone 2008 Half-Yearly Results
Vodaphone 2008 Half-Yearly Resultsearningsreport
 
Q4 2012 wessanen presentation
Q4 2012 wessanen presentationQ4 2012 wessanen presentation
Q4 2012 wessanen presentationKlaus Arntz
 
6M results 2013
6M results 20136M results 2013
6M results 2013Ageas
 
Pfizer Quarterly Corporate Performance - Fourth Quarter 2007
Pfizer Quarterly Corporate Performance - Fourth Quarter 2007Pfizer Quarterly Corporate Performance - Fourth Quarter 2007
Pfizer Quarterly Corporate Performance - Fourth Quarter 2007finance5
 
dover Release_3Q07_18442
dover Release_3Q07_18442dover Release_3Q07_18442
dover Release_3Q07_18442finance30
 
Activity and results 2012
Activity and results 2012Activity and results 2012
Activity and results 2012BANCO SANTANDER
 
Infosys 1 qfy2012ru-12072011
Infosys 1 qfy2012ru-12072011Infosys 1 qfy2012ru-12072011
Infosys 1 qfy2012ru-12072011aatulsb
 
Infosys Result Updated
Infosys Result UpdatedInfosys Result Updated
Infosys Result UpdatedAngel Broking
 
credit suisse Presentation slides, March 20, 2008
credit suisse Presentation slides, March 20, 2008 credit suisse Presentation slides, March 20, 2008
credit suisse Presentation slides, March 20, 2008 QuarterlyEarningsReports2
 
Exide 2 qfy2011ru-121010
Exide 2 qfy2011ru-121010Exide 2 qfy2011ru-121010
Exide 2 qfy2011ru-121010Angel Broking
 
Pfizer Quarterly Corporate Performance - First Quarter 2008
Pfizer Quarterly Corporate Performance - First Quarter 2008Pfizer Quarterly Corporate Performance - First Quarter 2008
Pfizer Quarterly Corporate Performance - First Quarter 2008finance5
 

Ähnlich wie Resultados bayer (20)

Kemira financial statements bulletin 2012
Kemira financial statements bulletin 2012Kemira financial statements bulletin 2012
Kemira financial statements bulletin 2012
 
Dt results q1_2012
Dt results q1_2012Dt results q1_2012
Dt results q1_2012
 
Wessanen q3 2012 press release
Wessanen q3 2012 press releaseWessanen q3 2012 press release
Wessanen q3 2012 press release
 
11Q3 Results for Deutsche Telekom
11Q3 Results for Deutsche Telekom11Q3 Results for Deutsche Telekom
11Q3 Results for Deutsche Telekom
 
Stora Enso Interim Review Q2 2012
Stora Enso Interim Review Q2 2012Stora Enso Interim Review Q2 2012
Stora Enso Interim Review Q2 2012
 
Bayer is a global enterprise with core competencies in the fields of health care
Bayer is a global enterprise with core competencies in the fields of health careBayer is a global enterprise with core competencies in the fields of health care
Bayer is a global enterprise with core competencies in the fields of health care
 
Vodaphone 2008 Half-Yearly Results
Vodaphone 2008 Half-Yearly ResultsVodaphone 2008 Half-Yearly Results
Vodaphone 2008 Half-Yearly Results
 
Q4 2012 wessanen presentation
Q4 2012 wessanen presentationQ4 2012 wessanen presentation
Q4 2012 wessanen presentation
 
Scarica il PDF
Scarica il PDFScarica il PDF
Scarica il PDF
 
Scarica pdf
Scarica pdfScarica pdf
Scarica pdf
 
6M results 2013
6M results 20136M results 2013
6M results 2013
 
Pfizer Quarterly Corporate Performance - Fourth Quarter 2007
Pfizer Quarterly Corporate Performance - Fourth Quarter 2007Pfizer Quarterly Corporate Performance - Fourth Quarter 2007
Pfizer Quarterly Corporate Performance - Fourth Quarter 2007
 
dover Release_3Q07_18442
dover Release_3Q07_18442dover Release_3Q07_18442
dover Release_3Q07_18442
 
Activity and results 2012
Activity and results 2012Activity and results 2012
Activity and results 2012
 
Infosys 1 qfy2012ru-12072011
Infosys 1 qfy2012ru-12072011Infosys 1 qfy2012ru-12072011
Infosys 1 qfy2012ru-12072011
 
Infosys Result Updated
Infosys Result UpdatedInfosys Result Updated
Infosys Result Updated
 
E72 f1fc5d01
E72 f1fc5d01E72 f1fc5d01
E72 f1fc5d01
 
credit suisse Presentation slides, March 20, 2008
credit suisse Presentation slides, March 20, 2008 credit suisse Presentation slides, March 20, 2008
credit suisse Presentation slides, March 20, 2008
 
Exide 2 qfy2011ru-121010
Exide 2 qfy2011ru-121010Exide 2 qfy2011ru-121010
Exide 2 qfy2011ru-121010
 
Pfizer Quarterly Corporate Performance - First Quarter 2008
Pfizer Quarterly Corporate Performance - First Quarter 2008Pfizer Quarterly Corporate Performance - First Quarter 2008
Pfizer Quarterly Corporate Performance - First Quarter 2008
 

Mehr von WEB FINANCIAL GROUP INTERNATIONAL SL

La actualidad del mercado. Estrategias de inversión con Javier Urones de XTB
La actualidad del mercado. Estrategias de inversión con Javier Urones de XTBLa actualidad del mercado. Estrategias de inversión con Javier Urones de XTB
La actualidad del mercado. Estrategias de inversión con Javier Urones de XTBWEB FINANCIAL GROUP INTERNATIONAL SL
 

Mehr von WEB FINANCIAL GROUP INTERNATIONAL SL (20)

Caser junio
Caser junioCaser junio
Caser junio
 
InKemia crea un nuevo fondo de 10 M€ para invertir en Spin-Off
InKemia crea un nuevo fondo de 10 M€ para invertir en Spin-OffInKemia crea un nuevo fondo de 10 M€ para invertir en Spin-Off
InKemia crea un nuevo fondo de 10 M€ para invertir en Spin-Off
 
Informe Trimestral Banco Popular
Informe Trimestral Banco PopularInforme Trimestral Banco Popular
Informe Trimestral Banco Popular
 
Hecho relevante inkemia
Hecho relevante inkemiaHecho relevante inkemia
Hecho relevante inkemia
 
Inkemia_Hecho_Relevante_02_sep_2015
Inkemia_Hecho_Relevante_02_sep_2015Inkemia_Hecho_Relevante_02_sep_2015
Inkemia_Hecho_Relevante_02_sep_2015
 
Hecho relevante inkemia_iuct
Hecho relevante inkemia_iuctHecho relevante inkemia_iuct
Hecho relevante inkemia_iuct
 
Resultados 2014 de Inkemia (consolidados)
Resultados 2014 de Inkemia (consolidados)Resultados 2014 de Inkemia (consolidados)
Resultados 2014 de Inkemia (consolidados)
 
Informe mensual de "la Caixa" research
Informe mensual de "la Caixa" researchInforme mensual de "la Caixa" research
Informe mensual de "la Caixa" research
 
Comparativa impuesto de sociedades reforma fiscal
Comparativa impuesto de sociedades reforma fiscalComparativa impuesto de sociedades reforma fiscal
Comparativa impuesto de sociedades reforma fiscal
 
Programa bolsalia 2014
Programa bolsalia 2014 Programa bolsalia 2014
Programa bolsalia 2014
 
Hecho rel gpm
Hecho rel gpmHecho rel gpm
Hecho rel gpm
 
Hecho relevante inkemia
Hecho relevante inkemiaHecho relevante inkemia
Hecho relevante inkemia
 
La actualidad del mercado. Estrategias de inversión con Javier Urones de XTB
La actualidad del mercado. Estrategias de inversión con Javier Urones de XTBLa actualidad del mercado. Estrategias de inversión con Javier Urones de XTB
La actualidad del mercado. Estrategias de inversión con Javier Urones de XTB
 
Informe semanal bankinter 28 julio
Informe semanal bankinter 28 julioInforme semanal bankinter 28 julio
Informe semanal bankinter 28 julio
 
56303 h relev_20140722
56303 h relev_2014072256303 h relev_20140722
56303 h relev_20140722
 
Inkemia hecho relevante
Inkemia hecho relevanteInkemia hecho relevante
Inkemia hecho relevante
 
Carta inversor 07-07-2014
Carta inversor 07-07-2014Carta inversor 07-07-2014
Carta inversor 07-07-2014
 
Comunicado GOWEX
Comunicado GOWEXComunicado GOWEX
Comunicado GOWEX
 
58252 h relev_20140703 gowex
58252 h relev_20140703 gowex58252 h relev_20140703 gowex
58252 h relev_20140703 gowex
 
Aviso Suspension GOWEX
Aviso Suspension GOWEXAviso Suspension GOWEX
Aviso Suspension GOWEX
 

Resultados bayer

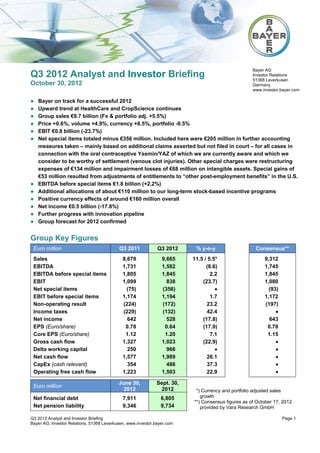
  • 1. Bayer AG Q3 2012 Analyst and Investor Briefing Investor Relations 51368 Leverkusen October 30, 2012 Germany www.investor.bayer.com  Bayer on track for a successful 2012  Upward trend at HealthCare and CropScience continues  Group sales €9.7 billion (Fx & portfolio adj. +5.5%)  Price +0.6%, volume +4.9%, currency +6.5%, portfolio -0.5%  EBIT €0.8 billion (-23.7%)  Net special items totaled minus €356 million. Included here were €205 million in further accounting measures taken – mainly based on additional claims asserted but not filed in court – for all cases in connection with the oral contraceptive Yasmin/YAZ of which we are currently aware and which we consider to be worthy of settlement (venous clot injuries). Other special charges were restructuring expenses of €134 million and impairment losses of €68 million on intangible assets. Special gains of €53 million resulted from adjustments of entitlements to “other post-employment benefits” in the U.S.  EBITDA before special items €1.8 billion (+2.2%)  Additional allocations of about €110 million to our long-term stock-based incentive programs  Positive currency effects of around €160 million overall  Net income €0.5 billion (-17.8%)  Further progress with innovation pipeline  Group forecast for 2012 confirmed Group Key Figures Euro million Q3 2011 Q3 2012 % y-o-y Consensus** Sales 8,670 9,665 11.5 / 5.5* 9,312 EBITDA 1,731 1,582 (8.6) 1,745 EBITDA before special items 1,805 1,845 2.2 1,845 EBIT 1,099 838 (23.7) 1,080 Net special items (75) (356)  (93) EBIT before special items 1,174 1,194 1.7 1,172 Non-operating result (224) (172) 23.2 (197) Income taxes (229) (132) 42.4  Net income 642 528 (17.8) 643 EPS (Euro/share) 0.78 0.64 (17.9) 0.78 Core EPS (Euro/share) 1.12 1.20 7.1 1.15 Gross cash flow 1,327 1,023 (22.9)  Delta working capital 250 966   Net cash flow 1,577 1,989 26.1  CapEx (cash relevant) 354 486 37.3  Operating free cash flow 1,223 1,503 22.9  June 30, Sept. 30, Euro million 2012 2012 *) Currency and portfolio adjusted sales Net financial debt 7,911 6,805 growth **) Consensus figures as of October 17, 2012 Net pension liability 9,346 9,734 provided by Vara Research GmbH Q3 2012 Analyst and Investor Briefing Page 1 Bayer AG, Investor Relations, 51368 Leverkusen, www.investor.bayer.com
  • 2. Bayer Group Forecast  Based on the exchange rates prevailing at the end of the third quarter, we confirm the sales and earnings forecast for the full year 2012 that we raised in July.  For the full year 2012, we continue to anticipate a currency- and portfolio-adjusted sales increase of between 4% and 5%. This would result in Group sales of between approximately €39 billion and €40 billion.  As before, we plan to increase EBITDA before special items by a high-single-digit percentage. We continue to expect to raise core earnings per share by about 10%.  In addition to the special charges already recognized, we anticipate further expenses of €0.2 billion for ongoing restructuring programs in the fourth quarter of 2012. HealthCare  HealthCare’s top priority remains to successfully commercialize the new pharmaceutical products.  We continue to expect sales to increase by between 3% and 4% after adjusting for currency and portfolio effects. We plan to improve EBITDA before special items by a mid- to high-single-digit percentage to which high positive currency effects will contribute.  We forecast sales of the Pharmaceuticals segment to move slightly higher on a currency- and portfolio- adjusted basis, with EBITDA before special items rising by a mid-single-digit percentage.  In the Consumer Health segment, we anticipate that sales will grow by a mid-single-digit percentage on a currency- and portfolio-adjusted basis and that EBITDA before special items will increase by a high- single-digit percentage. CropScience  As before, we anticipate that sales will advance by approximately 10% on a currency- and portfolio- adjusted basis and that EBITDA before special items will improve by approximately 20%.  We continue to predict above-market growth. MaterialScience  At MaterialScience, we anticipate a significant currency- and portfolio-adjusted sales gain and significantly higher EBITDA before special items in the fourth quarter of 2012 compared to the weak prior-year quarter.  For the full year 2012, we now expect sales to show a small currency- and portfolio-adjusted increase (previously: to remain level with the prior year) and continue to expect EBITDA before special items to remain level with the prior year. Further assumptions for 2012: CapEx: approx. €1.5 billion for property, plant and equipment and €0.4 billion for intangible assets Planned D&A: approx. €2.6 billion, including €1.3 billion amortization of intangibles R&D: approx. €3.0 billion Non-operating result: minus €0.7 billion to minus €0.8 billion Income tax-rate: approx. 25% The sales and earnings forecast for 2013 is given in Chapter 11.4 of the Annual Report 2011. Q3 2012 Analyst and Investor Briefing Page 2 Bayer AG, Investor Relations, 51368 Leverkusen, www.investor.bayer.com
  • 3. HealthCare Euro million Q3 2011 Q3 2012 % y-o-y Consensus** Sales 4,200 4,719 12.4 / 5.5* 4,543 Pharmaceuticals 2,420 2,734 13.0 / 6.1*  Consumer Health 1,780 1,985 11.5 / 4.7*  EBITDA before special items 1,226 1,297 5.8 1,272 Pharmaceuticals 768 827 7.7  Consumer Health 458 470 2.6  2011 figures for Pharmaceuticals and Consumer Health restated *) Currency and portfolio adjusted sales growth **) Consensus figures as of October 17, 2012 provided by Vara Research GmbH Best Selling Pharmaceutical Products Euro million Q3 2011 Q3 2012 % y-o-y % y-o-y Fx Kogenate 257 300 16.7 8.9 of which USA 70 95 35.7 20.3 Betaferon / Betaseron 289 292 1.0 (6.1) of which USA 126 150 19.0 4.8 YAZ product family 275 277 0.7 (4.0) of which USA 48 54 12.5 2.7 Nexavar 177 199 12.4 4.2 of which USA 45 55 22.2 7.7 Mirena 137 183 33.6 22.5 of which USA 71 113 59.2 41.5 Adalat 156 171 9.6 (0.3) of which USA 2 0   Aspirin Cardio 102 124 21.6 13.0 of which USA 0 0   Glucobay 88 122 38.6 23.5 of which USA 0 0   Avalox / Avelox 103 119 15.5 6.8 of which USA 16 14 (12.5) (26.9) Xarelto 20 81   of which USA 3 14   Levitra 75 75 0.0 (1.9) of which USA 20 19 (5.0) (6.0) Cipro / Ciprobay 53 65 22.6 17.3 of which USA -2 3   Zetia 45 55 22.2 8.1 of which USA 0 0   Diane 47 52 10.6 9.9 of which USA 0 0   Fosrenol 31 47 51.6 36.5 of which USA 0 0   %y-o-y Fx: Currency adjusted sales growth Q3 2012 Analyst and Investor Briefing Page 3 Bayer AG, Investor Relations, 51368 Leverkusen, www.investor.bayer.com
  • 4. Price +1.5%, volume +4.0%, currency +7.1%, portfolio -0.2%  At Pharmaceuticals, growth was achieved mainly in North America and in the emerging markets, especially China.  Kogenate developed positively, with growth driven by increased shipments to our distribution partner during this quarter and by higher volumes resulting from tender businesses in Australia.  Global sales of Betaferon receded mainly due to a decline in Europe.  YAZ product family was hampered by generic competition, especially in Western Europe. Sales gains in the Asia/Pacific and LatAm regions only partly compensated for this effect.  Nexavar mainly driven by business in China and the U.S.  Sales of Mirena increased mainly on higher volumes in the U.S.  Glucobay, Aspirin Cardio and Avelox benefited from continued extension of our marketing activities in China.  Xarelto with launches in further countries and indications. Strongest sales growth in Germany and the U.S.  Sales of Cipro benefited from a government contract in the United Kingdom.  Consumer Health mainly driven by Consumer Care and Animal Health. Consumer Care (€984 million, +5.1% Fx & portf. adj.), Medical Care (€661 million, +1.0% Fx & portf. adj.) and Animal Health (€340 million, +11.3% Fx & portf. adj.). Business developed especially well in the emerging markets and in North America.  Increase in EBITDA before special items at HealthCare largely attributable to good business development in the Pharmaceuticals segment and positive currency effects. CropScience Euro million Q3 2011 Q3 2012 % y-o-y Consensus** Sales 1,379 1,641 19.0 / 12.8* 1,534 Crop Protection / Seeds 1,265 1,511 19.4 / 13.1*  Environmental Science 114 130 14.0 / 8.8*  EBITDA before special items 165 189 14.5 201 *) Currency and portfolio adjusted sales growth **) Consensus figures as of October 17, 2012 provided by Vara Research GmbH LatAm/Africa/ Europe North America Asia/Pacific Middle East Q3 2012 Euro % y-o-y Euro % y-o-y Euro % y-o-y Euro % y-o-y million Fx million Fx million Fx million Fx CropScience 414 18.2 279 16.5 325 2.3 623 10.8 Crop Protection 361 16.7 199 10.7 286 2.6 567 10.5 %y-o-y Fx: Currency adjusted sales growth  Price +0.6%, volume +12.2%, currency +7.3%, portfolio -1.1%  Sales development at CropScience maintained nearly the same momentum as in the preceding quarters.  Business was supported by the positive market conditions, which in turn benefited from factors such as the persistently high prices for agricultural commodities.  Crop Protection with sales of €1,414 million (+11.7% Fx & portf. adj.) developed positively in all product groups and regions. Herbicides at €360 million (+4.3% Fx & portf. adj.), fungicides at €361 million (+15.5% Fx & portf. adj.), insecticides at €376 million (+7.5% Fx & portf. adj.) and SeedGrowth (formerly Seed Treatment) at €317 million (+23.7% Fx & portf. adj.). Q3 2012 Analyst and Investor Briefing Page 4 Bayer AG, Investor Relations, 51368 Leverkusen, www.investor.bayer.com
  • 5. Performance of Crop Protection in Europe mainly driven by strong SeedGrowth sales in Germany, France and the United Kingdom. Significant gains at herbicides. Fungicide and insecticide sales developed well.  Crop Protection achieved strong growth in North America. Business developed particularly well in the U.S., especially in SeedGrowth. The drought in the U.S. had no material effect on our business so far.  The moderate sales growth of the Crop Protection business in Asia/Pacific was largely attributable to increases for herbicides and SeedGrowth products. Sales in China and Australia improved considerably, while business in Japan and Thailand was below the high level of the prior-year period.  Crop Protection in LatAm/Africa/Middle East was mainly driven by increases in LatAm, especially Brazil, where the fungicides business developed especially well. Business with herbicides declined. In Argentina we saw a sharp rise in sales of insecticides. Overall positive performance in Africa and the Middle East.  Sales of Seeds (formerly BioScience) climbed by a substantial 39.1% (Fx & portfolio adj.) to €97 million. Growth was driven by the business in North America, particularly with canola seed. Sales of Nunhems vegetable seeds were level with the previous year.  At Environmental Science (€130 million, +8.8% Fx adj.) business with products for professional users expanded by a double-digit percentage. Sales of products for private customers remained level year on year.  The increase in EBITDA before special items at CropScience was attributable above all to higher volumes and to favorable currency effects. The progress made with our efficiency improvement programs also had a positive impact on earnings. However, manufacturing and selling expenses increased. MaterialScience Euro million Q3 2011 Q2 2012 Q3 2012 % y-o-y Consensus** Sales 2,768 2,962 2,992 8.1 / 2.9* 2,916 Polyurethanes 1,352 1,528 1,572 16.3 / 10.2*  Polycarbonates 749 728 720 (3.9) / (10.5)*  CAS 494 526 512 3.6 / 2.8*  Industrial Operations 173 180 188 8.7 / 4.6*  EBITDA before special items 348 385 333 (4.3) 354 CAS: Coatings, Adhesives, Specialties; Sales split for Q3’2011 and Q2’2012 restated *) Currency and portfolio adjusted sales growth **) Consensus figures as of October 17, 2012 provided by Vara Research GmbH  Price -0.4%, volume +3.3%, currency +5.9%, portfolio -0.7%  Sales growth was due to higher volumes overall. Volumes were flat with the prior year in Europe, while there was a gratifying increase in the other regions. Selling price increases in the LatAm/Africa/Middle East, Europe and North America regions nearly offset declines in Asia/Pacific.  Sales growth at Polyurethanes driven by higher volumes in all product groups and regions. We also achieved price increases in all regions except North America. Prices for TDI and MDI were up, while prices for polyether were below the prior-year period.  Sales at Polycarbonates declined compared to the strong prior-year quarter. This was attributable to lower selling prices and volumes in both product groups.  Sales of Coatings, Adhesives, Specialties increased due to higher volumes in all regions. Prices as a whole were somewhat below the prior-year period.  EBITDA before special items at MaterialScience declined largely as the result of increases in raw material and energy costs and a slight drop in selling prices. These factors were only partly offset by volume growth, savings from efficiency improvement measures, and positive currency effects. Q3 2012 Analyst and Investor Briefing Page 5 Bayer AG, Investor Relations, 51368 Leverkusen, www.investor.bayer.com
  • 6. Bayer Investor Relations contacts: Dr. Alexander Rosar (+49-214-30-81013) Dr. Jürgen Beunink (+49-214-30-65742) Peter Dahlhoff (+49-214-30-33022) Fabian Klingen (+49-214-30-35426) Judith Nestmann (+49-214-30-66836) Dr. Olaf Weber (+49-214-30-33567) Forward-looking statements This announcement may contain forward-looking statements based on current assumptions and forecasts made by Bayer Group or subgroup management. Various known and unknown risks, uncertainties and other factors could lead to material differences between the actual future results, financial situation, development or performance of the company and the estimates given here. These factors include those discussed in Bayer’s public reports which are available on the Bayer website at www.bayer.com. The company assumes no liability whatsoever to update these forward-looking statements or to conform them to future events or developments. Q3 2012 Analyst and Investor Briefing Page 6 Bayer AG, Investor Relations, 51368 Leverkusen, www.investor.bayer.com
  • 7. Key figures for Q3’2012 Q3 2012 Analyst and Investor Briefing Page 7 Bayer AG, Investor Relations, 51368 Leverkusen, www.investor.bayer.com